Technical Tuesday

Dr. Valery Rudnev on Equipment Selection for Induction Hardening: Single-Shot Hardening, Part 2

This article continues the ongoing discussion on Equipment Selection for Induction Hardening by Dr. Valery Rudnev, FASM, IFHTSE Fellow. Six previous installments in Dr. Rudnev’s series on equipment selection addressed selected aspects of scan hardening and continuous/progressive hardening systems. This post is the second in a discussion on equipment selection for one of four popular induction hardening techniques focusing on single-shot hardening systems.

The first part on equipment selection for single-shot hardening is here; the third part is here. To see the earlier articles in the Induction Hardening series at Heat Treat Today as well as other news about Dr. Rudnev, click here


Traditional Designs of Single-Shot Inductors

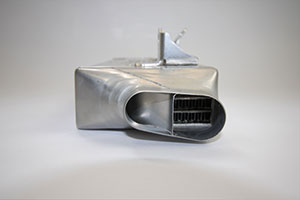
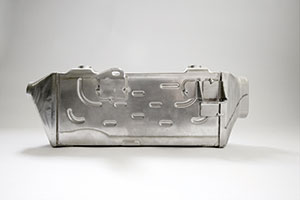
Figure 1 shows a typical shaft-like component (Figure 1,top-left) suitable for a single-shot hardening inductor, as well as a variety of traditionally designed single-shot inductors for surface hardening shaft-like workpieces. Sometimes, these inductors are also referred to as channel inductors.

A conventional single-shot inductor consists of two legs and two crossover segments, also known as bridges, “horseshoes,” or half-loops [1]. The induced eddy currents under the legs primarily flow along the length of the part (longitudinally/axially) with the exception of the regions of the workpiece located under the crossover segments where the flow of the eddy current is half circumferential. Unlike scanning inductors, traditional designs of single-shot inductors can be quite complicated.

Figure 1. A typical shaft-like component (top-left image) suitable for a single-shot hardening and a variety of traditionally designed single-shot inductors for surface hardening shaft-like workpieces (Courtesy of Inductoheat Inc., an Inductotherm Group company)

With a predominantly longitudinal eddy current flow, the heat uniformity in the diameter change areas of the stepped shafts is dramatically improved and the tendency of corners and shoulders to be overheated is reduced significantly compared to applying a single-turn or multi-turn solenoid coils commonly used in scan hardening and continuous/progressive hardening.

Because the copper of single-shot inductors does not completely encircle the entire region required to be heated, rotation must be used to create a sufficiently uniform austenitized surface layer along the workpiece perimeter. Upon quenching, a sufficiently uniform hardness case depth along the circumference of the part will be produced. For single-shot inductors, the rotation speed usually ranges from 120 to 500 rpm.

Different types of magnetic flux concentrators (also called flux intensifiers, flux controllers, flux diverters, magnetic shunts, etc.) complement the copper profiling of an inductor, helping to achieve the required hardness pattern. Flux concentrators may provide several considerable benefits when applied in single-shot inductors. This includes an increase of coil electrical efficiency, a noticeable reduction of coil current, and a significant reduction of the external magnetic field exposure.

As an example, Figure 2 shows a transverse cross-section of a single-shot inductor and a straight shaft. Computer-modeled electromagnetic field distribution of a bare inductor (Figure 2, left) compared to an inductor with a U-shaped flux concentrator (Figure 2, right) is shown. Note that the magnitude of magnetic field intensity on both images is different. The use of U-shaped magnetic flux concentrators in single-shot hardening applications typically results in a 16% to 27% coil current reduction compared to using a bare inductor while having a similar heating effect. A reduction of the external magnetic field exposure while applying flux concentrator is even more dramatic (Figure 2, right).

Figure 2.  Computer-modeled EMF distribution in the transverse cross-section of a bare inductor (left) compared to an inductor with U-shaped flux concentrator (right). Note: the scale of magnetic field intensity on both images is different [1].
Different applications may call for various materials used to fabricate magnetic flux concentrators including stacks of silicon-steel laminations, pure ferrites, and various proprietary multiphase composites. The selection of a particular material depends on a number of factors, including the following [1]:

  • applied frequency, power density, and duty cycle;
  • operating temperature and ability to be cooled;
  • geometries of workpiece and inductor;
  • machinability, formability, structural homogeneity, and integrity;
  • an ability to withstand an aggressive working environment resisting chemical attack by quenchants and corrosion;
  • brittleness, density, and ability to withstand occasional impact force;
  • ease of installation and removal, available space for installation, and so on.

It should be noted that, though in most single-shot hardening applications flux concentrators will improve efficiency, there are other cases where no improvement will be recorded, or efficiency may even drop. A detailed discussion regarding the subtleties of using magnetic flux concentrators is provided in [See References 1, 2.].

Sufficient rotation is critical when using any single-shot inductor design. As an example, Figure 3 shows the sketch of a single-shot induction hardening system.

Figure 3.  Sketch of single-shot induction hardening of an axle shaft. Note: The right half of this induction system is computer-modeled in Fig. 4 [3].
Taking advantage of symmetry, only the right side of such a system was modeled using finite-element analysis. Figure 4 shows the result of computer simulation of initial, interim, and final heating stages, taking into consideration the shaft rotation. Insufficient part rotation resulted in a non-uniform temperature distribution along the shaft perimeter (Figure 4, left). Proper shaft rotation results in a sufficiently uniform temperature pattern (Figure 4, right).

Figure 4.  Results of numerical simulation of heating an axle shaft by using a single-shot inductor [3].
There should be at least eight full rotations per heat cycle (preferably more than 12 rotations), depending on the size of the workpiece and the design specifics of the inductor, though, as always in life, there are some exceptions. Shorter heating times and narrower coil copper heating faces require faster rotation during the austenitization cycle.

An appropriate inductor design with a closely controlled and monitored rotation speed will produce a hardness pattern with minimum circumferential and longitudinal temperature deviations, which will result in sufficiently uniform hardness patterns (Figure 5, left four images). Failure to ensure proper rotation as well as the use of worn centers (lacking grabbing force resulting in slippage and excessive part wobbling) could lead to an unacceptable heat non-uniformity, severe local overheating, and even melting (Figure 5, right). Manufacturers of induction equipment such as Inductoheat have developed various proprietary tools, holders, fixtures, and monitoring devices to ensure proper rotation and high quality of single-shot hardened parts.

Figure 5.  Inductor design with closely controlled rotation speed will produce a hardness pattern with minimum circumferential temperature deviations (left four images). Failure to ensure proper rotation speed as well as the use of worn centers (lacking grabbing force resulting in slippage) could lead to unacceptable heat non-uniformity and can even cause a localized melting (right image).

The next installment of this column, "Dr. Valery Rudnev on . . . ", will continue the discussion of design features of induction single-shot hardening systems.

References

  1. V.Rudnev, D.Loveless, R.Cook, Handbook of Induction Heating, 2nd Edition, CRC Press, 2017.
  2. V.Rudnev, "An objective assessment of magnetic flux concentrators", Heat Treating Progress, ASM Intl., December 2004, pp 19-23.
  3. V.Rudnev, "Simulation of Induction Heat Treating", ASM Handbook, Volume 22B, Metals Process Simulation, D.U. Furrer and S.L. Semiatin, editors, ASM Int’l, 2010, pp 501-546.


Dr. Valery Rudnev on Equipment Selection for Induction Hardening: Single-Shot Hardening, Part 2 Read More »

Safeguarding Refractory Installation: 12 Vital Steps to a Flawless Dry-Out

Dan Szynal, VP of Engineering & Technical Services, Plibrico

Installing new refractory materials is a necessary furnace maintenance practice which needs to be done periodically. But extended downtime and installation errors can be a major financial and operational headache. In this article, Dan Szynal, VP of Engineering & Technical Services, Plibrico, gives 12 factors which will ensure that the refractory installation is successful.


At 700°F, steam can exert 3,000 psi pressure.

During an initial dry-out, the powerful effects of superheated steam can cause explosive, devastating consequences to freshly cured refractory material. To that end, removing moisture from castable and precast shapes is a serious pursuit. The production pressures to minimize downtime can lead to shortcuts and rushed dry-out procedures. Usually, these sidesteps have the opposite effect, quickly compounding delays and costs by causing thermal damage to the linings and potentially incurring personal injury.

Dry-outs fail due to imprecise management of water extraction from refractories. At the boiling point of water, the pressure of steam is less than 1 psi. However, at 700°F, saturated steam reaches 3,000 psi, and possesses enough energy to disintegrate the most resilient refractories. Too much heat, rapid ramp-ups, vapor lock, poor curing, and surplus water can contribute to potentially hazardous situations.

Here are the 12 preventive factors to manage for dry-out safety and success:

1. Hot spots and flame impingement. Ensure that your burner flame is centered accurately. The direction of flame in the vessel must promote equal heating of all the refractory surfaces. A flame that impinges on a single area of the surface will quickly create a hot spot, forcing an unequal expansion of water vapor in that area and resulting in thermal spalling.

Thermocouples need to be monitored at both hot and cold areas to measure temperature consistency.

2. Temperature spikes. Insulation is ill-advised. Attempting to cover green castable with an insulating blanket can lead to destructive temperature spiking when the blanket is removed, breaks, or falls off. At a wall surface temperature of only 550°F, the removal of insulation exposes the surface to an extreme temperature shift which will activate unequal steam expansion and pressure.

3. Thermocouple placement and monitoring. Pay attention to the locations and readings of your TCs. Watching only the coldest location will allow the hottest area of your vessel to heat too quickly in the dry-out schedule. Conversely, monitoring only the hottest area will allow the colder area to retain more water than specified. This will lead to failure later in the schedule or during hold periods. At 700°F, steam can exert 3,000 psi pressure.

4. Air temperature vs. surface temperature. Thermocouples should report surface temperature. Air temperatures are typically 50°F to 100°F hotter, thus misreporting schedule impact. The initial hold period is typically designed to melt burn-out fibers. That creates important permeability. If the actual load temperature is lower than specified, permeability is not created, leading to failure in the next ramp-up period.

Pre-cast refractory requires longer bake-out schedules to release all water vapor.

5. Field vs. precast dry-out schedule. A field dry-out schedule is specified for single-sided heating. It precipitates a dual water migration, first (stage 1) towards the heat as the path of least resistance, but then reversing course (stage 2) and moving away from the heat, escaping towards the furnace shell. Field dry-outs are faster schedules than precast, where the pieces are heated from all sides simultaneously. The precast water migrates to the center of the piece, and that takes longer to escape. By misapplying the faster field dry-out to precast, there is a greater risk of water retention, which will ultimately lead to spalling, even at temperatures of 550°F or less.

6. Venting and air circulation. Proper venting is required to rid the furnace of water vapor during dry-out. Without vents and free air circulation, the steam is forced to exit via the furnace shell, which takes longer than the schedule would provide. Water will be retained closer to the shell side, increasing the likelihood for disintegration as temperature and steam pressure rise.

7. Surface coating. An impermeable coating on the refractory surface will prevent the stage 1 escape of water. Slowly, this water will be forced to move to its second exit, the furnace shell. This delay prepares the still-saturated refractory for failure at the next heat ramp-up.

8. Clear obstruction from weep holes. As stage 2 water migration occurs, it will escape to the furnace shell. There should be adequate weep hole capacity, cleared of obstructions which will allow the water to exit the furnace shell. These provide a release valve for buildup of steam pressure. Thermocouples need to be monitored at both hot and cold areas to measure temperature consistency. Pre-cast refractory requires longer bake-out schedules to release all water vapor.

9. Cold weather curing. In the curing process, simple hydrates form needle-like morphology. These structures promote permeability, and water/steam can more easily migrate through the refractory to escape. Curing in below-freezing temperatures alters the hydrates to be less permeable, thus trapping the water, even during dry-out and creating an inherent risk. As well, cold weather curing slows the required strengthening process, leading to a weaker refractory and likely spall. We have had a thermal operator tell us about a below-freezing cure that went badly: The water in the castable actually froze in place. When the dry-out was initiated, the castable melted and fell to the floor, where it subsequently cured and dried.

10. Cutting short cure time. Recommended dry-out schedules always assume a 24-hour equivalent curing time at moderate temperatures. By cutting short the cure time, water is retained, and strength is reduced. For example, a conventional castable requires 24 hours cure time; high cement/low moisture castable needs at least 16 hours. Adherence to product cure time specifications ensures optimum strength and a successful dry-out.

11. Free water removal without consideration. The goal of curing and dry-out is to create permeability in the refractory at lower temperatures (300°F) to enable water to escape. By quickly ramping up dry-out temperatures for the sake of time, permeability is diminished. At higher temperatures, (+500°F) steam pressure rises aggressively. Again, refractory composition drives curing and dry-out schedules, and as a rule, the faster temperatures rise beyond specification, the higher the risk of failure.

Pre-cast shapes spall at 550°F.

12. Refractory strength as a function of water content. A simple 1% excess of water will reduce refractory strength by as much as 20%. Overwatering by 1.5% cuts strength 25% to 40%. The implications are profound: the refractory will not withstand the steam pressures in dry-out, and worse yet, there is more water that must be extracted. A successful dry-out can be jeopardized by the slightest variance in water composition.

Conclusion

Meticulous care in refractory installation is the foundation to successful furnace operation. While no one looks forward to non-productive downtime, close adherence to product specifications, cure times, and dry-out schedules will ensure a more profitable return to operations. Managing the water issues in refractory composition is job one.

Safeguarding Refractory Installation: 12 Vital Steps to a Flawless Dry-Out Read More »

Tackling Failure Due to Stress Corrosion Cracking by Breaking “a Few Cardinal Rules”


Source: Paulo


The heat treating of constant tension bands used by automakers is a complex process, and the challenge posed to a leading heat treating company by a supplier of these bands was to determine how to reduce the risk of failure due to stress corrosion cracking.

“Improving the physical characteristics of metal components often requires fine-tuned treatments that bring them to the brink of destruction. It’s a quirk of metallurgy heat treaters contend with constantly.”

Solving the problem involved, as noted in this case study from Paulo, breaking “a few cardinal rules en route.”


Read more: “Case study: Unconventional Treatment Improves Quality of Constant Tension Bands”

Tackling Failure Due to Stress Corrosion Cracking by Breaking “a Few Cardinal Rules” Read More »

Using Virtual Tools for Quenching Process Design

By validating CFD simulation results with thermocouple data, Ford Motor Company is now using virtual tools to study aluminum cylinder head quenching process and gains valuable information for process design and optimization. James Jan and Madhusudhan Nannapuraju presented a study titled “CFD Investigation of Quench Media and Orientation Effects on Structural Stress Induced in the Intense Quenching Processes for Aluminum Cylinder Heads” at Heat Treat 2017 as part of the proceedings of the 29th ASM Heat Treating Society Conference, October 24–26, 2017, Columbus, Ohio, USA. (Copyright © 2017 ASM International® All rights reserved.)

This article is a synopsis of the study, which can be read in its entirety here: “CFD Investigation of Quench Media and Orientation Effects on Structural Stress Induced in the Intense Quenching Processes for Aluminum Cylinder Heads”


Heat treatment is a common manufacturing process to produce high-performance components. Although heat treatment incorporating a quenching process can produce parts with durable mechanical properties, an unwanted effect of intense quenching is the induced thermal residual stress, which often is a leading cause for quality issues associated with high cycle fatigues. During the product development cycle, it is not uncommon to switch between air and water quenching and change quench orientation in order to minimize residual stress. However, the choice of quench media and quench orientation is often determined by intuitive engineering judgment at best and trial-and-error iterative method at worst.

In recent years, digital verification using finite element analysis (FEA) is gaining popularity because of its efficiency. The computational method to predict the residual stress involves two calculations. The first step is to calculate the temperature history; then the temperature data is used as thermal-load-to-structure analysis for stress and deformation calculation.

A popular method for temperature calculation is the heat transfer coefficient (HTC) method, however, the biggest drawback of HTC method is that the method relies on thermocouple measurement for calibration and the calibrated HTC may not be applicable to different design and quenching process. With the advancement in computation fluid dynamics CFD technologies, the temperature history in quenching now can be accurately calculated. Since thermal residual stress is directly linked to non-uniform temperature distribution in the metal, spatial temperature gradient is evaluated to study the performance of different quench media and configuration.

Figure 1: Heat treatment process for aluminum cylinder heads and quality concern associated with quenching process.

Air Quench Process for Cylinder Heads

The main heat extraction mechanism in air quenching is forced convection. In our CFD model, it is assumed that the buoyancy effect and radiation heat transfer have a negligible impact on the accuracy. The CFD simulation results are compared with thermocouple readings, and the overlapping curves illustrate an excellent agreement and validate our model.

Figure 2: CFD model and comparison to thermocouple measurement for air quenching a cylinder block with riser attached.

We use CFD to study and compare four different air quenching configurations. One unique advantage of CFD simulation over physical testing is its capability to visualize flow patterns and to identify low heat transfer regions under stagnant air pockets. The quenching configuration (a), (b) and (c) represent a conveyer style quenching environment, (d) represents a basket style quenching environment. See Figure 3.

Figure 3: Air flow and air pockets surrounding cylinder head for all air quenching configurations, 60 seconds into quenching.

The cooling curve plot shows that the cylinder head quenched in a basket (d) cools faster compared to those quenched on a conveyer (a), (b), and (c). According to the temperature gradients plot, basket quenching (d) cools faster at a higher temperature gradient than conveyer quenching (a) and (c). The only exception is (b). In-depth investigation of the location of high-temperature gradient indicates that the regions between the water jacket and intake port are susceptible to high residual stress.

Figure 4: Cooling curve and temperature gradient for all air quenching configurations.

Figure 5: High-temperature gradient locations for conveyer quenching (a) and basket quenching (d), 60 seconds into quenching.

Water Quench Process for Cylinder Heads

The physics of water quenching is much more involved than air quenching. Ford Motor Company adapted the quench model framework by AVL FIRE™, which is based on the Eulerian-Eulerian multiphase model, and developed our own proprietary database to simulate the water boiling process. Extensive work has been done on computation and experiments to validate the numerical methods. The CFD simulations compared to lab experiment on cooling curves provide strong evidence that our CFD model is accurate and that it can predict temperature profile on every quenching orientation without calibration.

Figure 6: Experimental and CFD simulation for cylinder block; cooling curves from CFD and thermocouple are plotted together for comparison.

Six different quench orientations are studied, and the vapor patterns and vapor pockets are plotted for in-depth investigation. The cooling curve and temperature gradient plot illustrate that orientation has little impact on overall cooling characteristics, and maximum temperature gradient is similar except that they occur at different time, even though the vapor pattern and locations of vapor pockets are drastically different in each quenching orientations.

Figure 7: Vapor Pattern and Vapor Pocket Entrapped inside Cylinder Heads, 20 seconds into quenching.

Figure 8: Cooling curve and maximum temperature gradient for all water quenching configurations.

Observing the location of the high-temperature gradient, for rear face up (RE) and cam cover face up (CC) quenching, high-temperature gradient appears in the intake port area, similar to the air quenching cases. Since the high-temperature gradient is observed near the intake port for all quenching cases, both air quenching and water quenching, very likely it is a design-related issue.

Figure 9: High-Temperature Gradient Locations for Rear Face up (RE) and Cam Cover Face up Quenching (CC), 20 seconds into Quenching.

Comparison of Air and Water Quenching Process

The underlying heat extraction for air and water quenching is very different. While air quenching relies on convection heat transfer to cool the metal, water quenching relies on water to vapor phase change to take the heat away. Therefore, metal cools significantly faster in water quenching than in air quenching. The maximum temperature gradient for water quenching is also much larger than air quenching. Since water only vaporizes in areas in contact with a hot surface, the heat loss is a local phenomenon subject to vapor escape route and the supply of fresh water. In other words, the heat transfer may not be as smooth as air quenching and it is reflected in the fluctuation of high-temperature gradient plot.

A much higher temperature gradient in water quenching does not necessarily generate much higher residual stress. We can also see in the plot that the duration of peak temperature gradient only lasts about 15 seconds. In this duration, the metal may exceed yielding stress and plastic deformation starts. However, the final deformation also depends on how long the state of stress stays in plastic deformation zone.

Figure 10: Cooling curve and maximum temperature gradient for selected air and water quenching configurations.

Conclusions

The rapid, large temperature drop in the quenching process has two opposite effects on the eventual outcome. On one hand, the large cooling rate produces metals with better quality, but it also induces residual stress. Thanks to the advancement of 3D CFD methodology, now the metal cooling in the quenching process can be much better understood using computer simulations. By using validated air and water quench modeling method, we compared the cooling curves and temperature gradient to evaluate quenching performance for various quenching configurations.

For air quenching processes, the study finds that cylinder heads cool faster in basket quenching than in conveyer quenching environment. The explanation is that airflow is accelerated when passing through the narrow gaps between cylinder heads in basket quenching. For water quenching processes, the study finds the orientation has little effect on the overall cooling rate as well as maximum temperature gradient except for a time shift in the maximum gradient. The results also show that the temperature gradient in water quenching is significantly larger than air quenching but last a much shorter period of time. Studying the temperature gradient for all air and water quenching case reveals a weak spot between the intake port and water jacket. Since this spot appears in all quenching cases, it should be remedied by a design change rather than changing the manufacturing process alone.

References

  • Koc, M., Culp, J., Altan, T. “Prediction of Residual Stresses in Quenched Aluminum Blocks and Their Reduction through Cold Working Processes,” Journal of materials processing technology, 174.1 (2006), pp342-354.
  • Wang, D.M., Alajbegovic, A., Su, X.M., Jan, J., “Numerical Modelling of Quench Cooling Using Eulerian Two-Fluid Method”, Proceedings of IMECE 2002, ASME-33499 Heat Transfer, vol. 3, 2003, pp. 179-185. LA, USA.
  • Srinivasan, V., Moon, K., Greif, D., Wang, D.M., Kim, M., “Numerical Simulation of Immersion Quench Cooling Process”: Part I, Proceedings in the International Mechanical Engineering Congress and Exposition, IMECE2008, Paper no: IMECE2008-69280, Boston, Massachusetts, USA, 2008.
  • Srinivasan, V., Moon, K., Greif, D., Wang, D.M., Kim, M., “Numerical Simulation of Immersion Quench Cooling Process”: Part II, Proceedings in the International Mechanical Engineering Congress and Exposition, IMECE2008, Paper no: IMECE2008-69281, Boston, Massachusetts, USA, 2008.
  • Kopun, R., Škerget, L., Hriberšek, M., Zhang, D., Stauder, B., Greif, D., “Numerical simulation of immersion quenching process for cast aluminium part at different pool temperatures”, Applied Thermal Engineering 65, pp. 74-84, 2014
  • Jan, J., Prabhu, E., Lasecki, J., Weiss, U, “Development and Validation of CFD Methodology to Simulate Water Quenching Process,” Proceedings of the ASME 2014 International Manufacturing Science and Engineering Conference, Detroit Michigan, 2014.


Photo credit for all images: Ford Motor Company; cited in “CFD Investigation of Quench Media and Orientation Effects on Structural Stress Induced in the Intense Quenching Processes for Aluminum Cylinder Heads”, Heat Treat 2017: Proceedings of the 29th ASM Heat Treating Society Conference October 24–26, 2017, Columbus, Ohio, USA.


Using Virtual Tools for Quenching Process Design Read More »

Induction Heat Treat: Considerations for Inductor Design


Source: Fluxtrol.com

Induction heat treaters know that proper coil design is crucial to increasing longevity, improving production quality, and cutting costs. Among the topics addressed in this paper about induction heat treat coil design and fabrication (presented by R. Goldstein, W. Stuehr, and M. Blackby at ASM International) are these:

  • The design and fabrication of induction heating coils over the years
  • The Variable of Flow and the Influence of Frequency
  • Control and Presentation
  • Structure, Quenching, and Cooling
The paper closes out with a case study using computer simulation to show typical temperature distributions in a single-shot induction hardening coil.
A good place to start whenever preparing parts for induction heat treating is the consideration of inductor design. The authors provide this list (an excerpt):
[spacer color="264C84" icon="Select a Icon"]

Considerations for Inductor Design

Induction heat treating coils are available in many shapes and sizes and must perform a variety of tasks in a given induction heat treating application. Depending on the application, the induction coil design requirements include:

  • Meet heat treatment specifications in desired production rates
  • Be robust enough to tolerate manufacturing variations
  • Mount into the induction machine
  • Have electrical parameters that match the induction power supply
  • Deliver quench
  • Have a satisfactory lifetime
  • Have satisfactory efficiency
  • Be repeatable from inductor to inductor

In developing a new induction heat treating coil and process, the first question is whether the component will be produced on an existing system or if a new machine must be built. In many cases, the part producer’s desire is to develop new tooling for an existing machine with spare capacity. This reduces the degree of freedom and can make the induction coil design procedure more complicated because a less-than-optimal frequency or coil style will be necessitated to fit the existing machine (Ref 16).

To determine the ability to use existing equipment, it is necessary to make an analysis of the part to be heat treated. Part material, prior processing, geometry, production rate, and heat treatment specifications all play roles. The part material and prior processing determine what the minimum heat treatment temperature should be, along with how much time is allowed for cooling. The part geometry and heat treatment specifications indicate how much energy is required, what the preferred frequency ranges are, and what type of induction method (i.e., single shot, scanning) is best suited for the application. Finally, the production rate determines how much power and/or how many spindles or stations are required.

Read more: "Design and Fabrication of Inductors for Induction Heat Treating"


Induction Heat Treat: Considerations for Inductor Design Read More »

Conquering Aluminum Furnace Corundum: Effective Controls for Corundum Growth That Improve Quality and Cut Costs

Dan Szynal, VP of Engineering & Technical Services, Plibrico

Aluminum processors face constant challenges to their aluminum melt operations. Due to robust demand, processors often operate these furnaces at higher temperatures to maximize production rates. As a result, one of the costliest operational challenges is the aggressive formation of corundum deposits in their furnaces.

In this article, Dan Szynal, VP of Engineering & Technical Services, Plibrico, discusses the causes and concerns of corundum growth and outlines excessive, damaging, and costly corundum growth can be mitigated with the right refractory materials, coupled with the correct maintenance and watchful operation.


Root Causes of Corundum Growth


Corundum growth in a refractory lining of an aluminum furnace occurs due to a reaction between the alumina-silicate refractory and molten aluminum. Corundum formation can occur both externally and internally in the refractory lining.

There are four identifiable root causes that promote corundum growth:

  1. High temperature
  2. Presence of oxygen
  3. Alloy composition
  4. Use of fluxes and fluoride salts

Corundum Formation Illustration

High temperatures accelerate the reduction of oxides in the refractory. The higher the temperatures, the more quickly non-wetting agents lose their effectiveness. Aluminum begins to penetrate the refractory matrix because of decreases in aluminum viscosity and surface tension. Excessive furnace temperature can be the result of several causes: overfiring, improper furnace control, or inaccurate thermocouple placement. For example, a thermocouple that is recessed into the refractory lining by 2 inches may underreport temperatures by several hundred degrees.

Oxygen drives the reaction process in two ways: as an atmospheric gas, and as a reducible oxide in the refractory. Minimizing oxygen by controlling negative pressure sources such as doors, windows, and well openings reduces the potential for reaction. Proper flue sizing and burner stoichiometry also reduce excess oxygen and improve furnace energy efficiency.

Alloy composition can be a factor. Some aluminum alloys contain elements that reduce the silica as well as iron oxide, zinc oxide, and other oxides in refractories. Careful attention is necessary when choosing an appropriate refractory for more aggressive aluminum alloys to reduce the potential for reaction.

The use of fluxes and fluoride salts like cryolite Na3AlF6 in aluminum melting accelerate the reduction of oxides in the refractory. Their alkaline properties also reduce the local melt temperature of the refractory at the bellyband and then infiltrate the furnace lining. Over time, with a lack of regular maintenance, the corundum buildup will reduce furnace performance and increase aluminum loss.

Trouble Spots

The spread of corundum growth occurs most commonly in areas where its formation mechanisms of heat and oxygen are present. Typical problem areas include doors, openings, flue areas, and burner cones due to the potential for excess oxygen. Negative furnace pressure can also lead to leakage from the outside. Other common areas of formation include rear walls and bellyband areas where regular cleaning and maintenance are more difficult.

Control and Avoidance

The key to fighting corundum starts with choosing the proper refractory material for molten aluminum contact. The development of effective refractory additives that combat corundum, including non-wetting additives, dense oxide barrier formers, and pore-size reducers was pioneered by Plibrico, which includes these additives in products aimed at:

  • increasing wetting resistance and reducing the potential for oxidation-reduction of the refractory (The Plicast Al-Tuff® system)
  • forming a reactive layer to resist molten aluminum penetration up to 2000°F (Plibrico’s Al-Shield™ refractories)
  • offering good resistance to metal slag penetration, especially in higher temperatures, and adhering well to the existing refractory for repairs (Phos-bonded castables like Plibrico’s Exo-set Uno™)

In general, PliPartner refractory contractors tell us that they find phos-bonded plastic refractories to be excellent repair materials for aluminum processors. They are usually low in free silica and nonwetting. The material bonds chemically to existing refractory, making them easier to install, and phos-bonded plastic refractories are an excellent solution for corundum growth at the bellyband.

Best Practices That Will Help

A regular maintenance plan can go a long way to increasing refractory life; a schedule is essential. A knowledgeable refractory expert with genuine experience in aluminum heat processes can help with ideal schedules and checklists.

Corundum buildup is a common concern among aluminum furnace end users. Optimally, the longevity of a furnace lining depends on best practices in refractory materials and installation methods, knowing the past refractory performance history to evaluate future performance, managing expectations of furnace production output, and monitoring regular maintenance and operation of the furnace.

These factors are measurable key performance indicators that will help decision makers design and build good refractory linings for the demanding needs of aluminum producers today. Considering these factors and balancing them according to the producers’ needs can deliver a higher-quality product for longer life.


Conquering Aluminum Furnace Corundum: Effective Controls for Corundum Growth That Improve Quality and Cut Costs Read More »

Applying “Thru-Process” Temperature Surveying To Meet the TUS Challenges of CQI-9

Dr. Steve Offley, a.k.a. “Dr. O”

Sponsored content

In the modern automotive manufacturing industry, CQI-9 HTSA (AIAG) has become a key part of driving process and product quality in heat treatment applications. The standard has a broad scope and covers many different aspects of common heat treatment processes (see Process Tables A-H in the standard) and monitoring requirements used. A critical part of the standard is the requirement to perform a temperature uniformity surveys (TUS) in order to validate the temperature uniformity of the qualified work zones and operating temperature ranges of furnaces or ovens used. In this Heat Treat Product Spotlight, Dr. Steve Offley, a.k.a. “Dr. O”, Product Marketing Manager with PhoenixTM, discusses the challenges of performing a TUS on continuous furnace types and one possible solution his company offers.


CQI-9 Heat Treat System Assessment

A critical part of the CQI-9 HTSA (AIAG) standard is the requirement to perform temperature uniformity surveys (TUSs). The TUS is performed to validate the temperature uniformity characteristics of the qualified work zones and operating temperature ranges of furnaces or ovens used. (See Figure 1.)

Fig 1: Schematic showing TUS principle. Thermocouple measurement from the field test instrument, of the furnace’s actual operational temperature, against a setpoint to check that it is within tolerance. Setpoints and tolerances are defined in CQI-9 Process Tables A-H to match each heat treat process.

The “Thru-Process” TUS Principle

Traditionally, TUSs are performed by using a field test instrument (chart recorder or static data logger) external to the furnace with thermocouples trailing into the furnace heating chamber. This technique has many limitations, especially when the product transfer is continuous such as in a pusher or conveyor-type furnace. The trailing thermocouple method is often labor-intensive, potentially unsafe, and can create compromises to the TUS data being collected (e.g., number of measurement points possible, thermocouple damage, and physical snagging of the thermocouple in the furnace).

Fig 2: PhoenixTM thermal barrier being loaded into a batch furnace with a survey frame as part of the TUS process.

The “Thru-Process” TUS principle overcomes the problems of trailing thermocouples as the multi-channel data logger (field test instrument) travels into and through the heat treat process protected by a thermal barrier (Figure 2). The short thermocouples are fixed to the TUS frame. Temperature data is then transmitted live to a monitoring PC running TUS analysis software, via a 2-way RF telemetry link.

Data Logger Options

To comply with CQI-9, field test equipment needs to be calibrated every 12 months minimum, against a primary or secondary standard. The data logger accuracy needs to be a minimum +/-0.6 °C (+/-1.0 °F) or +/-0.1% (TABLE 3.2.1).

Fig 3: PhoenixTM PTM1220 20 Channel IP67 data logger comes calibrated to UKAS ISO/IEC17025 as an option with an onboard calibration data file allowing direct data logger correction factors to be applied automatically to TUS data.

The data logger shown in Figure 3 has been designed specifically to meet the CQI-9 TUS requirements offering a +/- (0.5°F (0.3°C) accuracy (K & N). Models ranging from 6 to 20 channels can be provided with a variety of noble and base metal thermocouple options (types K, N, R, S, B) to suit measurement temperature and accuracy demands (AMS2750E and CQI-9).

Mixed thermocouple inputs can be provided to support the process specific requirements and also allow the use of the data logger to perform system accuracy testing (SAT) to complement the TUS.

Innovative Thermal Barrier Design

Fig 4: “Octagonal” thermal barrier fitted to product/survey tray.

CQI-9 covers a wide range of thermal heat treatment processes and as such the thermal protection for the data logger will vary significantly. A comprehensive range of thermal barrier solutions can be provided to meet specific process temperature requirements and space limitations. Figure 4 shows a unique octagonal thermal barrier designed to fit within the boundaries of the product tray/survey frame used to perform a TUS using the “plane method” (See “Thermocouple Measurement Positions (TUS)” below in this article.). The design ensures maximum thermal performance within the confines of a restricted product tray/basket.

Live Radio TUS Communication

Fig 5: Schematic of LwMesh 2-way RF Telemetry communication link from data logger TUS measurement back to an external computer.

The data logger is available with a unique 2-way wireless RF system option allowing live monitoring of temperatures as the system travels through the furnace. Analysis of process data at each TUS level can be done live allowing full efficient control of the TUS process. Furthermore, if necessary, by using the RF system, it is possible to communicate with the logger installed in the barrier to reset/download at any point pre-, during, and post-TUS. In many processes, there will be locations where it is physically impossible to transmit a strong RF signal. With conventional systems, this results in process data gaps. For the system shown in Figure 2, this is prevented using a unique fully automatic “catch up” feature.

Any data that is missed will be sent when the RF signal is re-established, guaranteeing 100% data transfer.

Thermocouple Options (TUS)

In accordance with the CQI-9 standard (Tables 3.1.3 / 3.1.5), thermocouples supplied with the data logger, whether expendable or nonexpendable, meet the specification requirements of accuracy +/-2.0°F (+/-1.1°C) or 0.4%. Calibration certificates can be offered to allow the creation of thermocouple correction factor files to be generated and automatically applied to the TUS data within the PhoenixTM Thermal View Survey Software. Care must be taken by the operator to ensure that usage of thermocouples complies with the recommended TUS life expectancies and repeat calibration frequencies. Before first use, thermocouples must be calibrated with a working temperature range interval not greater than 250°F (150°C). Replacement or recalibration of noble metal (B, R or S) thermocouples is required every 2 years. For non-expendable base metal (K, N, J, E), thermocouples replacement should be after 180 uses <1796°F (980°C) or 90 uses >1796°F (980°C). For expendable base metal (K, N, J, E), thermocouples replacement should be after 15 uses <1796°F (980°C) or 1 use >1796°F (980°C). Note that base metal thermocouples should not be recalibrated.

Thermocouple Measurement Positions (TUS)

To perform the TUS survey, a TUS frame needs to be constructed to locate the thermocouples over the standard work zone to match the form of the furnace. The TUS may be performed in either an empty furnace in which case thermocouples should be securely fixed as shown in Figure 6. A heat sink (thermal mass fixed to thermocouple tip) can be used to create a thermal load to match the normal product heating characteristics. Alternatively, the thermocouples should be buried in the load/filled product basket. See Figure 6 to see schematics of TUS Frames for a box and cylindrical batch furnace with CQI-9-quoted number of thermocouples required to match void volume (Volumetric Method Table 3.4.1).

Fig 6: TUS Thermocouple Test Rigs. Required number of thermocouples: 1) Work Volume < 0.1 m³ (3 ft³) = 5; 2) Work Volume 0.1 to 8.5 m³ (3 to 300 ft³) = 9; 3) Work Volume > 8.5 m³ one thermocouple for every 3 m³ (105 ft³). (Click on the images for larger display.)

Fig. 7.1, 7.2. PhoenixTM system showing 9 Point TUS survey rig and Thermal View Software TUS frame library file showing as part of TUS report exactly where thermocouples are positioned. (Click on the images for larger display.)


For continuous conveyorized furnaces, it is recommended that an alternative thermocouple test rig is employed called the “plane method”. Since the system travels through the furnace it is only necessary to monitor the temperature uniformity over a 2-dimensional plane/slice of the furnace (Figure 8). The required number and location of thermocouples are shown in Table 1 (CQI-9 Table 3.4.2).

(Click on the images for larger display.)

Table 1: Required thermocouples and locations for differing work zones (Plane Method)

(1) 2 Thermocouples within 50 mm work zone corners 1 Thermocouple center. (2) 4 Thermocouples within 50 mm work zone corners. Rest symmetrically distributed.

“Thru-Process” Temperature Uniformity Survey (TUS) Data Analysis and Reporting

Operating the PhoenixTM System with RF Telemetry, TUS data is transferred from the furnace directly back to the monitoring PC where, at each survey level, temperature stabilization and temperature overshoot can be monitored live, with thermocouple and logger correction factors applied. The Thermal View Survey software generates TUS reports which comply with the requirements of AMS2750E/CQI-9 standards.

As defined in CQI-9 (Section 3.4) for furnace with an operating temperature range ≤ 305°F (170°C), one setpoint temperature (TUS level) within the operating temperature range is required. If the operating temperature of the qualified work zone is greater than 305°F (170°C), then the minimum and maximum temperatures of the operating temperatures range shall be tested.

The TUS levels can be automatically set up in the TUS analysis software. Figure 9 shows both the TUS level file and TUS levels applied against the TUS survey trace.

Fig. 9.1

Fig. 9.2

Fig 9.1, 9.2 PhoenixTM Thermal View Survey Software showing TUS Level set-up and application to TUS trace.

Within CQI-9, there is a very prescriptive list of what should be contained in the TUS report (Section 3.4.9).

To comply with all said requirements, the software package provides a comprehensive reporting package as shown below.

Fig 10.1, 10.2, 10.3.  TUS Report showing a TUS profile at three set survey temperatures (graphical and numerical data). The probe map shows exactly where each thermocouple is located and easy trace identification. A detailed TUS report is generated, meeting full CQI-9 reporting requirements. (Click on the images for larger display.)

Overview

The PhoenixTM Thru-Process TUS System provides a versatile solution for performing product temperature profiling and furnace surveying in industrial heat treatment meeting all TUS requirements of CQI-9 within the automotive manufacturing industry, providing the means to understand, control, optimize and certify the heat treat process.

Applying “Thru-Process” Temperature Surveying To Meet the TUS Challenges of CQI-9 Read More »

Vacuum Brazing for Automotive Applications

Alessandro Fiorese, R&D Chief Engineer with TAV Vacuum Furnaces SPA

Alessandro Fiorese, R&D Chief Engineer with TAV Vacuum Furnaces SPA, introduces the vacuum brazing process for automotive applications. For more articles, tips, and news related to heat treatment for automotive applications, keep an eye out for Heat Treat Today’s special print/digital issue Automotive Heat Treating, due in June 2019.


Introduction

Brazing is a heat treatment process in which metallic parts are joined together through a metallic filler with a melting temperature lower than the melting point of the joined parts. The filler metal can be used as a wire, a thin plate, or a paste depending upon the final application we are considering.

To obtain a good welding in terms of mechanical properties and corrosion resistance, it’s necessary to minimize contamination and impurities in the joined zone. Vacuum brazing processing provides a way to reach a high cleaning level of atmosphere during the brazing heat treatment.

The brazing treatment is particularly useful to produce complex shape parts with a lot of joining points per unit of area. Typical brazing applications are oil or water heat exchangers in the civil and automotive fields such as the ones represented below.

The high-performance aluminum heat exchangers manufacturing is growing particularly in the automotive field. In this context, AA 3xxx and 4xxx are commonly used materials for parts and filler material respectively because these materials have a very low specific weight and a very high thermal conductivity level.

As indicated before, one of the cleanest brazing atmospheres is vacuum. For this reason, in the following discussion, we will analyze in detail the complete characteristics of a semi-automatic TAV vacuum brazing furnace for automotive applications.

Vacuum Brazing Furnace

The entire furnace is composed of three different stations:

  • the heating furnace;
  • the loading station;
  • the cooling station.

Heating Furnace

heating furnace

Furnace Vessel

The vessel separates the inner part of the furnace where the hot chamber is placed from the outside environment. The vessel develops along a horizontal axis, it has an elliptical design and it is provided with two flat doors (front and rear). Both doors are hinged and can be opened manually. The front door has an automatically sliding entrance for loading-unloading the furnace.

Hot Chamber

The thermal chamber has a rectangular section 71 (H) x 18 (W) x 144 (L) inches (180 x 45x 365 cm), and it is constituted by steel panels with nickel-chrome resistors. There are 23 independent hot zones that make the chamber temperature very well-controlled. The temperature uniformity requested for this vacuum furnace is ± 37°F (± 3°C) from the set temperature. In the following picture, the ± 37°F Temperature Uniformity Survey (TUS) chart is shown.

Figure 1. TUS example at a specific temperature with 12 TLC


Vacuum System

The vacuum system has three pumping groups, two with a rotary piston pump, a roots pump, and an oil diffusion pump. The third pumping group has a mechanical pump, a roots pump, and a cryo-trap in order to condensate humidity and impurities released during the entire process. The ultimate reachable vacuum without the load is 10-6 mbar (range).

Loading Station

loading station

Loading Baskets

To carry out the brazing heat treatment in a correct way, a specific steel shelved fixtures hold the heat exchangers parts all together with the filler material. For each brazing process, a load from 1984 up to 4850lbs (900 up to 2200kg) can be heat treated at the same time. For gaining a semi-automatic heat treatment process, there is a parking station that can be used as a buffer for the heating furnace.

cooling station

Cooling Station

At the end of the brazing heat treatment, the load is automatically transferred into a separate cooling chamber where the brazed parts are cooled down by forced recirculation of air.

Heat Treatment

Before reaching the brazing temperature, the load is maintained at a lower temperature for a period of time to remove the working oil plate from the heat exchangers. During this maintenance time, a variation between high vacuum and partial pressure of N2 is observed.

Figure 2. Typical brazing cycle. Line yellow is the setpoint, line orange is the temperature TC, line blue is the high vacuum level and purple line is the partial pressure in mbar detected.


After the brazing step, the furnace reaches high nitrogen static partial pressure, starting the cooling phase. This step is considered complete when the furnace injects air up to reach the atmospheric pressure as total pressure. At this time, the front door opens automatically, and the loading track extracts the charge from the furnace.

Vacuum Brazing for Automotive Applications Read More »

Distortion Analysis of Landing Gear During Oil Quench: A Case Study

Charlie Li

A thermal process modeling company used its heat treatment simulation software to explore oil quench sensitivities on the distortion of a large landing gear made of 300M, a vacuum melted low alloy steel that includes vanadium and a higher silicon composition.

DANTE Solutions, an engineering consulting and software company specializing in metallurgical process engineering and thermal/stress analyses of metal parts and components, was approached to examine local stagnant oil flow and immersion, among other sensitivities, for this critical aerospace component.

Zhichao (Charlie) Li, Ph.D., vice president of DANTE Solutions, was the lead researcher and author of this study.


Case Study

Problem Statement

Part:

3 modes of distortion that are of concern

  • 2.5 meter tall landing gear
  • 0.25 meter main tube diameter
  • AISI 300M material

Problem:

  • Large distortions after oil quenching in the following distortion modes:
    • Bow in XY-Plane
    • Bow in YZ-Plane
    • Straightness of a Blind Hole
  • All distortion modes shown in the figures make assembly of the entire structure very difficult.
  • Immersion into the oil tank is the main focus of the distortion analysis.

Process Description

  • Part is austenitized in pit furnace at 1607°F (875°C).
  • A 45-second step is included for the removal of the landing gear from the pit furnace.
  • 75-second open-air transfer from pit furnace to oil quench tank. The landing gear is immersed into the oil with a speed of 203.2 mm/sec, with the immersion direction shown in the figure. It takes 11.885 seconds to immerse the entire gear in the oil tank.
  • The landing gear is held in the oil for 5 minutes.
  • Tempering not considered, due to negligible effects on distortion.

Temperature (°C), Austenite (fraction), horizontal displacement (mm), and vertical displacement (mm) at the end of the immersion process; section cut, looking inside the part.

Model Description

  • Model contains 281,265 nodes and 258,272 hex elements.
  • 3 surfaces defined for heat transfer boundary conditions.
  • Oil flow stagnation is expected inside the main tube (Inner Surface) and the blind hole.
  • Different thermal boundary conditions are applied to the outer surface and the inner surface, as shown to the right.
  • The blind hole and the inner surface have the same thermal boundary conditions in the baseline model.
  • During immersion, oil enters the blind hole first and then begins to fill up the main tube.
  • In the baseline model, the oil level rising speed inside the bore is assumed to be 20% of the landing gear immersion speed.


Modeling Approach

  • Define heat transfer coefficients as a function of temperature for the oil tank.
    • Thermocouples placed at various locations on a dummy landing gear, which was
      approximately the same overall dimensions and mass. Improve 300M material data in DANTE material database using dilatometry testing.
  • Improve 300M material data in DANTE material database using dilatometry testing.
  • Perform sensitivity study to determine phenomena critical to distortion modes of interest.
    • Oil flow stagnancy in blind hole during immersion: The more stagnancy, the lower the heat transfer on this surface. Baseline assumed to be the most stagnant. Two faster heat transfer rates examined.
    • Oil flow stagnancy around structural support arm: The more stagnancy, the lower the heat transfer on this surface. Baseline assumed to be least stagnant. Two slower heat transfer rates examined.
    • Oil fill rate of the main tube during immersion into the oil: The slower the oil fills up the main tube, the larger the temperature and phase transformation gradient is in the axial direction of the tube. Baseline assumed the slowest fill rate. Three faster fill rates were examined.
    • Immersion direction: Immersion direction sets up axial temperature/phase transformation gradients and also determines how the main tube is filled. The Baseline immersion direction causes oil to enter through the blind hole first and then into the main tube. Opposite immersion direction is examined, which causes oil to enter the open end of the main tube first.

Blind Hole Quench Rate Sensitivity

Figure 8. Temperature (°C) in the blind hole at the end of immersion for the three cases.

  • Heat transfer is increased in the blind hole during the
    immersion process; all other heat transfer rates
    remain the same as the baseline model during
    immersion.
  • All heat transfer rates are identical to the baseline
    after the part is fully immersed in the oil.
  • Baseline model assumes blind hole heat transfer is
    equivalent to the main tube inner diameter heat
    transfer during and after the immersion process.
  • Rate 2 has a faster heat transfer rate than the baseline.
  • Rate 1 has a faster heat transfer rate than Rate 2.
  • Figure 8 shows a significant difference in temperature between the three cases at the end of the immersion process.
  • Heat transfer rates explored in the blind hole do not contribute
    to the tilting of the blind hole.
  • Figure 9 shows that the angle of the hole is the same, regardless of the quench rate.
  • Modification of the blind hole to increase the heat transfer rate
    in the hole to help improve the straightness of the blind hole is not necessary.
  • Heat transfer rates explored in the blind hole do not contribute significantly to the bow distortion in the XYPlane or the YZ-Plane.
  • Figure 10 shows that the bow distortion is made slightly worse by increasing the heat transfer rate in the blind hole during immersion, but is not significantly worse.
  • Modification of the blind hole to increase the heat transfer rate in the hole to help improve the bow distortion is not necessary.

Figure 9

Figure 10.

Structural Beam Quench Rate Sensitivity

  • Reduced heat transfer of the structural arm is examined.
    • Oil flow stagnancy is assumed to reduce heat transfer rate on arm.
    • 2 slower heat transfer rates compared with baseline.
    • Baseline assumes the same heat transfer rate on the structural arm as on the main tube OD.
  • Figure to the left shows the reduced heat transfer rate surfaces of the structural arm.
  • Rate 1 is slower than Baseline.
  • Rate 2 is slower than Rate 1.
  • Figure below shows the temperature difference in the structural beam at the end of the immersion process.
  • Approximately 212°F (100°C) difference between Baseline and Rate 1
  • Approximately 392°F (200°C) difference between Baseline and Rate 2


  • Bow distortion in xy-plane has a non- Distortion of Blind Hole linear response to oil stagnancy around the structural beam.
  • Rate 1 produced the least amount of bow in xy-plane.
  • Baseline produces the greatest amount of bow in xy-plane.
  • Distortion of blind hole has a non-linear response to oil stagnancy around the structural beam.
  • Rate 1 produced the straightest blind hole.
  • Baseline produces the greatest amount of distortion of the blind hole.
  • Bow distortion in yz-plane has no sensitivity to oil stagnancy around the structural beam.
  • The non-symmetric mass near the top of the landing gear has the most influence on the yz-plane bow distortion.

  • Figure 15 shows lower bainite phase fraction at the end of the quenching process.

    Figure 15
  • Slower heat transfer rate of the structural beam results in significantly different amounts of lower bainite.
    • The slower the heat transfer, the more lower bainite formed.
  • Increased amounts of bainite reduce bow distortion in xy-plane, but the response is non-linear.
    • Rate 2 caused slightly more distortion than Rate 1, but less distortion than the Baseline.
  • Increased amounts of bainite reduce distortion of the blind hole, but the response is non-linear.
    • Rate 2 caused slightly more distortion than Rate 1, but less distortion than the Baseline.

Oil Fill Rate in Main Tube Sensitivity

  • The rate at which the oil fills the main tube is critical to the phase transformation timings and the phases formed.
  • The immersion speed of the landing gear is 203.2 mm/sec.
  • Baseline assumes the inside of the tube fills up at 20% of this value (40.64 mm/sec).
  • Three different fill speeds were explored:
    • 50% (101.6 mm/sec)
    • 100% (203.2 mm/sec)
    • 200% (406.4 mm/sec) Assumes pressure build up forces oil up the inside of the tube.
  • Figure 16 compares temperature inside tube at end of immersion for four cases.

Figure 16


  • The oil fill rate of the main tube during the immersion process has a very significant effect on all three modes of distortion.

From top left clockwise

  • Bow distortion in yz-plane has a non-linear response to the fill speed (Figure 17)
    • 50% produces the worst bow
    • 100% & 200% are very similar, with 200% slightly worse
  • Bow distortion in xy-plane has a non-linear response to the fill speed (Figure 18)
    • 50% produces the least bow
    • 100% produces the worst bow
  • Straightness of the blind hole has a linear response to the fill speed (Figure 19)
    • Slowest fill speed has least distortion
    • Fastest fill speed has the worst distortion

  • Difference in lower bainite was the cause for differences in distortion with respect to oil stagnancy around the structural beam previously shown.
  • Differences in distortion from the oil fill rate of the main tube are not caused by microstructural phase differences.
  • Figure 18 shows that Martensite and Lower Bainite are the same for all fill speeds.
  • Differences in distortion are caused by the transformation timing along the axis of the landing gear.


Immersion Direction Sensitivity

Figure 19

  • Distortion sensitivity to the immersion direction was examined.
  • Figure 19 compares temperature profile at the end of the immersion process for the two immersion directions.
  • The Baseline has oil enter the blind hole first and then fill up the tube at a rate that is 20% of the immersion speed.
    • Oil spills over the top of the tube and the tube is flooded with oil.
  • The reversed immersion has oil enter the tube first and fills at the immersion speed.
  • Figure 20

    Reversing the immersion direction also reverses the axial temperature gradient.

    • Martensite transformation starts at the open tube end when the immersion direction is reversed.
    • Martensite transformation starts by the blind hole first for the Baseline.
    • Reversing the axial phase transformation gradient can have significant effects on bow distortion and axial displacement.
  • Figure 20 shows the vertical displacement around the blind hole for the Baseline and the Reversed Immersion.
  • Reversing the immersion direction had a very minor impact on the straightness of the blind hole.
    • Closed side of blind hole was pulled further down by reversing the immersion direction, but the closed side

      Figure 21

      was not pulled up as much.

  • Figure 21 shows the bow distortion in the XY-Plane for the Baseline and the Reversed Immersion.
  • Reversing the immersion direction has a significant effect on the bow distortion in the XY-Plane, nearly doubling it.
  • Reversing the immersion direction has no effect on the bow distortion in the YZ-Plane.


Conclusions

  • Four process parameters were evaluated for distortion sensitivities for a large landing gear component:
    • Oil stagnancy inside a blind hole, oil stagnancy around a structural support beam, oil fill rate into the main tube as the landing gear is lowered into the oil tank, and immersion direction of the landing gear.
  • Three distortion modes were evaluated:
    • Bow distortion in XY-Plane, bow distortion in YZ-Plane, and straightness of a blind hole.
  • Bow distortion in the XY-Plane IS significantly affected by oil stagnancy around structural support beam, oil fill rate up the main tube, and the immersion direction.
    • Bow distortion in the XY-Plane is mainly controlled by the behavior of the structural support beam.
  • Bow distortion in the XY-Plane IS NOT significantly affected by oil stagnancy in the blind hole.
  • Bow distortion in the YZ-Plane IS significantly affected by oil fill rate of the main tube.
    • Bow distortion in the YZ-Plane is mainly controlled by a fitting near the open end of the tube that contributes to non-symmetric mass around the main tube in that area.
  • Bow distortion in the YZ-Plane IS NOT significantly affected by oil stagnancy in the blind hole, oil stagnancy around the structural support beam, or the immersion direction.
  • Straightness of the blind hole IS significantly affected by oil stagnancy around structural support beam and the oil fill rate up the main tube .
    • Straightness of the blind hole is mainly controlled by the structural support beam behavior.
  • Straightness of the blind hole IS NOT significantly affected by oil stagnancy inside the blind hole or the immersion direction.
  • Modifications to the quenching process were made to improve the distortion response of the landing gear.
    • Modeling results were used to direct the modifications.
    • Customer considered changes proprietary and did not share.
  • Benefit of using heat treatment simulation over physical experiments to perform sensitivity studies was shown.
    • Ability to modify, and see the effects of, just one process parameter with simulation is easy.
    • Ability to modify, and see the effects of, just one process parameter with experiments is very difficult, if not impossible.
    • Cost of simulation is minimal.
    • Cost of physical experiments can be very high.


Text developed from powerpoint version. Click here to view or for more information on DANTE case studies.


Distortion Analysis of Landing Gear During Oil Quench: A Case Study Read More »

Heat Treater Performs Brinell Hardness Testing with Precision for Primes

The largest subcontract heat treater of aluminum alloys in the UK, accredited to process components to Prime specifications, turned to a manufacturer of Brinell hardness testing machines to develop a more efficient testing process.

Foundrax BRINtronic automatic Brinell microscope

Alloy Heat Treatment (AHT), which serves the aerospace, automotive, energy, and other sectors, has a large number of prime customer approvals including Leonardo Helicopters, Airbus, Safran, Boeing, and BAE Systems. They are accredited to heat treat to these Prime’s specifications and often work as a trusted supplier to other companies that deal directly with them. Part of the Prime specifications dictates that Brinell hardness testing is carried out prior to releasing the components. AHT settled on the Foundrax BRINtronic automatic Brinell microscope, designed by Foundrax Engineering Products, based in Wessex, England.

“Part of the release process for aluminum alloys is that we must do conductivity and hardness testing on every job that leaves us,” said Steve Roberts, Quality Director with Alloy Heat Treatment. “As such we were looking at ways that we could gain efficiencies in this process. Using the BRINtronic from Foundrax has allowed us to gain these efficiencies.”

Brinell hardness measurements were required to be taken in areas of components where access is limited by intricate machine webbing or where the nose diameter of the microscope is restricted to approximately 30mm.

Alex Austin, Managing Director, Foundrax

“One of the problems we needed to solve with equipment selection is that the microscope must get into quite intricate places,” continued Roberts. “All the other microscopes we looked at have wide noses on them so, the design of the Foundrax scope was right up our street. We’ve used the manual Foundrax microscopes for as long as I’ve been here.”

“As the microscope automatically measures the indentation at multiple points, results are instant,” said Alex Austin, Managing Director of Foundrax. “They are recorded, and of course, the operator doesn’t have to turn the microscope 90 degrees and remeasure as he would with manual measurement. There is well over a 50% saving on measuring time.”

Foundrax BRINtronic display

“Obviously, the usability of the BRINtronic suited us,” said Roberts, “because we could get it into the places that we would struggle with using the competitor’s equipment. The process of measuring was far easier with the Foundrax BRINtronic as with the others we had to try and hold it with both hands and press buttons. They weren’t particularly well balanced either so in practice we were losing efficiencies rather than gaining them.”


Main photo caption: Steve Roberts of AHT uses the BRINtronic testing machine from Foundrax.

Heat Treater Performs Brinell Hardness Testing with Precision for Primes Read More »