THERMOCOUPLES TECHNICAL CONTENT

Heat Treat Radio #131: Beyond Calibration — Real-World Accuracy in Heat Treat Measurement


What does it really take to achieve accurate temperature measurement in the real heat treat production? In this episode of Heat Treat Radio, host Heather Falcone sits down with Dr. Steve Offley, product marketing manager at PhoenixTM, to explore the science behind thru-process monitoring, thermal barriers, and data logger performance. From cold junction compensation to real-world shop floor challenges, they unpack why lab accuracy doesn’t always translate to production — and what heat treaters can do about it. Tune in to learn how to ensure your temperature data is as reliable as the parts you produce.

Below, you can watch the video, listen to the podcast by clicking on the audio play button, or read an edited transcript.


The following transcript has been edited for your reading enjoyment.

Introduction (00:04)

Heather Falcone: Today we are talking about a feature article coming up in this month’s magazine, Achieving Accurate Measurements in Real Heat Treat Production. Joining me today is author of this piece, Dr. Steve Offley from PhoenixTM, who is also our sponsor for today’s episode.

Steve is a product marketing manager at PhoenixTM with responsibility for both strategic product management and global marketing of the company’s thru-process temperature, optical profiling, and TUS system product range. Steve joined PhoenixTM in April of 2018 after 22 years of experience in the industrial temperature profiling market with another well-known company.

The Role of PhoenixTM (2:35)

Heather Falcone: Tell us about your role at PhoenixTM and the role of PhoenixTM, specifically how they provide solutions for the thermal processors out there.

Steve Offley: I am the product marketing manager or product manager for the range of temperature monitoring systems that we offer to the wider industrial space. We provide support for clients in a range of industries who are faced with the daily challenges of using thermal processing as part of their key manufacturing step. We offer unique solutions for those specific applications, because not every application is the same. Our goal is to allow the customer to monitor the temperature of their specific product in some form of heat treatment process.

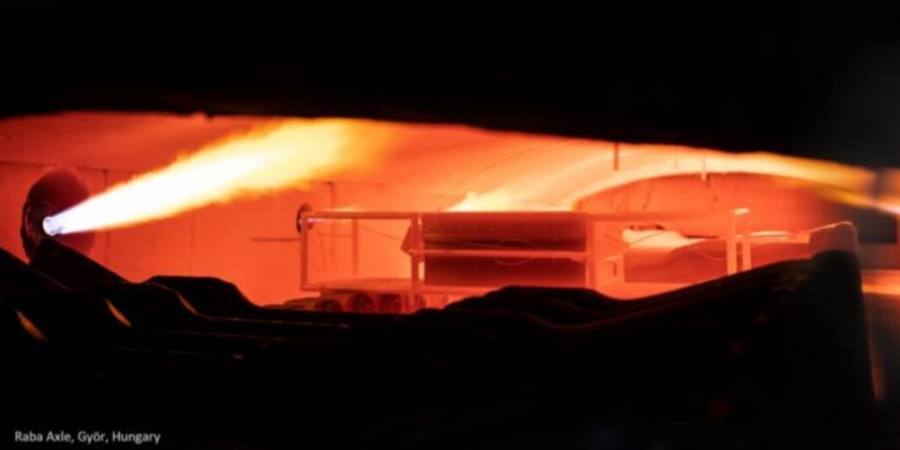
For instance, we could be offering a solution for the coating market, where a client wants to monitor the thermal cure of a car body. They want to ensure that that car body, as it travels through the curing oven, is achieving the correct temperature, not just in the oven itself, but at the product level. So is each part of that car body achieving the right temperature for the right duration to cure the paint?

Another day we might be dealing with a food processor who, as you can imagine, when they’re dealing with food safety and HACCP requirements, they want to prove that the core of their product, which may be a chicken fillet in a deep fat fryer, is achieving the right temperature, to make sure that it’s safe and it’s an attractive product to eat. And of course, they want to be confident that the consumer is going to be healthy after consuming the product too.

In the buildings and ceramics industry, for instance, we can offer the same sort of solution for the manufacturers of bricks, building materials, tiles, etc., where the process may actually be up to three or four days long where they’re drying the products. But it’s still critical to know what the temperature is at the product level.

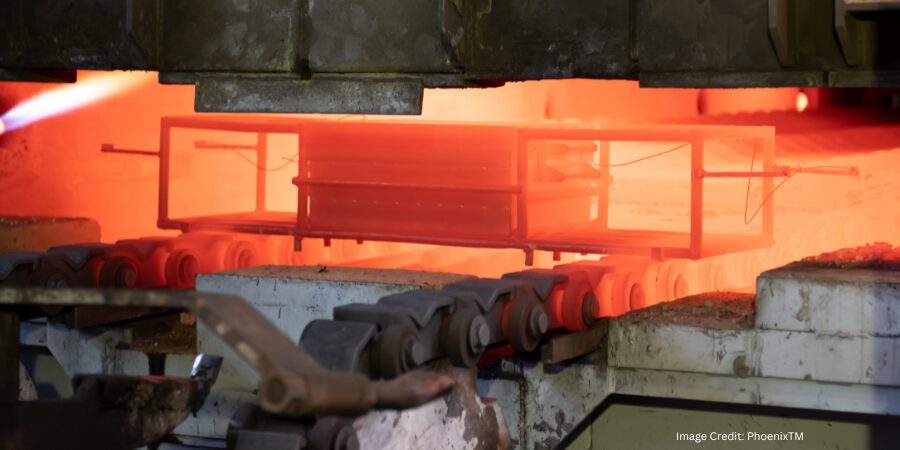
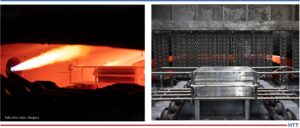
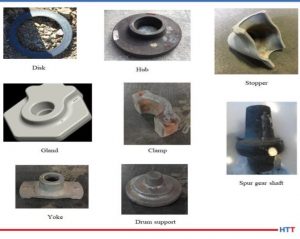
Much of our focus is on heat treatment of metals. We are trying to provide different solutions across the whole gamut of the heat treating industry — from primary production, such as slab heat treatment for steel and for aluminum, proving that the raw material has been processed correctly in the furnace, to the finished product.

We are talking about the formed metal product, making sure that that is achieving the right primary metallurgical properties. It needs to do the function it’s going to be used for, from a temperature profiling perspective and also possibly even a temperature uniformity survey (TUS), which is obviously critical in many of the automotive and aerospace sectors of the market where they’re trying to prove or validate the furnace performance.

What is Thru-Process Monitoring? (6:08)

Heather Falcone: Can you explain what thru-process is and how it influences the monitoring technology that you’re talking about?

Click the image above for an introduction to the thru-process concept and data logger basics.

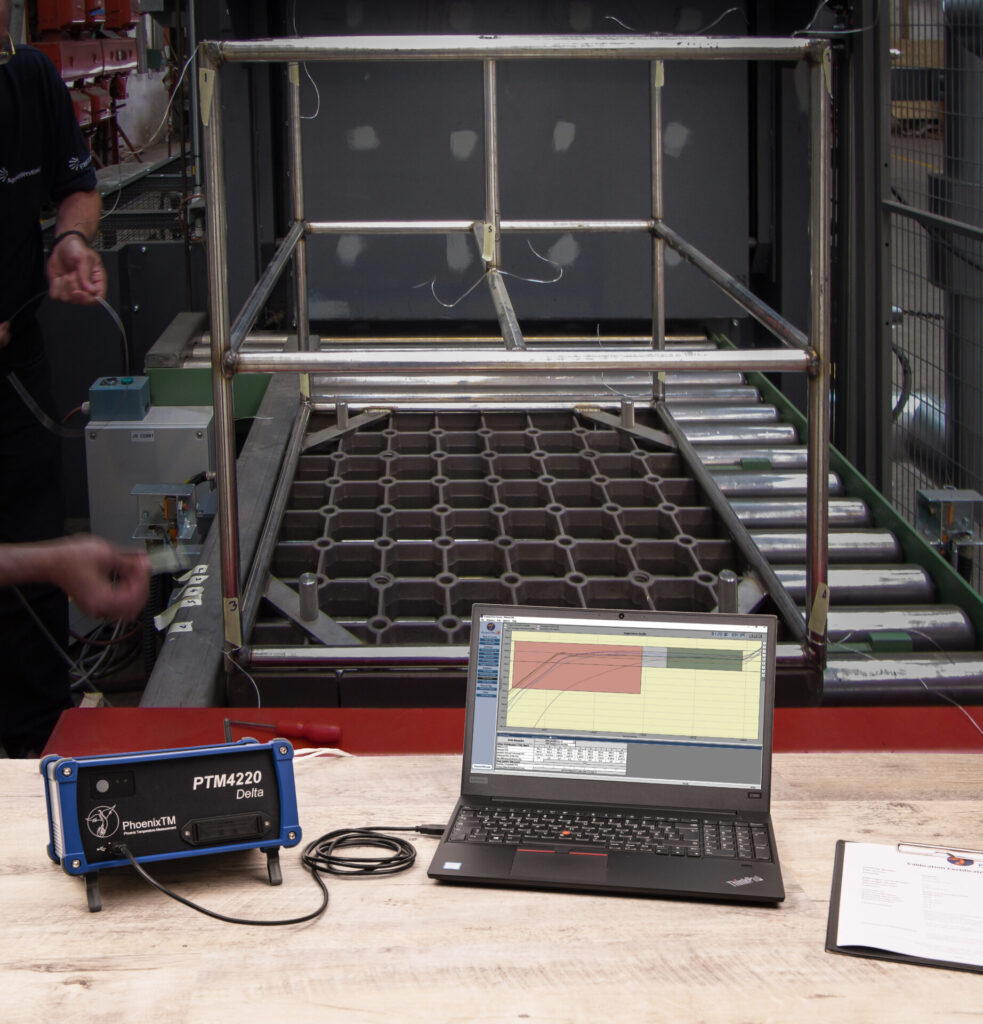
Steve Offley: “Thru-processes” is the term that is key to the type of solution we are trying to provide. When we’re talking about heat treatment, there are still many applications where the product may be heat treated in a static box furnace, in which case the traditional technology of using trained thermocouples is probably as easy as any other, whereby you have your field test instrument external to the furnace chamber. The thermocouples are then moved into — or traced into — the furnace, attached either to the product or, if you’re doing a thermal uniformity survey, to a test frame to locate the thermocouples at the desired coordinates within the working zone of the furnace. Then you are collecting the data externally.

I believe it was two episodes ago that you had Dennis from ECM talking about modular heat treatment. He was talking about the challenges of or the increased level of technology associated with moving batches of products around the heat treating cycle in a modular approach.

When you have that type of setup, and even in situations where you may be heat treating in a continuous furnace, the use of a trailing thermocouple becomes difficult at best, impractical and problematic in terms of safety at worst. For the modular approach, you have thermocouples going into different chambers and moving around. There are seals and automated doors in which the thermocouples will be trapped. As such, it’s very difficult to actually monitor the whole sequence of events that may be occurring in the heat treatment sequence.

Traditional vs. Thru-Process Monitoring

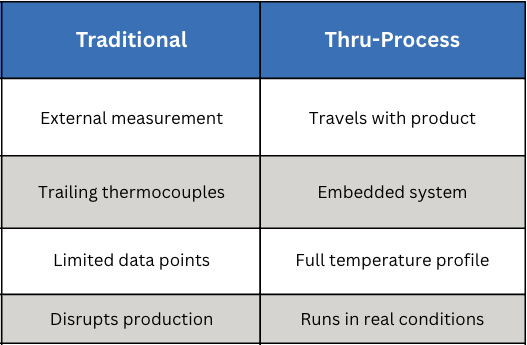
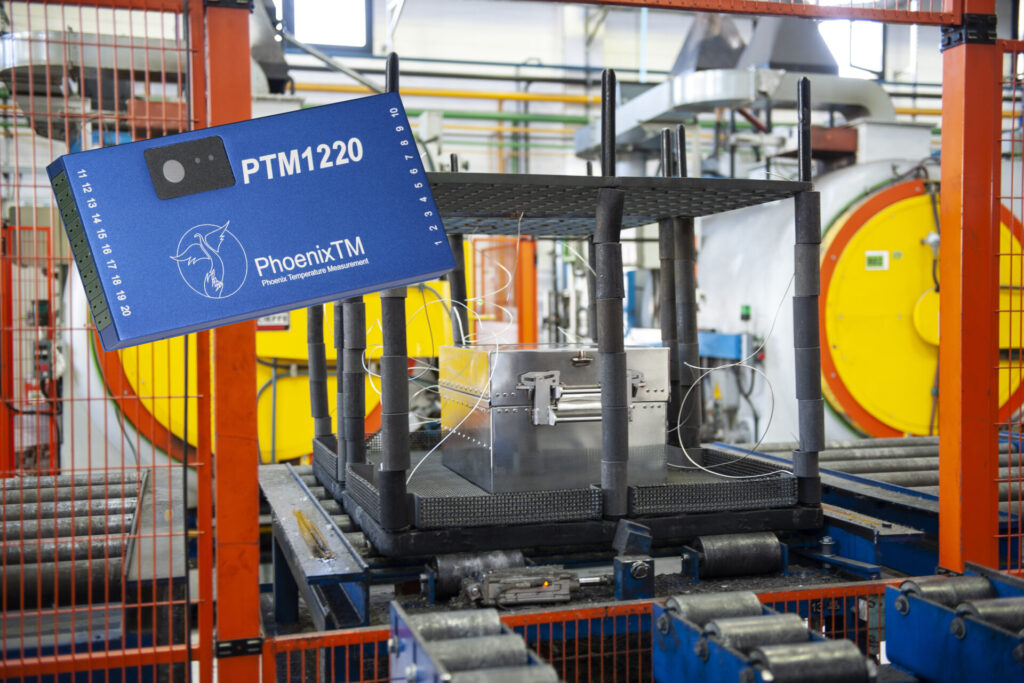
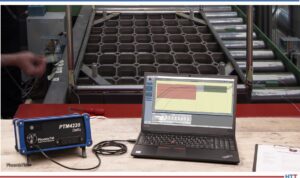
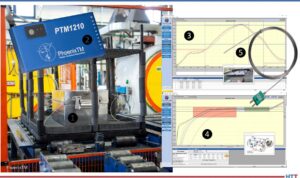
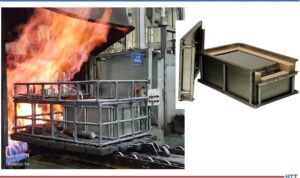
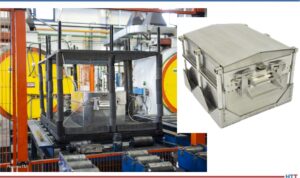
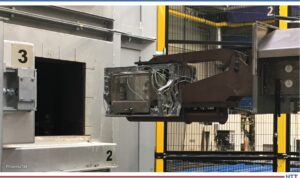
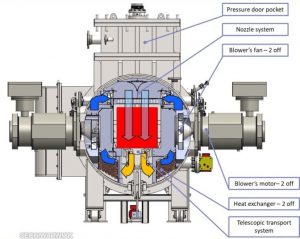
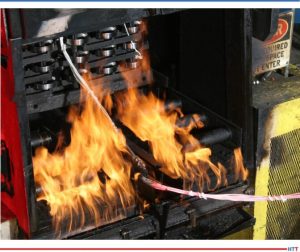
This brings us back to the thru-process methodology. At Phoenix, we offer a system that is designed to travel as if it was part of the product basket through the process. The field test instrument, the data logger, has to travel with the product through the furnace.

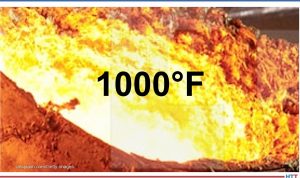
A data logger in its own right is not capable of going through a furnace if you are measuring at 800°F to 1000°F. One of the key aspects of our system solution is what we refer to as the thermal barrier. It is an enclosure that is used to protect the data logger to allow it to travel through the process. Essentially you encase the data logger inside the barrier and then place it on the conveyor or in the product basket with short thermocouples that are then rooted to the product or to the test frame that’s being moved with the whole monitoring system through the process.

The Importance of Thermal Barrier Design (9:38)

Heather Falcone: The thermal barrier design is really important then, because you’re going to see a variety of environments. How do you protect the data logger?

Steve Offley: That’s the crux of the technology that we’re trying to provide, in so much that there are many different forms of heat treatment or many different forms of thermal processing where we’re trying to provide the protection we need.

You may have, for instance, a low pressure carburizing process where you’re putting the system into a vacuum furnace, and then you may have a high pressure quench at the end. You have to protect the logger and not just from the temperature criteria inside the furnace, but certain things like pressure changes, which can distort the equipment. That is one design barrier, which would give additional protection to prevent any distortion or compressional damage to the barrier.

Click on the image above to find a real-world companion to Dr. Offley’s barrier design examples, covering oil and water quench protection in practice.

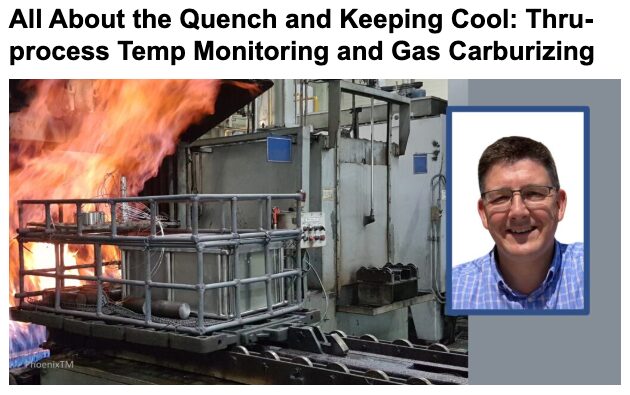
There may be some circumstances, like with a T6 aluminum process, where you have sent the system through the furnace, you then got a water quench, and now in the thru-process principle, the equipment has to go through all aspects of the process. You therefore have to have a design in which the system can tolerate both the heating process, but also the rapid cooling going into the water.

You may also have a situation where you have an Endothermic carburizing furnace with an integrated oil quench. The same approach applies. You are going from a hot environment and then rapid cooling. You are not only protecting the logger from the damage of the heat, but also the materials, like the oil or water in the water sequential and oil quench scenario, so as to not damage the fairly sophisticated electronics of the data log.

There is a lot of science and technology involved in designing unique solutions to meet the specific requirements of the applications. In most cases, we are working with the client from their working spec to develop unique solutions that will meet their unique requirements.

Protection and Accuracy (13:36)

Heather Falcone: When we’re talking about actually monitoring the surveys, what special measures are you required to design the data loggers with that provide accuracy?  

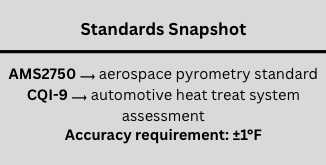
Steve Offley: By the very nature that we are sending the data logger through the furnace, we have to be careful that we are not only protecting the data logger from physical damage, which is possible if we do not get the thermal barrier design correct. But we also want, at the end of the day, to guarantee that we are achieving the accurate data that we need to make sense of the profile information that we are getting. Because at the end of the process, you either have the thermal fingerprint of your process or if you’re doing temperature uniformity survey, you have the readability of the data at the respective test levels. According to the standard CQI-9 and AMS2750, the accuracy of the reading or the field test instrument has to be within ±1°F.

The purpose of the barrier is to not only protect the data logger from damage, but keep the data logger at a working temperature that allows the accuracy of the reading that conforms to the standards that you are working to.

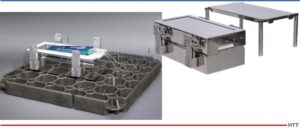
There are different designs of thermal barriers that we can offer. The basic design is what we refer to as the microporous insulation technology. This is basically a dry barrier whereby the insulation slows down the penetration of the heat to the core of the barrier where the data logger is. But at the center of that barrier, there will be a device that we refer to as a heat sink. There’s a eutectic salt inside the heat sink, which will transfer its physical state from a solid to a liquid at a nominal temperature. It’s 58°C where the transfer occurs and that will maintain the temperature at that working temperature.

For longer processes, you may want to use a thermal barrier that uses what we call a phased evaporation protection methodology. In simple terms, it involves the use of water, which is able to absorb very large amounts of energy and heat, and obviously will boil at 212°F (100°C). While it’s maintaining that boiling state, it will maintain the temperature of the thermal barrier and the data logger inside it. So we can actually offer a high temperature data logger that is capable of operating safely at 212°F for long periods time and still be protected.

Thermocouple Use (17:00)

Steve Offley: As long as the barrier provides us with that thermal protection and the logger is working within its operating range, we are fairly safe. That being said, we have to be a little bit careful when we consider the technology of the thermocouple, because there’s some fairly serious restrictions on thermocouple use, which many people may or may not be aware of.

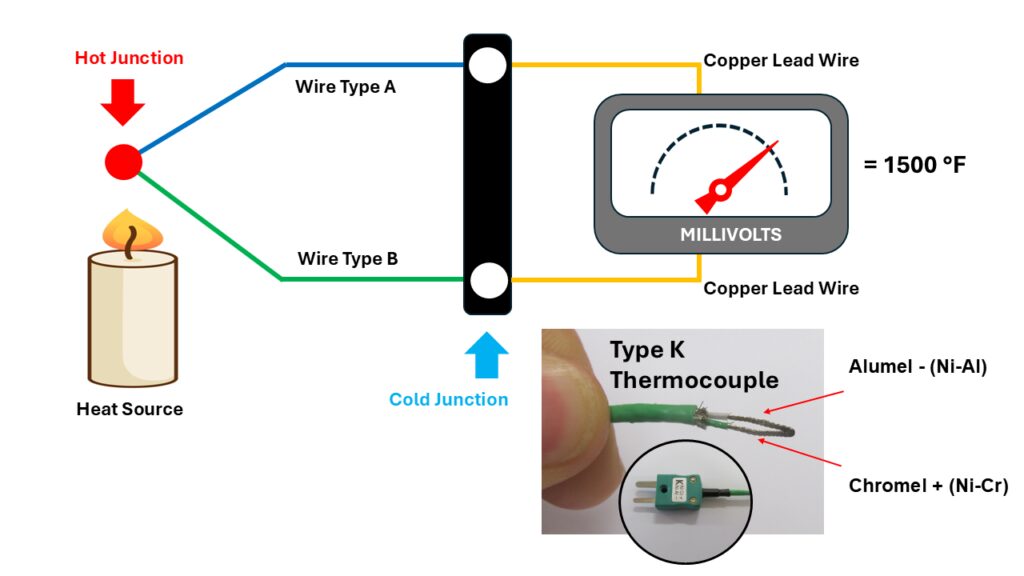
Many people know that the thermocouple technology was developed by Dr. Seebeck back in about 1821. He was a German physicist who discovered the fact that if you had two dissimilar metals connected at a junction or a point, at a particular temperature, those two dissimilar metals would create a millivolt reading, and that millivolt reading would be proportional to the actual temperature that those two dissimilar metals were experiencing. Hence the theory of the thermocouple.

Dr. Steve Offley showing the aluminal and the chromal leg of a type K thermocouple.

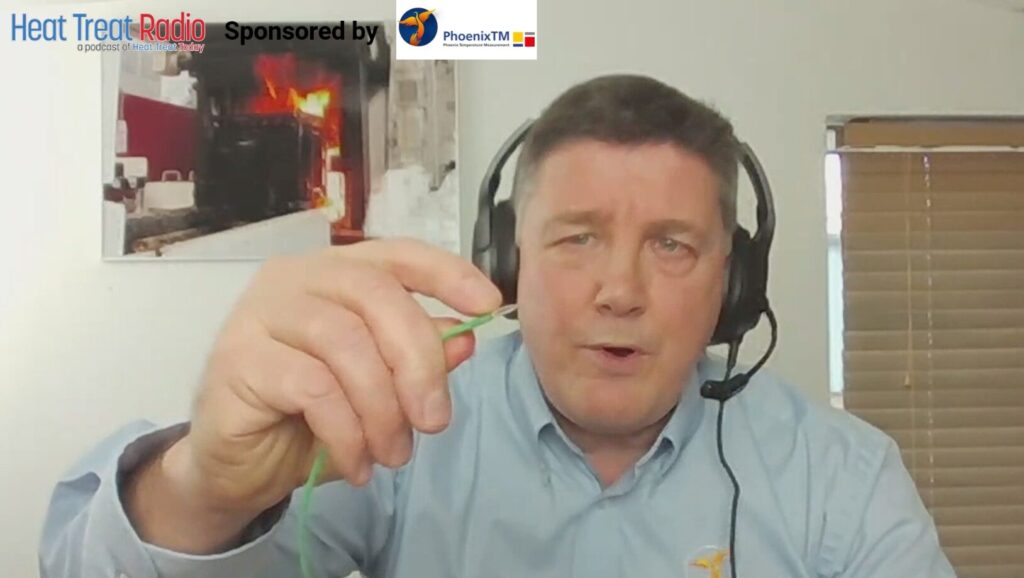
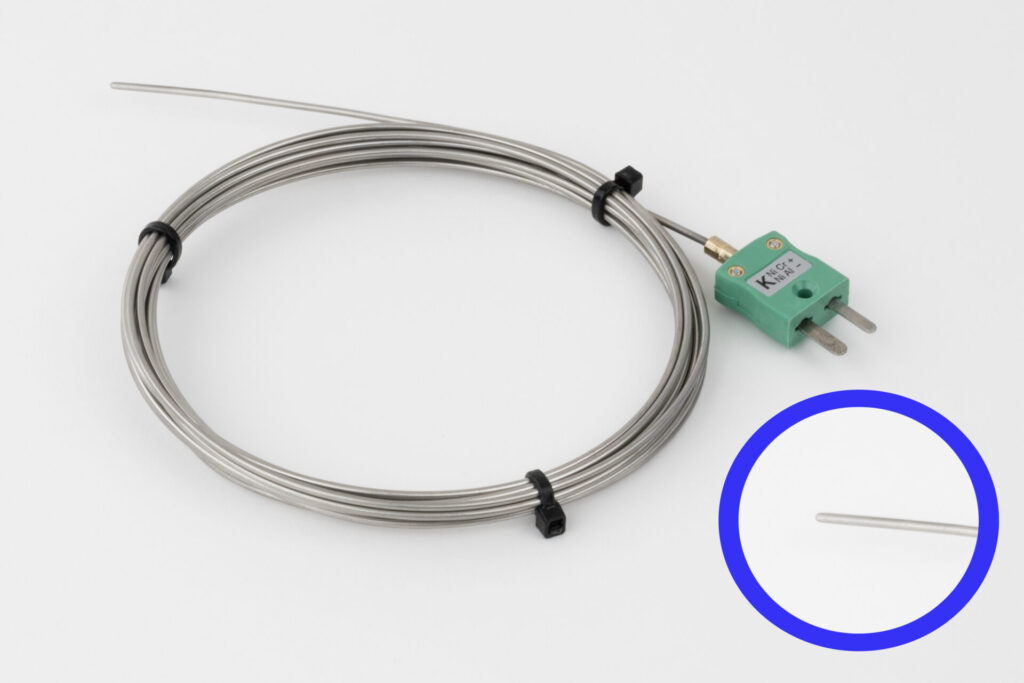
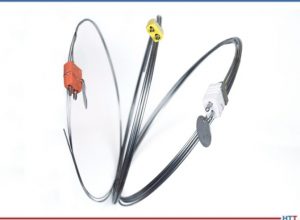
Most people are fully aware of what a thermocouple looks like, but it’s important to note that this is a type of thermocouple we’d use for a coating application. It has a PFA-insulated sleeving on it. You would not use this in many heat treatment applications, but what I want to do is to show you that in the core of the thermocouple, there are two wires, two dissimilar metals. This is a type K thermocouple. We have the aluminal and the chromal leg of the thermocouples. These are the unique materials that are used to generate the millivolt reading.

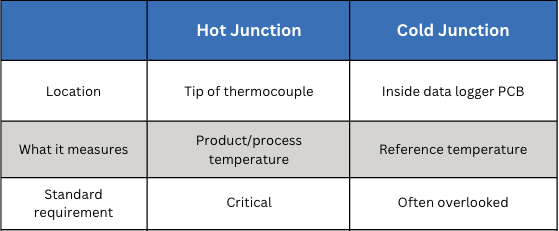
The way the thermocouple works then is that that millivolt can be cross-referenced to a calibration table or a voltage table to determine the temperature reading that the sensor. This is what we refer to as the hot junction, the very tip of the thermocouple. It’s critical that that point is where you want the measurement to be made.

What is often missed is the fact that with a thermocouple, although the hot junction is critical, there is another junction that is even possibly more critical and sometimes overlooked — the cold junction. The thermocouple does not actually record an absolute reading, it’s a ratio between the hot junction and the cold junction. The cold junction of a thermocouple is where the actual thermocouple materials, the two dissimilar metals, join what we refer to as the copper connection. This tends to be where, in the data logger or the field test instrument, the electronics make the physical measurement or process the actual reading from the thermocouple.

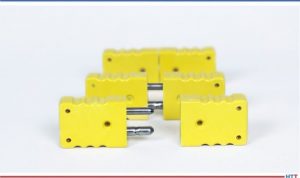
If you have a fixed data logger like we have at Phoenix, whereby you would designate the type of thermocouple you were plugging into the data logger — this is a data logger with 20 channels and it’s a type K — I would plug my thermocouple simply into that connector. The cold junction is not in this case at the point where I’m making the connection on the data logger. It is actually inside the logger because there is another wire that goes from the socket to the PCB board where the measurement is actually taken.

Inside the data logger, there is a connector block where the thermocouple wires from the thermocouple sockets will all join the PCB board where the measurement is taken. That’s the location where the cold junction measurement is taken. So, we have our hot junction at the end of the thermocouple, and we have our cold junction inside the data logger.

A side-by-side comparison of the two critical measurement points in any thermocouple circuit: hot junction vs. cold junction.

For some data loggers, that connector or that coal junction may actually be on the outside of the data logger, if it’s a universal connector. So it’s important that you understand where that cold junction is in-situ within your technology. The importance of the reading is the fact that you have a ratio between the hot junction where you are measuring the product and the cold junction where that physical measurement is being referenced inside the data logger.

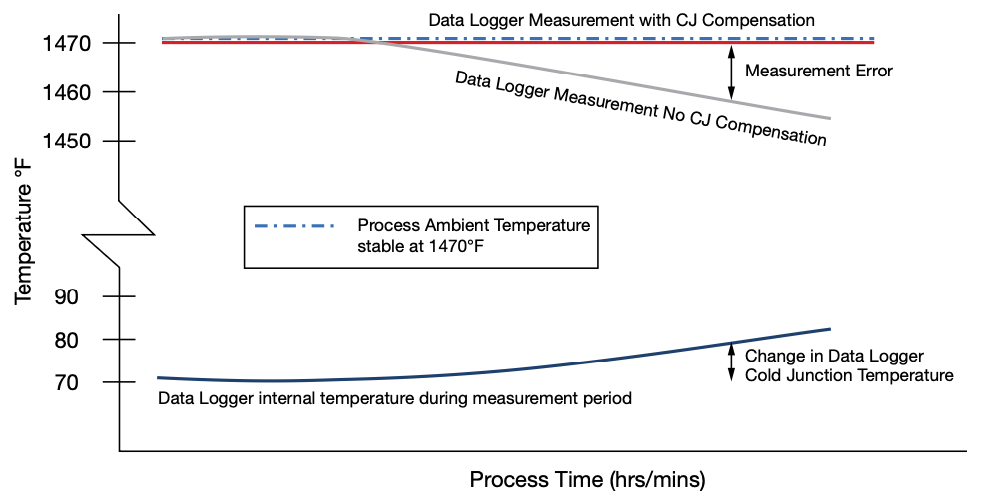
You can imagine, therefore, if the data logger temperature changes, that change in data logger temperature can actually affect the reading you are taking inside your process. That is why it is important to either understand that and make changes so it’s prevented or do what we refer to as cold junction compensation.

Cold Junction Compensation (22:35)

Steve Offley: Inside the data logger, if you are going to compensate for that temperature difference, the data logger is protected up to a physical temperature. But the temperature is going to change. So that cold junction is going to change as it travels through the processing in the way that we do our measurements for thru-process monitoring. The logger will rise in temperature. Therefore, we have to compensate for that.

In the center of the data logger where the connection is made with the copper from the thermocouple cable to the copper-copper connection, we have a temperature sensor, a thermistor, which is accurate to 0.18°F. It measures the actual cold junction temperature of the logger, and it will then compensate automatically for that. Therefore, you can guarantee that even when your data logger temperature changes temperature, it’s compensating for that. There will be no drift in the measurement temperature that you are measuring at the hot junction at the product level.

Data logger temperature change over process time, with and without cold junction compensation, measuring a stable process temperature of 1470°F | Image Credit: PhoenixTM, taken from Achieving Accurate Measurements in Real Heat Treat Production in the March print edition of Heat Treat Today.

Heather Falcone: That was the first time that I had read about the cold junction compensation and why it’s so critical, especially when we’re doing TUS activities.

Steve Offley: With TUS, the accuracy of both the data or the field testing instrument, or the data logger and the thermocouple, are critical to the quality of the test data that you are collecting and obviously trying to comply with the very stringent requirements of the AMS and the CQI-9 standards.

In our case, where we are going through the furnace, we have a worst-case scenario because the data logger is naturally going to change in temperature. But even if we take the scenario to the shop floor, and we are doing an external temperature uniformity survey, the data logger that is sitting outside the furnace, cold junction compensation is still critical for that because within a working day, the floor temperature is generally going to be changing.

Events on the shop floor, like opening the furnace activity on the shop floor, are going to change that temperature. I’ve been in many plants where seasonal changes can make a significant difference to the temperature into which you are taking the temperature. It won’t be the first time I’m sure that people have taken equipment out a car after having traveled for many miles in the early hours of the morning only to realize that the data logger temperature may not be at room temperature. You have to be very careful that you have a stable piece of equipment and that the cold junction is working correctly.

It’s important to read the user manual because there’s often a very critical step to make sure that you are either calibrating the equipment in a real-life environment where the temperature change may be, or ensuring sure that your system has got cold junction compensation. Otherwise, what you believe is a true measurement and accurate, may be the calibration laboratory accuracy where the temperature is controlled very, very strictly. In a real life situation, you may not be seeing exactly the same results.

Heather Falcone: It is really important to consider because there are specific accuracy considerations for AMS2750 and CQI-9.

Steve Offley: I often make an analogy to racing. The Formula One racing cars are tuned up to perform highly on a racetrack environment. They can do 200 miles an hour, having been finely tuned, and they work well. If you take that same racing car off the road into the countryside, it is not going to be working quite as effectively.

The same can be said for data logger technology. A data logger that works well in a calibration laboratory and under fairly safe conditions may or may not be working as effectively on the shop floor, particularly when you consider the variation and the challenges that that environment will bring to a measuring system like this.

Linear Interpolation Correction Factor Method (27:22)

Heather Falcone: Can you explain how you use the linear interpolation correction factor method, because that’s one of the only that is allowed by AMS2750, and why it is beneficial to your data quality?

Steve Offley: We discussed the nominal requirements for the data log accuracy for its measurement, but for AMS2750, logger correction factors and also thermocouple correction factors can be applied to the test data that you are collecting with your monitoring system.

Firstly, for the data logger, we can create a data logger correction factor file, which basically shows the correction factors that need to be applied to each of the separate channels of the data logger for the data that you are collecting. Inside the data logger, we store the calibration information that was gleaned in the calibration laboratory. That can then generate an automatic calibration template, which can be automatically applied to each one of the channels on the data logger automatically as part of the test routine.

The last thing we want to do is to make some error by transferring raw data manually from a spreadsheet into a piece of software. So, the nice thing about that is that it’s automatically applying the pre-programmed offsets from the calibration routine in the laboratory itself.

Secondly, with the thermocouple, we can take a calibrated thermocouple where there will be a nominal reading at two ends of the thermocouple, and you then get the average correction factor. In some circumstances, people will apply a thermocouple correction factor of one nominal temperature below the test level that they are applying. At Phoenix, we calibrate the thermocouples across the complete temperature range of the data logger. Then, we apply what we call the linear interpretation method. What that means is that between each calibration point, we can calculate, using a linear regression line, the true correction factor at any temperature over the measurement range of the device itself.

The linear interpolation schematic showing thermocouple correction factors across the full calibration range | Image credit: PhoenixTM, taken from Achieving Accurate Measurements in Real Heat Treat Production in the March print edition of Heat Treat Today.

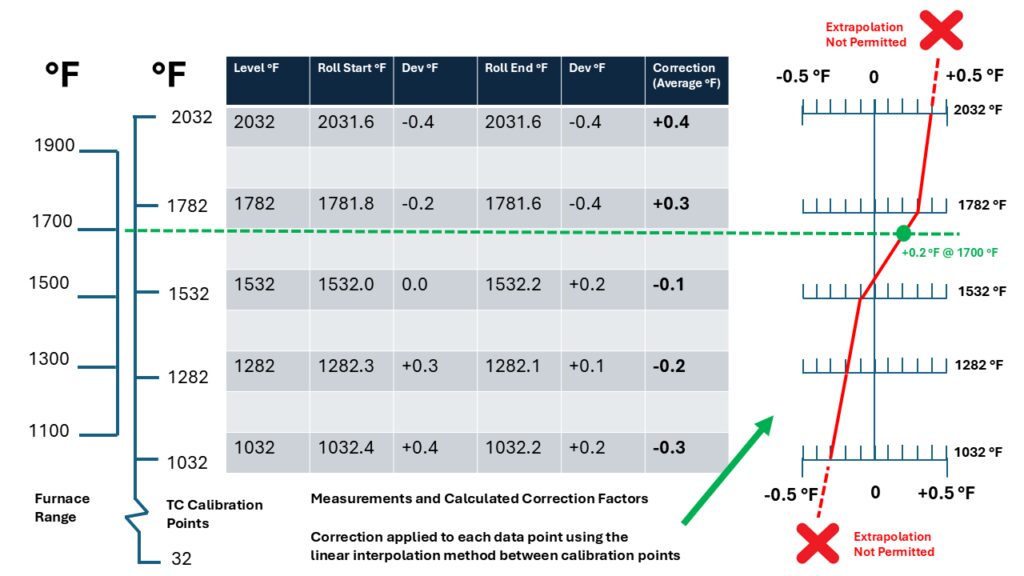
It cannot go beyond the bounds of the upper and lower limit, as extrapolation is not allowed as it says in the standard. But within the upper and lower bounds, we can interpolate linearly between each data point. There is a tight 140° between each point that we can then ensure that we are correcting for or playing the correct correction factor at each temperature from start to finish, not a nominal value over the whole range. In our view, that gives a far more accurate interpretation of the corrected data over the complete working range of the system as opposed to a single nominal value.

Final Thoughts (31:09)

Heather Falcone: We have talked about a variety of topics: thru-processing monitoring, thermal protection at the data logger, the benefits of making sure that you apply cold junction correction, and the specific accuracy considerations that we have to make sure we bundle in all together. What is the big takeaway you want to leave us with?

Steve Offley: Be careful you do not assume that the condition of operation in the calibration of laboratory is going to be reproduced on the shop floor because the conditions are very different. This comes back to the argument for the importance of cold junction compensation. If you are using technology or a data logger, check with the manual for what cold junction compensation should be applied and if there are any steps you need to make to ensure that that is applied correctly on the shop floor. If you do not, there is a high risk that what you think is accurate data may or may not be if you have a situation where your data logger temperature is varying with time, either in process or even on the shop floor with changing environmental conditions.

Heather Falcone: In the end, we want to make sure that we’re making good parts, and this sounds like a great system to make sure that you’re getting as accurate as possible.

Steve Offley: Quality data at the end of the day is essential for you to understand what your process is doing. It’s no good relying on data you cannot trust. Take that extra time to investigate and put steps in place to make sure that you are measuring what you think you are measuring at the hot junction and that the cold junction is being considered as part of that measurement process.​


About the Guest

Dr. Steve Offley
Product Marketing Manager
PhoenixTM Ltd.

Dr. Steve Offley, aka “Dr.O” is a product marketing manager with PhoenixTM Ltd. with 30 years of experience of temperature monitoring in the industrial thermal processing market.

For more information: Contact Steve Offley at steve.offley@phoenixtm.com.

Heat Treat Radio #131: Beyond Calibration — Real-World Accuracy in Heat Treat Measurement Read More »

Achieving Accurate Measurements in Real Heat Treat Production

Following tight standards might not mean your heat treat process is truly accurate…if your instrumentation does not see the full picture. In this Technical Tuesday installment, Dr. Steve Offley, product marketing manager with PhoenixTM Ltd., discusses how combining accurate data loggers, high-quality thermocouples, and linear interpolation of correction factors ensures consistent compliance with AMS2750H and delivers trustworthy survey results. The article further explores how thermocouple behavior and real-world processing conditions necessitate careful attention to each thermocouple junction.

This informative piece was first released in Heat Treat Today’s March 2026 Annual Aerospace Heat Treating print edition.


Introduction

In the world of heat treatment, temperature measurement accuracy is critical, whether performing process monitoring or temperature uniformity surveys (TUS) as part of AMS2750. Measurement accuracy is defined as the degree to which the result of a measurement, calculation, or specification conforms to the correct value or standard. Without confidence in the accuracy of your measurement, you are working in the dark and could be deceiving yourself and possibly others.

The requirement of ±0.1°F readability first referenced in the F revision of AMS2750 pyrometry standard has garnered much debate and critical discussions throughout the years. Although helpful in resolving confusion in what option to record and removing discrepancies in recording temperatures in metric versus Imperial units, this solution does not necessarily guarantee instrumentation accuracy working in a real-world heat treat operation settings.

The following article introduces important considerations to be made when performing the temperature monitoring operation with reference to measurement accuracy in a real-world test environment — on a shop floor, not just a stable controlled calibration laboratory.

Monitoring & TUS Methodology

Traditionally, TUS are performed using a field test instrument, which in most situations will be a temperature data logger. For static batch ovens, a static data logger is positioned externally to the furnace. Long thermocouples are trailed into the furnace heating chamber connected directly to the TUS frame.

Figure 1. Typical TUS setup for a static batch furnace. Twenty channel external data loggers connected directly to a nine-point TUS frame used to measure the temperature uniformity over the volumetric working volume of the furnace. | Image Credit: PhoenixTM
Figure 2. Thru-process TUS monitoring system. The data logger shown is located inside the thermal barrier, which travels with the TUS frame through the furnace. | Image Credit: PhoenixTM

For continuous or semi-continuous modular processes, this trailing thermocouple method is difficult if not impossible. For these furnaces, the preferred method of temperature monitoring is “thru-process”: the data logger is connected to a TUS frame, traveling with the load through the furnace. To protect the data logger from the hostile process conditions (including heat, pressure, steam, water, salt, or oil) the data logger is encased in a thermal barrier designed for the process in hand (Figure 2).

Calibration Accuracy Requirements

In either static or continuous processing conditions, the accuracy of the temperature monitoring system is dependent upon the combined accuracy of the field test instrument (data logger) and the temperature sensor thermocouples.

Both aspects of the monitoring system must be strictly controlled for AMS2750H compliance. The field test instrument data logger needs to have a calibration accuracy of ±1.0°F or ±0.1% of temperature reading, whichever is greater (Table 7 in AMS2750H), and a readability of ±0.1°F. The most common base metal thermocouples (K and N) used will themselves need to have a calibration accuracy of ±2.0°F or ±0.4% (percent of reading or correction factor °F, whichever is greater) as defined in Table 1 of the AMS2750H specification.

Field Measurement Accuracy

For process monitoring, thermocouples are generally the preferred temperature sensor when considering accuracy, robust operation, cost, and availability. It is important to fully understand the working limitations of the sensor technology from measurement accuracy attainable on the heat treat shop floor to ensure they are compensated for.

The theory of the thermocouple is traced back to a German Physicist, Thomas Seebeck in 1821. The “Seebeck effect” describes the generation of electrical voltage when a temperature difference exists between two dissimilar electrical conductors (metals). The resulting milivoltage (mV) is defined by actual temperature experienced at the measurement junction. For any given thermocouple, the measured mV can be converted to a temperature using standardized Seebeck voltage curves, commonly documented in thermocouple reference tables.

Figure 3. Basic thermocouple measurement circuit showing critical hot and cold junctions. Image Credit: PhoenixTM

Using the Seebeck principle, the thermocouple consists of two wires of dissimilar metals joined at the measurement point, known as the hot junction. The output voltage from the sensor is proportional to the temperature difference between the hot junction and the point of voltage measurement, known as the cold junction. It is important to recognize that a thermocouple measures temperature difference, not an absolute temperature. The basic principle of how a thermocouple measurement circuit operates is shown in Figure 3.

Critical Cold Junction Measurement

A common misconception is that thermocouple accuracy only needs to be accounted for at the hot junction. As previously mentioned, the thermocouple measurement is reliant on the temperature reading at the hot junction offset against the temperature of the cold junction. From an electronics level, the cold junction is where the thermocouple wires connect to the copper/copper connection on the electronic circuit. The cold junction therefore may be inside the data logger or on the outside of the data logger, if universal thermocouple connectors are used (Cu sockets).

Therefore, to get a consistent accurate reading from the hot junction, it is important to consistently and accurately monitor the cold junction temperature so the measurement can be corrected using a method known as “cold junction compensation.” It is critical that the cold junction temperature sensor is located correctly to ensure that the true cold junction temperature is measured and applied.

Essential Accuracy in Real World

While the accuracy of many data loggers may appear to be acceptable on paper, this may not reflect the real world situation. Data logger temperature may not be stable, which can compromise temperature accuracy when proper cold junction compensation is not implemented. The calibration accuracy in a stable temperature-controlled laboratory, or while performing an in-situ calibration, is one thing, but is the field test instrument able to work accurately on the production floor with significant swings in temperature over the survey period? Do you know what temperature changes the data logger may be experiencing on your process floor (e.g., climatic variation during day/furnace heat up, loading and unloading actions)?

Remember, only a few degree change in the cold junction temperature may compromise the measurement accuracy enough to fail the TUS level being tested, if no compensation is undertaken or if the compensation temperature used does not accurately reflect the live cold junction temperature.

Cold Junction Compensation Logger Data

Data loggers designed with an essential accurate cold junction compensation technology, like those created by PhoenixTM, maintain measurement accuracy in every changing industrial environments. This design allows the data logger accuracy to be quoted at ±0.5°F (K and N) over the full operating temperature range of the PhoenixTM data logger family. For standard data loggers used in conventional thermal barriers (phase change heat sink), the accuracy is maintained over the operating range of 32°F to 176°F. For high temperature data loggers used in phased evaporation thermal barriers (water tank protection), the accuracy is provided over the operating range of 32°F to 230°F. As designed, the data logger will operate at 212°F (boiling water), so cold junction compensation is critical with the data logger ambient temperature changing from 70°F to 212°F during normal operation.

Take for example an external data logger with cold compensation technology with an operating temperature range of 32°F to 131°F (see PTM4220 in Figure 1). On a production floor, users can safely operate, relying on the cold junction compensation to address temperature fluctuations in the processing environment.

Figure 4. Effect of changing physical data logger temperature on the thermocouple measurement with and without cold junction compensation measure a stable process temperature of 1470°F. Image Credit: PhoenixTM

Additionally, the thermocouple socket in the data logger case is connected directly to the measurement board of the data logger using thermocouple wire of the designated type (e.g., type K). A thermistor temperature sensor accurately monitors the connector temperature (±0.18°F) providing an accurate record of the cold junction. The connector is located inside the data logger cavity, protected from rapid environmental temperature changes, and is compact and isothermal. As such, the thermistor temperature accurately reflects the cold junction of each unique thermocouple connection. This temperature provides an accurate cold junction temperature compensation to maintain measurement accuracy with any internal data logger temperature variation (Figure 4).

Thermocouple Accuracy

Figure 5. Nonexpendable mineral insulated thermocouple type K (0.06 inch) or N (0.08 inch). UHT alloy sheathed insulated hot junction, terminating in miniature plug. Maximum temperature 2192°F ANSI MC96.1 Special Limits (±2.0 °F or ± 0.4%, whichever is highest). Image Credit: PhoenixTM

To maximize measurement accuracy, it is important that thermocouples are selected with the highest accuracy and manufactured to resist damage from thermal cycling at elevated temperatures.

For thru-process monitoring, short thermocouple lengths are required to connect the data logger within the thermal barrier and the TUS frame. As such, nonexpendable (see AMS2750H 2.2.36, Table 3) thermocouples can be employed with ease. Robust mineral insulated thermocouples (MIMS) (Figure 5), typically type K or N, can be permanently fixed to the TUS frame. This both reduces setup time and guarantees that thermocouple positions are consistent for periodic TUS work as defined (see AMS2750H 3.1.7, Table 5).

Barring physical damage, the mineral insulated thermocouples can be used unrestricted for up to three months (type K) and three months or longer (type N) if recalibration is successful at the three-month check.

Data Logger and Thermocouple Correction Factors

The PhoenixTM system allows both data logger and thermocouple correction factors to be applied automatically to the raw survey temperature data, maximizing measurement accuracy. The data logger correction factors can be read directly from the onboard digital data logger calibration file. Thermocouples are available with comprehensive calibration certificates providing corrections factors at multiple set temperatures across the required measurement range.

Figure 6. Schematic of the linear interpolation method (AMS2750 accepted) of calculating thermocouple correction factors over the entire calibration range of the thermocouple. Every TUS measurement in therefore corrected accurately against matching calibration offset data. Image Credit: PhoenixTM

For both data logger and thermocouples, correction factors are interpolated across the complete calibration range using the linear method as permitted by AMS2750H 3.1.4.8 (Figure 6). This approach means that the accuracy of the entire TUS dataset is guaranteed compared to applying a single correction factor calculated at a single nominated temperature, which may not truly reflect the complete temperature range.

Summary

To guarantee the accuracy of both temperature profile and TUS data, it is important that the field test instrument data logger not only provides the desired calibration accuracy but is able to work accurately in a production environment. For thermocouple systems, accurate cold junction compensation offers critical peace of mind to correct for changes in the operating temperature characteristics of the data logger during use.

Data logger and thermocouple correction factors should be implemented to maximize measurement accuracy. As discussed, the use of linear interpolation method ensures that correction factors calculated over the entire measurement range are implemented providing full data accuracy.

About The Author:

Dr. Steve Offley
Product Marketing Manager
PhoenixTM Ltd.

Dr. Steve Offley, “aka Dr O” is a product marketing manager with PhoenixTM Ltd. with 30 years of experience of temperature monitoring in the industrial thermal processing market.

For more information: Contact Steve Offley at steve.offley@phoenixtm.com.

Achieving Accurate Measurements in Real Heat Treat Production Read More »

Tech Round Up: Helpful, Readable, and Applicable Content

On just about any given Tuesday, Heat Treat Today features an article that aims to educate our heat treating readers — be it in a process, equipment, metals, analysis, critical parts, or more. On this Thursday, enjoy this sampling of Technical Tuesday articles from the past several months. 


Case Study: Heat Treat Equipment Meets the Future Industry Today 

How has one heat treat furnace supplier contended with modern challenges of manufacturing? In this case study about a shift away from traditional forms of heat treat, explore how vacuum furnace technology has more technological horizons to bound. 

Figure 1. Construction and schematic furnace cross-section CMe-T6810-25 

Several key features discussed are the various challenges that characterize modern industry; the differences between historical heat treat furnaces and vacuum furnaces; furnace features that can meet these obstacles; and a close look at what one equipment option from SECO/WARWICK can offer. Additionally, explore the case study of a process that resulted in the following assessment: All technological requirements have been met, obtaining the following indicators of efficiency and consumption of energy factors calculated for the entire load and per unit net weight of the load (700 kg).” 

Read the entire article at “Case Study: Heat Treat Equipment Meets the Future Industry Today”

How Things Work: Thermocouples 

How do thermocouples work? How would you tell if you had a bad one? Those ever-present temperature monitors are fairly straightforward to use, but when it comes to how it works — and why — things get complicated.  

Figure 2. Eric Yeager of Cleveland Electric Laboratories explaining the 101 of all things thermocouple

This transcript Q&A article was published in a print edition, but there was too much information to fit the pages. Click below to read the full-length interview, including the final conversation about how dissimilar metals create electromotive force (EMF). Included in the discussion is proper care of T/C and guidance on when it’s time to replace. 

Read the entire article at “How Things Work: Thermocouples”

A Quick Guide to Alloys and Their Medical Applications 

Figure 3. Sneak peak of this medical alloys resource 

If you’re pining for a medical heat treat quick resource in our “off-season,” we have a resource for you. Whether you are a seasoned heat treater of medical application parts or not, you know that the alloy composition of the part will greatly determine the type of heat treat application that is suitable. Before you expand your heat treat capabilities of medical devices, check out this graphic to quickly pin-point what alloys are in high-demand within the medical industry and what end-product they relate to. 

The alloys addressed in this graphic are titanium, cobalt chromium, niobium, nitinol, copper, and tantalum.  

Check out the full resource at “A Quick Guide to Alloys and Their Medical Applications”

Resource — Forging, Quenching, and Integrated Heat Treat: DFIQ Final Report 

How much time and energy does it take to bring parts through forging and heat treatment? Have you ever tried integrating these heat intensive processes? If part design, forging method, and heat treat quenching solutions are considered together, some amazing results can occur. Check out the report findings when Direct from Forge Intensive Quenching (DFIQTM) was studied. 

Figure 4. Examples of DFIQ equipment

Forgings were tested, in three different locations, to see if immediate quenching after forging made a difference in a variety of steel samples. The report shares, “The following material mechanical properties were evaluated: tensile strength, yield strength, elongation, reduction in area, and impact strength. Data obtained on the mechanical properties of DFIQ forgings were compared to that of forgings after applying a conventional post-forging heat treating process.” 

Read the entire article “Forging, Quenching, and Integrated Heat Treat: DFIQ Final Report”

3 Top Tips for Brinell and Rockwell Hardness Tests 

Figure 5. Testing hardness 

Accurate hardness testing is a critical business for numerous industries, not least heat treatment. In this guide, evaluate “best practice” for getting the best possible reading for your hardness test with the most efficiency. These comprehensive tips include proper set up for test equipment and need-to-know information regarding the preparation and execution of both Brinell and Rockwell hardness tests. 

In fact, while there are some practices that overlap, knowing the differences is critical to determine whether or not a piece has reached the appropriate hardness. For Brinell, grease may skew a reading so that “at 300 HBW the material may appear 20 HBW softer than it actually is.” On the other hand, the precision in measuring indentation depth (versus indentation width) makes it imperative to keep the surfaces clear of any contamination.  

Read the entire article at “3 Top Tips for Brinell and Rockwell Hardness Tests”

Trending Market Insights for Aluminum Thermal Processing 

Figure 6. State of the North American aluminum industry

In this survey on recent and developing changes in the aluminum market, we asked industry players about the impact of trending technology and the overall state of the industry. Their responses to our questions in August 2023 described a steady and increasing melters’ demand; a limited, or lack of, business increase from additive manufacturing and 3D printing; the impact of — and response to — slow supply chains; the status of sustainability in the aluminum market; and how they plan to meet future market demand. 

Read the entire article at “Trending Market Insights for Aluminum Thermal Processing”


Tech Round Up: Helpful, Readable, and Applicable Content Read More »

The Canary in the Furnace: Ceramic Disks Give Early Alerts of Temperature Changes

The question in many heat treaters’ minds is, “Why would I want more documentation on my furnaces?” TempTABs can act as an early warning sign that further temperature monitoring is necessary.

This Technical Tuesday article was written by Thomas McInnerney and Garrick Ackart of The Edward Orton Jr. Ceramic Foundation, for Heat Treat Today's November 2023 Vacuum Heat Treating print edition.


The Need for User-Friendly Documentation

Thomas McInnerney
Engineering Manager of Pyrometric Products
Edward Orton Jr. Ceramic Foundation.
Source: Edward Orton Jr. Ceramic Foundation

Increased regulations called for in AMS2750G and CQI-9 were, for the most part, driven by the client purchasing the items. With a business climate that can generate a product-liability lawsuit quicker than a rapid quench, clients are trying to protect themselves.

Contact us with your Reader Feedback!

Consequently, most heat treating facilities will perform the necessary and required temperature uniformity surveys (TUSs) as well as thermocouple calibrations. Once the formal TUS is complete, other than the information generated from the control thermocouples, the challenge still exists for the furnace operators to ascertain what happens throughout the furnace between surveys. By passing the last survey but failing the next one, how do you detect that something changed two days after the good survey or two days before the failed survey?

It is true you can run a temperature data logger with an array of thermocouples attached through the furnace to get a complete picture of the furnace performance, but that process includes production interruption, an expenditure of precious manpower, and significant expense in maintaining the data logger. Essentially, we have just defined the need for a cost-effective, user-friendly device to monitor the day-to-day repeatability of the performance of the furnace.

Metals Industry Demands

Garrick Ackart
Marketing and Business Development Manager
Edward Orton Jr. Ceramic Foundation.
Source: Edward Orton Jr. Ceramic Foundation

Driven by the question raised above, The Edward Orton Jr. Ceramic Foundation initiated a development project to provide such a product for the metals industry.

Demands of the metals industry are quite different from those of the ceramic industry. The detection device would have to be able to withstand rapid heat-up schedules, rapid quench, a wide variety of furnace atmospheres (air, nitrogen, hydrogen), and no atmosphere (vacuum), and do all this without introducing contaminants to the products being heat treated — no small challenge for an engineered ceramic product. Following a great deal of consultation and experimentation, Orton developed a product, the TempTAB, that can be used to benchmark and monitor furnace performance in most heat treating applications.

Measuring Dimension: How a TempTAB Works

How does the device work, and how is it made and controlled? The device depends on a constant slope curve of shrinkage versus temperature. When the device is exposed to more temperature and for longer periods of time at peak temperature, the amount of shrinkage increases.

Figure 1. The temperature monitoring system consists of ceramic sensors, a
measuring gauge, and software to convert dimension to temperature.
Source: Edward Orton Jr. Ceramic Foundation

TempTABs are small disks made from exact blends of select ceramic materials prepared in an environment where the processing variables are tightly controlled. The ceramic material is selected based on its predictable shrinkage, which is affected more by temperature than time; even so, holding at or near the peak temperature will have an impact on the final dimension.

Once the TempTAB is out of the furnace, its diameter is measured with a micrometer. The dimension, in millimeters, is entered into an Excel workbook that automatically looks up the equivalent temperature inside the furnace based on the furnace cycle time.

Temperature conversion charts are available with each batch of TempTABs for converting the diameter measurement to temperature. The charts have several columns of data which allow the user to find the data that is best associated with their final furnace cycle hold times (temperatures available for 10-, 30-, 60-, 120-, and 240-minute hold times). The charts are built into the software to allow you to monitor up to nine different locations inside the furnace for up to 360 runs (Figure 2). The software is available free from Orton’s website.

The resulting temperature data generated by the software is graphically displayed in both table and numerical format for easy interpretation. The data can also be copied into other Excel spreadsheets and SPC (Statistical Process Control) programs to be incorporated into existing quality programs.

Figure 2. Orton TempTAB software allows process temperature tracking at a glance.
Source: Edward Orton Jr. Ceramic Foundation

Primary Uses: Early Warning Device & Quality Control

Heat treat companies use these disks as an early warning device and to document that their processes are under control. First, they benchmark their thermal process by running several TempTABs through the heat treat furnace.

After establishing a benchmark with upper and lower control limits, the company will run the disks on a regular schedule, placing them in the same location alongside the parts being treated in the furnace (see process temperatures graphed with TempTABs in Figure 3).

Figure 3. Temperature data is displayed by location and can be copied into existing SPC software.
Source: Edward Orton Jr. Ceramic Foundation

At a glance, the furnace operator, the quality manager, or the general manager can see if the process is under control. The size of each disk indicates if the thermal process is, or is not, within the established control limits.

The case studies that follow demonstrate these primary uses in real-world heat treat.

Case Study #1: Furnace Documentation When You Need It

A manufacturer with in-house heat treating ran TempTABs alongside the thermocouples in one of its required nine-point uniformity surveys with a data logger. After the formal survey, they continued to run disks in each load, monitoring shrinkage of the disks. The heat treating operations wanted to document the thermal treatment of the product in every load. If something did change inside their furnace before the next required survey, the TempTABs would act as an early warning system alerting them that a formal survey may be necessary.

Case Study #2: Developing Backup Facilities/Preparing for Increased Demand

A company specializing in powder metal sintering wanted to duplicate a sintering process of one of their products, currently only being done at a single manufacturing site, at a second location. Initially, they duplicated all the settings in the new location (temperature settings and belt speed) and found that the resultant parts differed from those of the original site.

The company began to consider TempTABs. They liked the idea of having a device that could provide them with furnace temperature readings since they knew that it was an important variable to the quality of their parts. For one year, TempTABs were used daily for process control of the furnace. This use proved that the furnace was consistent and stable.

Since they had developed a benchmark of the disk dimensions yielding good parts, they were able to adjust the new facility settings so their process could be duplicated in the second facility. Within weeks, the powder metal sintering experts could produce products in the new facility consistent with the original facility.

Case Study #3: High-Value Heat Treating

A heat treating facility serving the aerospace industry historically ran nine thermocouples in every load of their batch furnace for bright annealing stainless steels to document furnace performance. The method required using many type S thermocouples and a data collection unit. Labor costs included setting up the thermocouple array and replacing the certified thermocouples. It was expensive and disruptive; they wanted an alternative.

The time needed to replace the TempTABs was minutes and only required one person’s time to place and gather them. After doing a correlation study of at least five runs over a week, the heat treat facility replaced the thermocouples with TempTAB disks. Now, a single operator places TempTABs inside every load so they can gather information at a lower cost. If they see any change in the amount of TempTAB shrinkage, they will run the thermocouple array to see precisely how the temperature profile has changed.

Figure 4. TempTAB wired in place during daily monitoring.
Source: Edward Orton Jr. Ceramic Foundation

About the authors:

Thomas McInnerney is the engineering manager of Pyrometric Products at The Edward Orton Jr. Ceramic Foundation. He received his BS in Ceramic Engineering at The Ohio State University and has been a key leader in the development and application of TempTABs for 22 years.

Garrick Ackart is the Marketing and Business Development manager at The Edward Orton Jr. Ceramic Foundation. He received a Bachelor of Science degree from Alfred University in Ceramic Engineering, an MBA from The Ohio State University, and has more than 25 years of experience in the ceramic and glass industry.

For more information:

Contact Thomas McInnerney at mcinnerney@ortonceramic.com or Garrick Ackart at ackart@ortonceramic.com.


Find heat treating products and services when you search on Heat Treat Buyers Guide.com


The Canary in the Furnace: Ceramic Disks Give Early Alerts of Temperature Changes Read More »

Discover the DNA of Automotive Heat Treat: Thru-Process Temperature Monitoring

In addressing the challenges of modern automated production flow, thru-process temperature monitoring and process validation strategies provide viable options in the automotive heat treat industry. Could they help your operations?

This Technical Tuesday article was composed by Steve Offley, “Dr. O,” product marketing manager, PhoenixTM. It appears in Heat Treat Today’s August 2023 Automotive Heat Treating print edition.


The Heat Treat Monitoring Goal

Dr. Steve Offley, “Dr. O”
Product Marketing Manager
PhoenixTM
Source: LinkedIn

In any automotive heat treatment process, it is essential that the heat treat application is performed in a controlled and repeatable fashion to achieve the physical material properties of the product. This means the product material experiences the required temperature, time, and processing atmosphere to achieve the desired metallurgical transitions (internal microstructure) to give the product the material properties to perform it’s intended function.


When tackling the need to understand how the heat treat process is performing, it is useful to split the task up into two parts: focusing on the furnace technology first, and then introducing the product into the mix.

If we consider the furnace performance, we need to validate that the heat treat technology is capable of providing the desired accurate uniformity of heating over the working volume of the furnace for the desired soak time where the products are placed. This is best achieved by performing a temperature uniformity survey (TUS). The TUS is a key pyrometry requirement of the CQI-9 Heat Treat System Assessment (AIAG) standard applied by many automotive OEMs and suppliers.

Traditionally temperature uniformity surveys are performed using a field test instrument (chart recorder or static data logger) external to the furnace with thermocouples trailing into the furnace heating chamber. Although possible, this technique has many limitations, especially when applying to the increasingly automated semi or continuous operations discussed later in this article.

Thru-process Temperature Profiling — Discover the Heat Treat DNA

When it comes to heat treatment, the TUS operation gives a level of confidence that the furnace technology is in specification. However, it is important to understand the need to focus on what is happening at the real core of the product from a temperature and time perspective. Product temperature profiling, as its name suggests, is the perfect technique. Thermocouples attached to the part, or even embedded within the part, give an accurate record of the product temperature at all points in the process, referred to as a product temperature profile. Such information is helpful to determine process variations from critical factors such as part size, thermal mass, location within the product basket, furnace loading, transfer rate, and changes to heat treat recipe. Product temperature profiling by trailing thermocouples with an external data logger (Figure 1) is possible for a simple batch furnace, but it is not a realistic option for some modern heat treat operations.

Figure 1. Typical TUS survey set-up for a static batch furnace. PhoenixTM PTM4220 External data logger connected directly to a 9 point TUS frame used to measure the temperature uniformity over the volumetric working volume of the furnace.
Source: PhoenixTM

With the industry driving toward fully automated manufacturing, furnace manufacturers are now offering the complete package with full robotic product loading — shuttle transfer systems and modular heat treat phases to either process complete product baskets or one-piece operations.

The thru-process monitoring principle overcomes the problems of trailing thermocouples as the multi-channel data logger (field test instrument) travels into and through the heat treat process protected by a thermal barrier (Figure 2).

Figure 2. PhoenixTM thru-process monitoring system. (1) The thermal barrier protects internal multi-channel data logger, (2) the field test instrument, (3) the product thermal profile view, (4) the temperature uniformity survey (TUS), and (5) short nonexpendable mineral insulated thermocouples.
Source: PhoenixTM

The short thermocouples are fixed to either the product or TUS frame. Temperature data is then transmitted either live to a monitoring PC running profile or the TUS analysis software via a two-way RF (radio frequency) telemetry link or downloaded post run.

Although thru-process temperature monitoring in principle can be applied to most heat treat furnace operations, obviously no one solution will suit all processes, as we know from the phrase, “One size doesn’t fit all.”

For this very reason, unique thermal barrier designs are required to be tailored to the specific demands of the application whether temperature, pressure, atmosphere, or geometry as described in the following section.

Product Profiling and TUS in Continuous Heat Treat Furnaces

Thru-process product temperature profiling and/or surveying of continuous furnace operations, unlike trailing thermocouples, can be performed accurately and safely as part of the conventional production flow allowing true heat treat conditions to be assessed. As shown in Figure 3, surveying of the furnace working zone can be achieved using the plane method. A frame attached to the thermal barrier positions the TUS thermocouples at designated positions relative to the two dimensional working zone (furnace height and width) as defined in the pyrometry standard (CQI-9) during safe passage through the furnace (soak time).

Figures 3. Temperature uniformity survey of a continuous furnace using the plane method applying the PhoenixTM thru-process monitoring system. The data logger travels protected in a thermal barrier mounted on the TUS frame performing a safe TUS at four points across the width, which is impossible with trailing thermocouples.
Source: : Raba Axle, Györ, Hungary

Sealed Gas Carburizing and Oil Quench Monitoring

For traditional sealed gas carburizing where product cooling is performed in an integral oil quench, the historic limitation of thru-process temperature profiling has been the need to bypass the oil quench and wash stations.

In such carburizing processes, the oil quench rate is critical to both the metallurgical composition of the metal and to the elimination of product distortion and quench cracks, and so the need for a monitoring solution has been significant. Regular monitoring of the quench is important as aging of the oil results in decomposition, oxidation, and contamination of the oil, all of which degrade the heat transfer characteristics and quench efficiency.

To address the process challenges, a unique barrier design has been developed that both protects the data logger in the furnace (typically 3 hours at 1700°F/925°C) and during transfer through the oil quench (typically 15 minutes) and final wash station.

Figures 4. PhoenixTM thru-process temperature profiling system monitoring the core temperature of automotive parts in a traditional sealed gas carburizing furnace with integral oil quench. (left) System entering carburizing furnace in product basket. (right) Thermal barrier showing outer structural frame and sacrificial insulation blocks protecting inner sealed thermal barrier housing the data logger.
Source: PhoenixTM

The key to the barrier design is the encasement of a sealed inner barrier (Figure 4) with its own thermal protection with blocks of high-grade sacrificial insulation contained in a robust outer structural frame. The innovative barrier offers complete protection to the data logger allowing product core temperature monitoring for the complete heat treat process under production conditions.

Low Pressure Carburizing with High Pressure Gas Quench

In the current business environment, an attractive alternative to the traditional sealed gas carburizing application for both energy and environmental reasons is low pressure carburizing (LPC). Following the vacuum carburizing process, the product is transferred to a sealed high-pressure gas quench chamber where the product is rapidly gas cooled using typically N2 or Helium at up to 20 bars.

Such technology lends itself to automation with product baskets being transferred by shuttle drives and robot loading mechanisms from chamber to chamber in a semi-continuous fashion. The sequential processing (with stages often being performed in self-contained sealed chambers) can only be monitored by the thru-process approach where the system (thermal barrier protected data logger) is self-contained within the product basket or TUS frame.

In such processes the technical challenge is twofold. The thermal barrier must be capable of protecting against not only heat during the carburizing phase, but also very rapid pressure and temperature changes inflicted by the gas quench. To protect the thermal barrier in the LPC process with gas quench, the barrier construction needs to be able to withstand constant temperature cycling and high gas pressures. The design and construction features include:

  • Metal work: 310 stainless steel to reduce distortion at high temperature combined with internal structural reinforcement
  • Insulation: ultra-high temperature microporous insulation to minimize shrinkage problems
  • Rivets: close pitched copper rivets reduce carbon pick up and maintain strength
  • Lid expansion plate: reduces distortion during rapid temperature changes
  • Catches: heavy duty catches eliminating thread seizure issues
  • Heat sink: internal heat sink to provide additional thermal protection to data logger

During the gas quench, the barrier needs to be protected from Nitrogen N2 (g) or Helium He(g) gas pressures up to 20 bar. Such pressures on the flat top of the barrier would create excessive stress to the metal work and internal insulation or the data logger. Therefore, a separate gas quench deflector is used to protect the barrier. The tapered top plate deflects the gas away from the barrier. The unique design means the plate is supported on either four or six support legs. As it is not in contact with the barrier, no force is applied directly to the barrier and the force is shared between the support legs.

In LPC technology further monitoring challenges are faced by the development of one piece flow furnace designs.

Figures 5. (left) Thermal barrier being loaded into LPC batch furnace with TUS frame as part of temperature uniformity survey. (right) Thermal barrier shown with independent quench deflector providing protection during the high pressure gas quench.
Source: PhoenixTM

New designs incorporate single piece or single product layer tray loading into multiple vertical heat treat chambers followed by auto loading into mobile high pressure quench chamber. Miniturization of each separate heat treat chamber limits the space available to the monitoring system. The TS02-128-1 thermal barrier has been designed specifically for such processes utilizing the compact 6 channel “Sigma” data logger allowing reduction of the footprint of the system to fit the product tray and reduce thermal mass. With a height of only 128 mm/5 inch and customized independent low height quench deflector, the system is suitable for challenging low height furnace chambers and offers 1 hour protection at 1472°F/800°C in a vacuum.

Figure 6. (left) Low profile TUS system (TS02-128-1 thermal barrier six channel Sigma data logger) designed with TUS surveying individual one-piece flow heat treatment LPC furnace chambers (right) Thermal barrier shown with optional low profile gas quench deflector.
Source: PhoenixTM

Rotary Hearth Furnace Monitoring — Solution Reheat of Aluminum Engine Blocks

In modern rotary hearth furnaces (Figure 7), temperature profiling using trailing thermocouples is impossible as the cables would wind up in the furnace transfer mechanism. Due to the central robot loading and unloading and elimination of charging racks/baskets, the use of a conventional thru-process system would also be a challenge.

Figure 7. A modern rotary hearth furnace.
Source: PhoenixTM

To eliminate the loading restrictions, a unique thermal barrier small enough to fit inside the cavity of the engine block and allow automated loading of the complete combined monitoring system and product has been developed. To optimize the thermal performance of the thermal barrier with such tight size constraints, a phased evaporation technology is employed. Thermal protection of the high temperature data logger is provided by an insulated water tank barrier design keeping the operating temperature of the data logger at a safe 212°F/100°C or less. The system allowed BSN Thermoprozesstechnik GmbH in Germany to commission the furnace accurately and efficiently and thereby optimize settings to not only achieve product quality but also ensure energy efficient, cost effective production.

Summary

Thru-process product temperature profiling and surveying provide a versatile, accurate, and safe solution for monitoring increasingly automated, intelligent furnace lines and the means to understand, control, optimize, and certify your heat treat process.

About the author:

Dr. Steve Offley, “Dr. O,” has been the product marketing manager at PhoenixTM for the last five years after a career of over 25 years in temperature monitoring focusing on the heat treatment, paint, and general manufacturing industries. A key aspect of his role is the product management of the innovative PhoenixTM range of thru-process temperature and optical profiling and TUS monitoring system solutions.

For more information:

Contact Steve at Steve.Offley@phoenixtm.com.


Find heat treating products and services when you search on Heat Treat Buyers Guide.com


Discover the DNA of Automotive Heat Treat: Thru-Process Temperature Monitoring Read More »

Continuing Ed — Heat Treat Technical Tuesday Round Up

OC

Heat Treat Today’s Technical Tuesday feature means that on just about any given Tuesday, there will be an article that aims to educate our heat treating readers be it in a process, equipment, metals, analysis, critical parts, or more. Enjoy this sampling of Technical Tuesday articles from the past several months.


Case Study: Heat Treat Equipment Meets the Future Industry Today 

Contact us with your Reader Feedback!

Construction and schematic furnace cross-section CMe-T6810-25
Source: SECO/WARWICK

How has one heat treat furnace supplier contended with modern challenges of manufacturing? In this case study about a shift away from traditional forms of heat treat, explore how vacuum furnace technology has more technological horizons to bound. 

Several key features discussed will be the various challenges that characterize modern industry; the differences between historical heat treat furnaces and vacuum furnaces; furnace features that can meet these obstacles; and a close look at what one equipment option from SECO/WARWICK helps. Additionally, explore the case study of a process that resulted in the following assessment: "all technological requirements have been met, obtaining the following indicators of efficiency and consumption of energy factors calculated for the entire load and per unit net weight of the load (700 kg)." 

Read the entire article here.

How Things Work: Thermocouples 

Eric Yeager of Cleveland Electric explaining the 101 of all things thermocouple
Source: Heat Treat Today

How do thermocouples work? How would you tell if you had a bad one? Those ever present temperature monitors are fairly straightforward to use, but when it comes to how it works — and why — things get complicated.  

This transcript Q&A article was published in the print edition last year (2022), but there was too much information to fill the pages. Online, read the full-length interview, including the final conversation about how dissimilar metals create EMF. Included in the discussion is proper care of the T/C and knowledge of when it’s time to replace. 

Read the entire article here.

6 Heat Treat Tech Trends Fulfilled in 2022

Trends in the heat treat industry
Source: Unsplash.com/getty images

What’s “hot” for heat treaters in recent months? The trends are pointing towards streamlining upgrading information systems, more efforts to reduce carbon footprint, and ensuring processes in salt quenching and electricity use are as efficient as they can be. 

Each of the 6 trends included in the article demonstrates that heat treaters are making thoughtful and responsible decisions and purchases. Considerations include care for the environment and methods to help employees share and receive information needed for each job.  

Read more about each of the trends to see what’s happening with equipment purchases and technology decisions and how companies are pushing to make that carbon footprint smaller. 

Read the entire article here.

A Quick Guide to Alloys and Their Medical Applications 

Sneak peak of this medical alloys resource
Source: Heat Treat Today

If you're pining for a medical heat treat quick resource in our "off-season," we have a resource for you. Whether you are a seasoned heat treater of medical application parts or not, you know that the alloy composition of a part will greatly determine the type of heat treat application that is suitable. Before you expand your heat treat capabilities of medical devices, check out this graphic to quickly pin-point what alloys are in high-demand within the medical industry and what end-product they relate to. 

The alloys addressed in this graphic are: titanium, cobalt chromium, niobium, nitinol, copper, and tantalum.  

Read the entire article here.

Resource -- Forging, Quenching, and Integrated Heat Treat: DFIQ Final Report 

Examples of DFIQ equipment
Source: Joe Powell

How much time and energy does it take to bring parts through forging and heat treatment? Have you ever tried to integrating these heat intensive processes? If part design, forging method, and heat treat quenching solutions are considered together, some amazing results can occur. Check out the report findings when the Direct from Forge Intensive Quenching (DFIQTM) was studied. 

Forgings were tested, in three different locations, to see if immediate quenching after forging made a difference in a variety of steel samples. The report shares, “The following material mechanical properties were evaluated: tensile strength, yield strength, elongation, reduction in area and impact strength. Data obtained on the mechanical properties of DFIQ forgings were compared to that of forgings after applying a conventional post-forging heat-treating process.” 

 Read the entire article here.


Find heat treating products and services when you search on Heat Treat Buyers Guide.com


Continuing Ed — Heat Treat Technical Tuesday Round Up Read More »

Heat Treat Radio Series for Spring

OC

The days are getting a little longer, you've saved up some vacation hours, it's time for a break this spring!

Make use of some down time to listen in on a couple of Heat Treat Radio series. Putting in some driving miles, relaxing in the sand, or enjoying a staycation all mean some time to peacefully enjoy some heat treat topics. We've put together an original content piece that lets you listen in on a 3-part series on thermocouples, and a back-to-basics series on heat treat hardening. It's nice to know that there is plenty to listen to; you can just click to play each episode!


Thermocouples 101 with Ed Valykeo and John Niggle

This series gives the opportunity to learn from an expert all about thermocouples. The first episode digs into thermocouple history, types, vocabulary, and other basics. Hear from Ed Valykeo, as he gives some of his own history and then dives into all things thermocouple.

1. Heat Treat Radio #61

Contact us with your Reader Feedback!

The second episode covers thermocouple accuracy and classification. Ed Valykeo continues to review and explain necessary information on how thermocouples are calibrated and used.

2. Heat Treat Radio #62

The final episode in this series gets into discussion with John Niggle about thermocouple insulation types. His review towards the beginning of the episode is helpful, and his discussion of insulation reminds readers that job specifications and requirements are crucial.

3. Heat Treat Radio #64

Metal Hardening 101 

Mark Hemsath sits down with Heat Treat Radio to provide an overview of metal hardening basics. In the first part of the series he provides explanation of what it is, what materials can be hardened, why it has to be done, and more.

1. Heat Treat Radio #49

For the second episode, Mark Hemsath explains five hardening processes: carburizing, nitriding, carbonitriding, ferritic nitrocarburizing, and low pressure carburizing.

2. Heat Treat Radio #54

In this final episode for the metal hardening series, a discussion is presented on newer advances in metal hardening. A call is even put out for new ideas and engineers willing to experiment with some of these advance.

3. Heat Treat Radio #56

As you can see above, this resource provides two series -- each with three parts -- that give a comprehensive look at two fundamental components in the heat treat industry. Both the discussion of thermocouples and the investigation of metal hardening provide educational listening with something for everyone in the form of review as well as maybe some basics that have been neglected or forgotten.


.

Search for heat treat solution providers and suppliers on Heat Treat Buyers Guide.com


Heat Treat Radio Series for Spring Read More »

Heat Treat Radio #91: Understanding the ±0.1°F Requirement in AMS2750, with Andrew Bassett

Where did the ±0.1°F AMS2750 requirement come from and how should heat treaters approach this specification, an important change that entails major buy-in? Andrew Bassett, president and owner of Aerospace Testing and Pyrometry, was at the AMS2750F meeting. He shares the inside scoop on this topic with Heat Treat Today and what he expects for the future of this standard.

Heat Treat Radio podcast host and Heat Treat Today publisher, Doug Glenn, has written a column on the topic, which you can find here; read it to understand some of the background, questions, and concerns that cloud this issue.

Below, you can watch the video, listen to the podcast by clicking on the audio play button, or read an edited transcript.


The following transcript has been edited for your reading enjoyment.

Doug Glenn: Andrew Bassett, president and owner of Aerospace Testing and Pyrometry, Inc., somewhere in eastern Pennsylvania. We don’t know because you’re on the move! What is your new address, now, by the way?

Contact us with your Reader Feedback

Andrew Bassett: We are in Easton, Pennsylvania at 2020 Dayton Drive.

Doug Glenn: Andrew, we want to talk a bit about this ±0.1°F debate that is going on. It was actually precipitated by the column that I wrote that is in the February issue.

I just wanted to talk about that debate, and I know that you’ve been somewhat involved with it. So, if you don’t mind, could you give our listeners a quick background on what we are talking about, this ±0.1°F debate.

Andrew Bassett: To be honest with you, being part of the AMS2750 sub team, one of the questions came up for us during the Rev F rewrite was this 0.1°F readability — wanting to kind of fix this flaw that’s been in the standard ever since the day that AMS2750 came out. With instrumentation, for instance, you have ±2°F (the equivalent would be 1.1°C). At 1.1°C, the question became, If your instrumentation does not show this 0.1 of a degree readability, how can you show compliance to the standards?

Andrew Bassett
President
Aerospace Testing and Pyrometry
Source: DELTA H

Then, it morphed into other issues that we’ve had in the previous revisions where we talk about precise temperature requirements, like for system accuracy testing: You’re allowed a hard number ±3° per Class 2 furnace or 0.3% of reading, whichever is greater. Now, we have this percentage. With anything over 1000°F, you're going to be able to use the percentage of reading to help bring your test into tolerance. In that example, 1100°F, you’re about 3.3 degrees. If your instrumentation doesn’t show this readability, how are you going to prove compliance?

That’s what it all morphed into. Originally, the first draft that we proposed in AMS2750F was that all instrumentation had to have 0.1°F readability. We got some feedback (I don’t know if I want to say “feedback” or "pitchforks and hammers") that this would be cost-prohibitive; most instrumentation doesn't have that readability, and it would be really costly to go out and try to do this. We understood that. But, at the end of the day, we said: The recording device is your permanent record, and so that’s what we’re going to lean on. But we still had a lot of pushback.

We ended up putting a poll out to AMEC and the heat treating industry to see what their opinions were. We said that with the 0.1 readability (when it came to a percentage reading), recording devices would read hard tolerances. So, for instance, an SAT read at 3° would be just that, not "or .3% of reading."

There was a third option that we had put out to the community at large, and it came back as the 0.1° readability for digital recorders, so that’s where we ran with the 0.1° readability.

When it was that big of an issue, we didn’t make the decisions ourselves; we wanted to put it out to the rest of the community. My guess is not everyone really thought the whole thing through yet. Now people are like, ok, well now I need to get this 0.1° readability.

Again, during the meetings, we heard the issues. Is 0.1° going to really make a difference to metal? If you have a load thermocouple that goes in your furnace and it reads 0.1° over the tolerance, does it fail the load? Well, no, metallurgically, we all know that’s not going to happen, but there’s got to be a line in the sand somewhere, so it was drawn at that.

"...that hard line in the sand had to be drawn somewhere..."
Source: Unsplash.com/Willian Justen de Vasconcellos

That’s a little bit of the background of the 0.1° readability.

Doug Glenn: So, basically, we’re in a situation, now, where people are, in fact (and correct me if I’m wrong here),  potentially going to fail SATs or tests on their system because of a 0.1° reading, correct? I mean, it is possible, correct?

Andrew Bassett: Yes. So, when the 0.1° readability came out in Rev F, we gave it a two-year moratorium that with that requirement, you still had two more years. Then, when Rev G came out, exactly two years to the date, we still had a lot of customers coming to us, or a lot of suppliers coming back to us, and saying, “Hey, look, there’s a supply shortage on these types of recorders. We need to buy some time on this.” It ranged from another year to 10 years, and we’re like — whoa, whoa, whoa! You told us, coming down the pike before, maybe you pushed it down the road, whatever, probably Covid put a damper on a lot of people, so we added another year.

So, as of June 30th of 2023, that requirement is going to come into full play now. Like it or not, that’s where the standard sits.

Doug Glenn: So, you’re saying June 30th, 2023?

Andrew Bassett: Yes.

Doug Glenn Alright, that’s good background.

I guess there were several issues that I raised. First off, you’ve already hit on one. I understand the ability to be precise, but in most heat treatment applications, one degree is not going to make a difference, right? So, why do we push for a 0.1° when 1° isn’t even going to make a difference?

Andrew Bassett: We know that, and it’s been discussed that way. But, again, that hard line in the sand had to be drawn somewhere, and that was the direction the community wanted to go with, so we went with that. Yes, we understand that in some metals, 10 degrees is not going to make a difference, but we need to have some sort of line in the sand and that's what was drawn.

Doug Glenn: So, a Class 1. I was thinking the lower number was a tighter furnace. So, a Class 1 (±5), and you’re saying, that’s all the furnace is classified for, right, ±5? So, if you get a reading of 1000°, it could be 1005° or it could be 995°. Then, you’re putting on top of that the whole idea that your temperature reading has got to be down to 0.1°. There just seems to be some disconnect there.

So, that was the first one. You also mentioned the instrumentation. It’s been pointed out to me, by some of the instrumentation people, that their instruments are actually only reading four digits. So up to 99.9 you actually have a point, but if it goes to 1000°, you’re out of digits; you can’t even read that. I mean, they can’t even read that down to a point.

"So, if you get a reading of 1000°, it could be 1005° or it could be 995°."
Source: Unsplash.com/Getty Images

Andrew Bassett: Correct. On the recording side of things, we went away from analog instrumentation. The old chart papers, that’s all gone, and we required the digital recorders with that 0.1° readability, as of June 30th of this year.

Again, the first draft was all instrumentation. That would be your controllers, your overtemps, and we know that limitation. But everyone does have to be aware of it. We still allow for this calibration of ±2 or 0.2%. If you’re doing a calibration, let’s say, on a temperature control on a calibration point at 1600° and the instrument only reads whole numbers, you can use the percentage, but you would have to round it inward. Let’s use 1800°, that would be an easier way to do it. So, I’m allowed ±2 or 3.6° if I’m using the percentage of reading, but if the instrument does not read in decimal points for a controller or overtemp, you would have to round that down to ±3°.

Doug Glenn: ±3, right; the 0.6° is out the window.

Andrew Bassett: Correct. I shouldn’t say we like to bury things in footnotes, but this was an afterthought. In one of the footnotes, in one of the tables, it talks about instrumentation calibration that people need to be aware of.

Doug Glenn: Let’s just do this because I think we’ve got a good sense of what the situation is, currently. Would you care to prognosticate about the future? Do you think this is going to stand? Do you think it will be changed? What do you think? I realize you’re speaking for yourself, here.

Andrew Bassett: I’m conflicted on both sides. I want to help the supply base with this issue but I’m also on the standards committee that writes the standard. I think because we’re so far down the road, right now — this requirement has been out there since June 2022 — I don’t see anything being rolled back on it, at this point. I think if we did roll it back, we have to look at it both ways.

If we did roll this back and say alright, let’s just do away with this 0.1° readability issue, we still have to worry about the people processing in Celsius. Remember, we’re pretty much the only country in the world that processes in Fahrenheit. The rest of the world has been, probably, following these lines all along. If we rolled this back, just think about all the people that made that investment and moved forward on the 0.1° readability and they come back and say, “Wait a minute. We just spent a $100,000 on upgrading our systems and now you’re rolling it back, that’s not fair to us.”

At this point, with the ball already rolling, it would be very interesting to see when Nadcap starts publishing out the audit findings when it comes to the pyrometry and this 0.1° readability to see how many suppliers are being hit on this requirement and that would give us a good indication. If there are a lot of yeses on it then, obviously, a lot of suppliers haven’t gone down this road. My guess is, for the most part, anybody that’s Nadcap accredited in heat treating — and this goes across chemical processing, coatings, and a few other commodities — I think has caught up to this.

Personally, I don’t think this is going to go away; it’s not going to disappear. It’s going to keep going down this road. Maybe, if people are still struggling with getting the types of devices that can have that 0.1° readability, then maybe another year extension on it, but I don’t know where that is right now. I haven’t gotten enough feedback from aerospace customers that say, "Hey, I can’t get the recorder." I mean,

Doug Glenn: I just don’t understand, Andrew, how it’s even physically possible that companies can record something as accurately as 0.1° if the assembly or thermocouple wire is rated at ±2°? How is that even possible that you can want somebody to be accurate down to ±0.1° when the thing is only accurate up to ±2°?

Andrew Bassett: Right, I get that. We can even go a lot further with that and start talking about budgets of uncertainty. If you look at any reputable thermocouple manufacturer or instrument calibration reports that are ISO 17025, they have to list out their measurements of uncertainty, and that gives you only the 98% competence you’re going to be within that accuracy statement.

Yes, I get the whole issue of this .1° readability. There were good intentions were to fix a flaw, and it spiraled. We’ve seen where PLCs and some of these high logic controllers now can show the .1° readability, but they automatically round up at .5°. Are you now violating the other requirements of rounding to E29? Now, I think we’ve closed out the poll in the standard, but you’re right. We were trying to do the right thing. Personally, I don’t think we gave it all that much further thought on that except hey, let’s just make recorders this way and this should be okay.

Doug Glenn: Right. No, that’s good. Let me be clear, and I think most everybody that was involved with the standards are excellent people and they’re trying to do the right thing. There is no dissing on anybody that was doing it. I’m not a furnace guy, right, I’m a publisher — but when I look at it, I’m going: okay, you’re asking somebody to be as accurate as 0.1° on equipment that can only do ±2°. That’s a 4° swing and you’re asking them to be within 0.1°, basically.

Andrew, this has been helpful. It’s been good hearing from you because you’re on the frontline here. You’ve got one foot firmly planted in both camps.

Andrew Bassett: I’m doing my best to stay neutral with it all.

Doug Glenn: Anyhow, I appreciate it, Andrew. You’re a gentleman. Thanks for taking some time with us.

Andrew Bassett: Thanks, Doug. Appreciate it.


About the expert: Andrew Bassett has more than 25 years of experience in the field of calibrations, temperature uniformity surveys, system accuracy testing, as well an expertise in pressure, humidity, and vacuum measurement calibration. Prior to founding Aerospace Testing & Pyrometry, Andrew previously held positions as Vice President of Pyrometry Services and Director of Pyrometry Services for a large commercial heat treater and Vice President and Quality Control Manager for a small family owned business.

For more information: Andrew Bassett at abassett@atp-cal.com or visit http://www.atp-cal.com/

Doug Glenn at Doug@heattreattoday.com


Doug Glenn <br> Publisher <br> Heat Treat Today

Doug Glenn
Publisher
Heat Treat Today


To find other Heat Treat Radio episodes, go to www.heattreattoday.com/radio .


Search heat treat equipment and service providers on Heat Treat Buyers Guide.com


Heat Treat Radio #91: Understanding the ±0.1°F Requirement in AMS2750, with Andrew Bassett Read More »

¿Cómo elegir el termopar correcto en Tratamientos Térmicos?

OCLos termopares: elementos indispensables para lograr un acertado tratamiento térmico, pero ¿cómo elegir el más indicado para su necesidad particular? ¿Qué exigen las normas actuales? A continuación una explicación, por Víctor Zacarías, director general de Global Thermal Solutions México, que le ayudará a saber escoger el termopar adecuado.

Palabras clave: Termopar, Tratamiento térmico, Pirometría, Medición y Control de Temperatura, AMS2750, CQI-9

Read the Spanish translation of this article in the version below, or see both the Spanish and the English translation of the piece where it was originally published: Heat Treat Today's February's Air & Atmosphere Furnace Systems print edition.

Si quisieras aportar otros datos interesantes relacionados con los termopares, nuestros editores te invitan a compartirlos para ser publicados en línea en www.heattreattoday.com. Puedes hacerlos llegar a Bethany Leone al correo bethany@heattreattoday.com


Víctor Zacarías
Director General
Global Thermal Solutions México

La norma aeroespacial SAE AMS2750 y las evaluaciones automotrices de AIAG CQI-9, CQI-11, CQI-12, y CQI-29 son los estándares universalmente aceptados para el control de temperatura en operaciones de procesamiento térmico. Entre muchas cosas, describen los requisitos para el uso y control de los termopares empleados en hornos y estufas de proceso. En este artículo te comparto los requisitos de estas normativas para que puedas tomar una decisión correcta al elegir un termopar y de esta manera contar con una medición repetible que te asegure un proceso confiable.

1. Aplicación

Contact us with your reader feedback!

Para la selección apropiada de un termopar para la medición, control y/o registro de la temperatura debes considerar en primer lugar el tipo de proceso previsto. En la elección del termopar adecuado, toma en cuenta algunos factores que pudieran alterar su desempeño como:

  • El rango de temperatura en el que estará en uso
  • El tipo de atmósfera al que estará expuesto
  • Posible interferencia eléctrica
  • La precisión requerida por la especificación aplicable, etc.

En función de lo anterior, las normativas refieren una clasificación específica para los termopares en función de su fabricación y su aplicación final:

a) Termopares base y termopares nobles
b) Termopares desechables y no desechables

2. Tipos de termopar y su aislamiento

2.1 Termopar base o termopar noble

Un termopar base está fabricado de aleaciones básicas como hierro, cromo, níquel, cobre, etc., y constituyen los tipos más comunes en la industria por su versatilidad y costo: los termopares tipo K, E, J, N, y T. Un buen proveedor de sensores te recomendará un termopar de este tipo en función de la aplicación, el rango de temperatura y tu presupuesto (ver Tabla 1).

Tabla 1: Rango de temperatura y uso de los termopares más comunes
Source: GTS México

Por otro lado, un termopar noble está fabricado a partir de metales como platino y rodio: termopares tipo R, S y B. Éstos termopares son más estables a altas temperaturas y mantienen su precisión por mayor tiempo; sin embargo, tienen un costo elevado debido a que se fabrican a partir de metales preciosos. Debido a esta naturaleza, los termopares nobles son la elección preferida para aplicaciones de tratamiento térmico al vacío y procesos de alta temperatura.

2.2 Termopares desechables o no desechables

El segundo criterio de las normativas lo constituye el material con el que se protegen los elementos del termopar.

Los termopares desechables son aquellos cuyos elementos están revestidos por materiales como fibra de vidrio, tejido cerámico o recubrimiento polimérico y generalmente se suministran en forma de carrete o bobina. Esta presentación permite al usuario cortar el cable a la medida y fabricar el termopar al unir los dos alambres de un extremo por torsión o soldadura, lo que los hace ideales por ejemplo para aplicaciones de un solo uso como una prueba TUS o termopares de carga (ver Figura 1).

Figura 1: TUS usando termopar desechable tipo K aislado en fibra cerámica
Source: Trucal, Inc.

En contraste un termopar no desechable normalmente está protegido con aislamiento cerámico o mineral y revestido en su exterior por una carcasa metálica (los elementos no están expuestos en esta configuración), lo que le proporciona un mayor tiempo de vida útil y por eso se prefieren para emplearse como termopares de control o registro (ver Figura 2).

Figura 2: Termopares no desechables tipo N y K de aislamiento mineral
Source: GTS México

Cualquiera que sea la aplicación, cuando se requiere realizar interconexiones de cableado para la instalación del sensor, dichas conexiones se deben realizar usando conectores y terminales estándar como las que se muestran en la Figura 3, ya que tanto AMS2750 como CQI- 9 prohíben el empalme del cableado.

Figura 3: Conectores estándar tipo K
Source: GTS México

3. Calibración

De acuerdo con la normatividad, todos los termopares usados en operaciones de procesamiento térmico deben haber sido calibrados antes de usarse por primera vez. Para ello, el usuario del termopar debe asegurarse de contar con calibraciones trazables al laboratorio nacional como lo es el NIST en Estados Unidos o su equivalente en México (CENAM).

Las normas de pirometría defi nen los rangos aceptables de error para los termopares en función de su aplicación fi nal: 1) termopares patrón, 2) termopares de prueba (SAT y TUS), 3) termopares de control y registro y 4) termopares de carga. La Tabla 2 describe los máximos errores permitidos a elegir dependiendo del uso del sensor.

Tabla 2: Precisión requerida para sensores de temperatura según AMS2750 y CQI-9
Source: GTS México

Una vez instalado el termopar, el responsable de la operación de tratamiento térmico tiene que deberá documentar la fecha en la que éste entra en servicio, ya que la norma establece un tiempo de vida útil de un sensor en función de la aplicación del mismo.

Al recibir el reporte/certifi cado del termopar, el usuario debe revisar el contenido del documento, pues las normas también definen de manera específi ca la información mínima que debe aparecer en un informe de calibración, que incluye pero no se limita a:

1. Lecturas de prueba
2. Lecturas observadas
3. Factores de corrección
4. Fuente de los datos
5. Acreditación del laboratorio
6. Método de calibración empleado

El certifi cado de calibración puede amparar termopares individuales o un grupo de termopares fabricados a partir del mismo lote (carrete).

Es muy importante observar que tanto AMS2750 como CQI-9 requieren que todas las calibraciones sean realizadas por organismos acreditados en la norma ISO/IEC 17025, por lo que siempre recomiendo que revises el certifi cado de acreditación antes de seleccionar a tu proveedor.

4. En Resumen

Si alguna vez has comprado el termopar equivocado, se lo molesto que puede resultar. Por lo tanto aquí te comparto un resumen para seleccionar el sensor adecuado para su aplicación en 5 sencillos pasos:

1. Define el tipo de termopar: base ( K, T, J, E , N, y M) o noble (S, R, y B)
2. Define el tipo de aislamiento que requieres: fibra textil, polímero, cerámico, metálico, etc.
3. Especifi ca el rango exacto de temperatura en el que operará el sensor
4. Especifi ca el uso del sensor: termopar patrón (estándar), termopar para SAT/TUS, termopar de control / carga
5. Solicita el certifi cado de calibración conforme a la normativa aplicable (AMS2750 o CQI-9)


Referencias

ASTM International. ASTM E230, Standard Specification for Temperature-Electromotive Force (emf) Tables for Standardized Thermocouples, Rev. 2017.

Automotive Industry Action Group. CQI-9 Special Process: Heat Treat System Assessment, 4th Edition. June 2020

International Organization for Standardization. ISO/IEC 17025, General Requirements for the Competence of Testing and Calibration Laboratories, 3rd Edition. 2017.

Nadcap AC7102/8 Audit Criteria for Pyrometry, Rev. A, 2021

SAE Aerospace. Aerospace Material Specifi cation AMS2750: Pyrometry, Rev. G, 2022.


Sobre el autor: Víctor Zacarías es ingeniero metalúrgico egresado de la Universidad Autónoma de Querétaro con estudios en Gerencia Estratégica por parte del Tec de Monterrey. Con más de 15 años de experiencia en la gestión de tratamientos térmicos, actualmente es director general de Global Thermal Solutions México. Víctor ha realizado numerosos cursos, talleres y evaluaciones en México, Estados Unidos, Brasil, Argentina y Costa Rica y ha participado en el Grupo de Trabajo de Tratamiento Térmico de AIAG (CQI-9) y en el Comité de Ingeniería de Materiales Aeroespaciales de SAE.

Contact/Contacto Victor: victor@globalthermalsolutions.com


Find heat treating products and services when you search on Heat Treat Buyers Guide.com


¿Cómo elegir el termopar correcto en Tratamientos Térmicos? Read More »

How To Choose the Right Thermocouple in Heat Treatment

OC

Thermocouples: You can’t accurately heat treat without them. But how can you choose the best one for your needs? What do current regulations require? Read this helpful explanation, by Víctor Zacarías, managing director of Global Thermal Solutions Mexico, to find out how to choose the right thermocouple.

Keywords: Thermocouple, Heat Treatment, Pyrometry, Temperature Measurement and Control, AMS2750, CQI-9

Read the English version of the article below, or find the Spanish translation when you click the flag above right!

This Technical Tuesday article, first published in English and Spanish translations, is found in Heat Treat Today's February's Air & Atmosphere Furnace Systems print edition.

If you have any facts of your own about thermocouples, our editors would be interested in sharing them online at www.heattreattoday.com. Email Bethany Leone at bethany@heattreattoday.com with your own trivia!


Víctor Zacarías
Managing director 
Global Thermal Solutions México

The SAE AMS2750 aerospace standard and the AIAG CQI-9, CQI-11, CQI-12, and CQI-29 automotive assessments are the universally accepted standards for temperature control in thermal processing operations. Among many things, they describe the requirements for the use and control of thermocouples used in process ovens and furnaces. In this article you will find the requirements of these regulations so that you can make a correct decision when choosing a thermocouple, and thus have a repeatable measurement that ensures a reliable process.

1. Application

Contact us with your Reader Feedback!

For the appropriate selection of a thermocouple for the control and/or recording of temperature, you must first take into account the type of process. In choosing the right thermocouple, consider some factors that could alter its performance, such as:

  • The temperature range at which it will be in use
  • The type of atmosphere to which it will be exposed
  • Possible electrical interference
  • The accuracy required by the applicable specification, etc.

Based on the above, existing regulations refer to a specific classification for thermocouples based on their manufacture and final application. These classifications are:
a) Base thermocouples and noble thermocouples
b) Expendable and non-expendable thermocouples

2. Types of Thermocouples and Their Insulation

2.1 Base Thermocouple or Noble Thermocouple

A base thermocouple is made of basic alloys such as iron, chrome, nickel, copper, etc., and they are the most common types in the industry due to their versatility and cost. Base thermocouples are types K, E, J, N, and T. A good supplier of sensors will recommend a thermocouple based on the application, the temperature range, and your budget (see Table 1).


Table 1: Temperature range and application of most common thermocouples
Source: GTS México

On the other hand, a noble thermocouple is made from metals such as platinum and rhodium: types R, S, and B thermocouples. These thermocouples are more stable at high temperatures and maintain their accuracy for a longer time. However, they have the highest cost since they are made from precious metals. Due to this nature, noble thermocouples are the preferred choice for vacuum heat treatment applications and high temperature processes.

2.2 Expendable or Non-expendable Thermocouples

The second criteria from the regulations are the material which protects the elements of the thermocouple.

Expendable thermocouples are those whose elements are covered by materials such as fiberglass, ceramic fabric, or polymeric coating and are generally provided in the form of a spool. This form allows the user to cut the cable to size and manufacture the thermocouple by joining the two wires by twisting or welding, making them ideal for single use applications such as a TUS test or charging thermocouples, for example (see Figure 1).

Figure 1: TUS using type K expendable thermocouple insulated in ceramic fiber
Source: Trucal, Inc.

In contrast, a nonexpendable thermocouple is normally protected with ceramic or mineral insulation and covered on the outside by a metallic sheath (the elements are not exposed in this configuration), which gives it a longer useful life. Therefore, it is preferred for use as a control or recording thermocouple (see Figure 2).

Figure 2: Non-expendable type N and K mineral insulated thermocouples
Source: GTS México

Whatever the application, when wiring interconnections are required for sensor installation, these connections must be made using standard connectors and terminals such as those shown in Figure 3, as both AMS2750 and CQI-9 prohibit the wiring splice.

Figure 3: Standard type K connectors
Source: GTS México

3. Calibration

According to regulations, all thermocouples used in the heat treatment operation must have been calibrated before being used for the first time. The user of the thermocouple must ensure that they have calibrations traceable to a national laboratory such as the NIST in the United States or its equivalent in Mexico (CENAM).

Pyrometry standards defi ne the acceptable error ranges for thermocouples depending on their final application. These categories for final application include: standard thermocouples, test thermocouples (SAT and TUS), control and recording thermocouples, and load thermocouples (see Table 2). Table 2 describes the maximum errors allowed to be selected depending on the use of the sensor.

Table 2: Accuracy required for temperature sensors according to AMS2750 and CQI-9
Source: GTS México

Once the thermocouple is installed, the person responsible for the heat treatment operation must document the date on which it comes into service, since the regulations establish the life of a sensor based on its application.

When receiving the report/certificate of the thermocouple, the user must review the content of the document, since the standards specifically define the minimum information that shall appear in a calibration report, which includes but is not limited to:

1. Test readings
2. Actual readings
3. Correction factors
4. Data source
5. Laboratory accreditation
6. Calibration method used

The calibration certificate can cover individual thermocouples or a group of thermocouples manufactured from the same lot (spool).

It is very important to note that both AMS2750 and CQI-9 require all calibrations to be conducted by ISO/IEC 17025 accredited organizations, so ensure that you review the accreditation certificate before selecting your supplier.

4. In Summary

If you’ve ever bought the wrong thermocouple, you know how annoying it can be. Therefore, here is a quick guide to select the right sensor for your application in five easy steps:

1. Define the type of thermocouple: base (K, T, J, E, N, and M) or noble (S, R, and B)
2. Define the type of insulation you require: textile fiber, polymer, ceramic, metallic, etc.
3. Specify the exact temperature range in which the sensor will operate
4. Specify the use of the sensor: standard thermocouple, SAT/TUS thermocouple, control/load thermocouple
5. Request the calibration certificate in accordance with the applicable regulations (AMS2750 or CQI-9)


References

ASTM International. ASTM E230, Standard Specification for Temperature-Electromotive Force (emf) Tables for Standardized Thermocouples, Rev. 2017.

Automotive Industry Action Group. CQI-9 Special Process: Heat Treat System Assessment, 4th Edition. June 2020.

International Organization for Standardization. ISO/IEC 17025, General Requirements for the Competence of Testing and Calibration Laboratories, 3rd Edition. 2017.

Nadcap AC7102/8 Audit Criteria for Pyrometry, Rev. A, 2021

SAE Aerospace. Aerospace Material Specifi cation AMS2750: Pyrometry, Rev. G, 2022.


About the Author: Víctor Zacarías is a metallurgical engineer from the University of Queretaro with studies in Strategic Management from Tec de Monterrey. With over 15 years of experience in Heat Treatment Management, he is currently the managing director of Global Thermal Solutions México. He has conducted numerous courses, workshops, and assessments in México, the United States, Brazil, Argentina, and Costa Rica. He has been a member of the AIAG Heat Treat Work Group (CQI-9 committee) and the SAE Aerospace Materials Engineering Committee.

Contact Víctor at victor@globalthermalsolutions.com


Find heat treating products and services when you search on Heat Treat Buyers Guide.com


How To Choose the Right Thermocouple in Heat Treatment Read More »

Skip to content