

By validating CFD simulation results with thermocouple data, Ford Motor Company is now using virtual tools to study aluminum cylinder head quenching process and gains valuable information for process design and optimization. James Jan and Madhusudhan Nannapuraju presented a study titled “CFD Investigation of Quench Media and Orientation Effects on Structural Stress Induced in the Intense Quenching Processes for Aluminum Cylinder Heads” at Heat Treat 2017 as part of the proceedings of the 29th ASM Heat Treating Society Conference, October 24–26, 2017, Columbus, Ohio, USA. (Copyright © 2017 ASM International® All rights reserved.)
This article is a synopsis of the study, which can be read in its entirety here: “CFD Investigation of Quench Media and Orientation Effects on Structural Stress Induced in the Intense Quenching Processes for Aluminum Cylinder Heads”
Heat treatment is a common manufacturing process to produce high-performance components. Although heat treatment incorporating a quenching process can produce parts with durable mechanical properties, an unwanted effect of intense quenching is the induced thermal residual stress, which often is a leading cause for quality issues associated with high cycle fatigues. During the product development cycle, it is not uncommon to switch between air and water quenching and change quench orientation in order to minimize residual stress. However, the choice of quench media and quench orientation is often determined by intuitive engineering judgment at best and trial-and-error iterative method at worst.
In recent years, digital verification using finite element analysis (FEA) is gaining popularity because of its efficiency. The computational method to predict the residual stress involves two calculations. The first step is to calculate the temperature history; then the temperature data is used as thermal-load-to-structure analysis for stress and deformation calculation.
A popular method for temperature calculation is the heat transfer coefficient (HTC) method, however, the biggest drawback of HTC method is that the method relies on thermocouple measurement for calibration and the calibrated HTC may not be applicable to different design and quenching process. With the advancement in computation fluid dynamics CFD technologies, the temperature history in quenching now can be accurately calculated. Since thermal residual stress is directly linked to non-uniform temperature distribution in the metal, spatial temperature gradient is evaluated to study the performance of different quench media and configuration.

Air Quench Process for Cylinder Heads
The main heat extraction mechanism in air quenching is forced convection. In our CFD model, it is assumed that the buoyancy effect and radiation heat transfer have a negligible impact on the accuracy. The CFD simulation results are compared with thermocouple readings, and the overlapping curves illustrate an excellent agreement and validate our model.
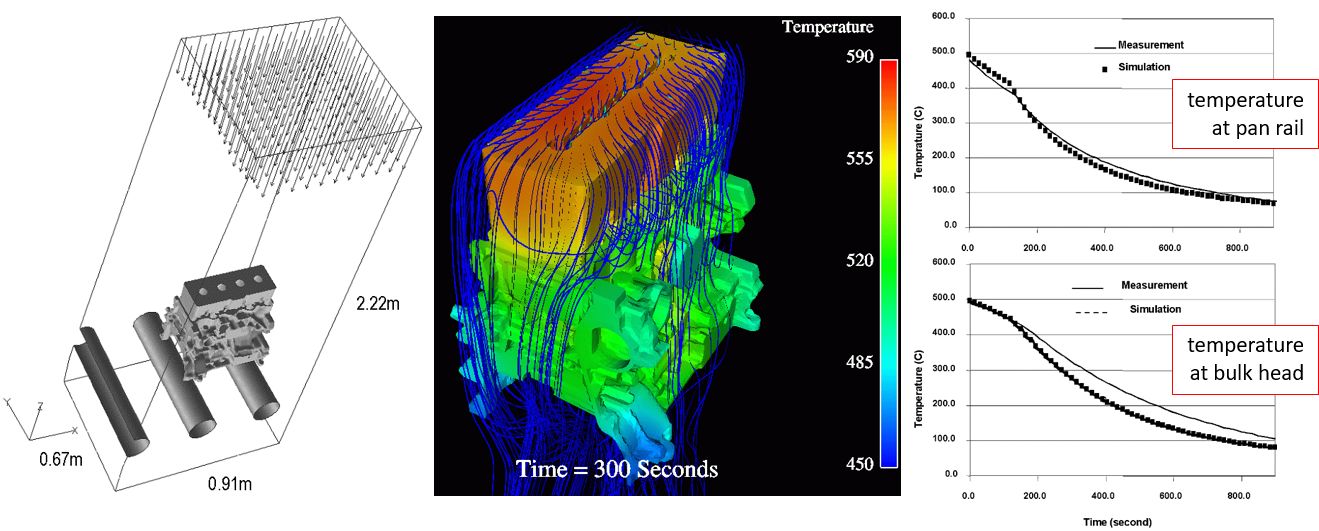
We use CFD to study and compare four different air quenching configurations. One unique advantage of CFD simulation over physical testing is its capability to visualize flow patterns and to identify low heat transfer regions under stagnant air pockets. The quenching configuration (a), (b) and (c) represent a conveyer style quenching environment, (d) represents a basket style quenching environment. See Figure 3.

The cooling curve plot shows that the cylinder head quenched in a basket (d) cools faster compared to those quenched on a conveyer (a), (b), and (c). According to the temperature gradients plot, basket quenching (d) cools faster at a higher temperature gradient than conveyer quenching (a) and (c). The only exception is (b). In-depth investigation of the location of high-temperature gradient indicates that the regions between the water jacket and intake port are susceptible to high residual stress.


Water Quench Process for Cylinder Heads
The physics of water quenching is much more involved than air quenching. Ford Motor Company adapted the quench model framework by AVL FIRE™, which is based on the Eulerian-Eulerian multiphase model, and developed our own proprietary database to simulate the water boiling process. Extensive work has been done on computation and experiments to validate the numerical methods. The CFD simulations compared to lab experiment on cooling curves provide strong evidence that our CFD model is accurate and that it can predict temperature profile on every quenching orientation without calibration.

Six different quench orientations are studied, and the vapor patterns and vapor pockets are plotted for in-depth investigation. The cooling curve and temperature gradient plot illustrate that orientation has little impact on overall cooling characteristics, and maximum temperature gradient is similar except that they occur at different time, even though the vapor pattern and locations of vapor pockets are drastically different in each quenching orientations.
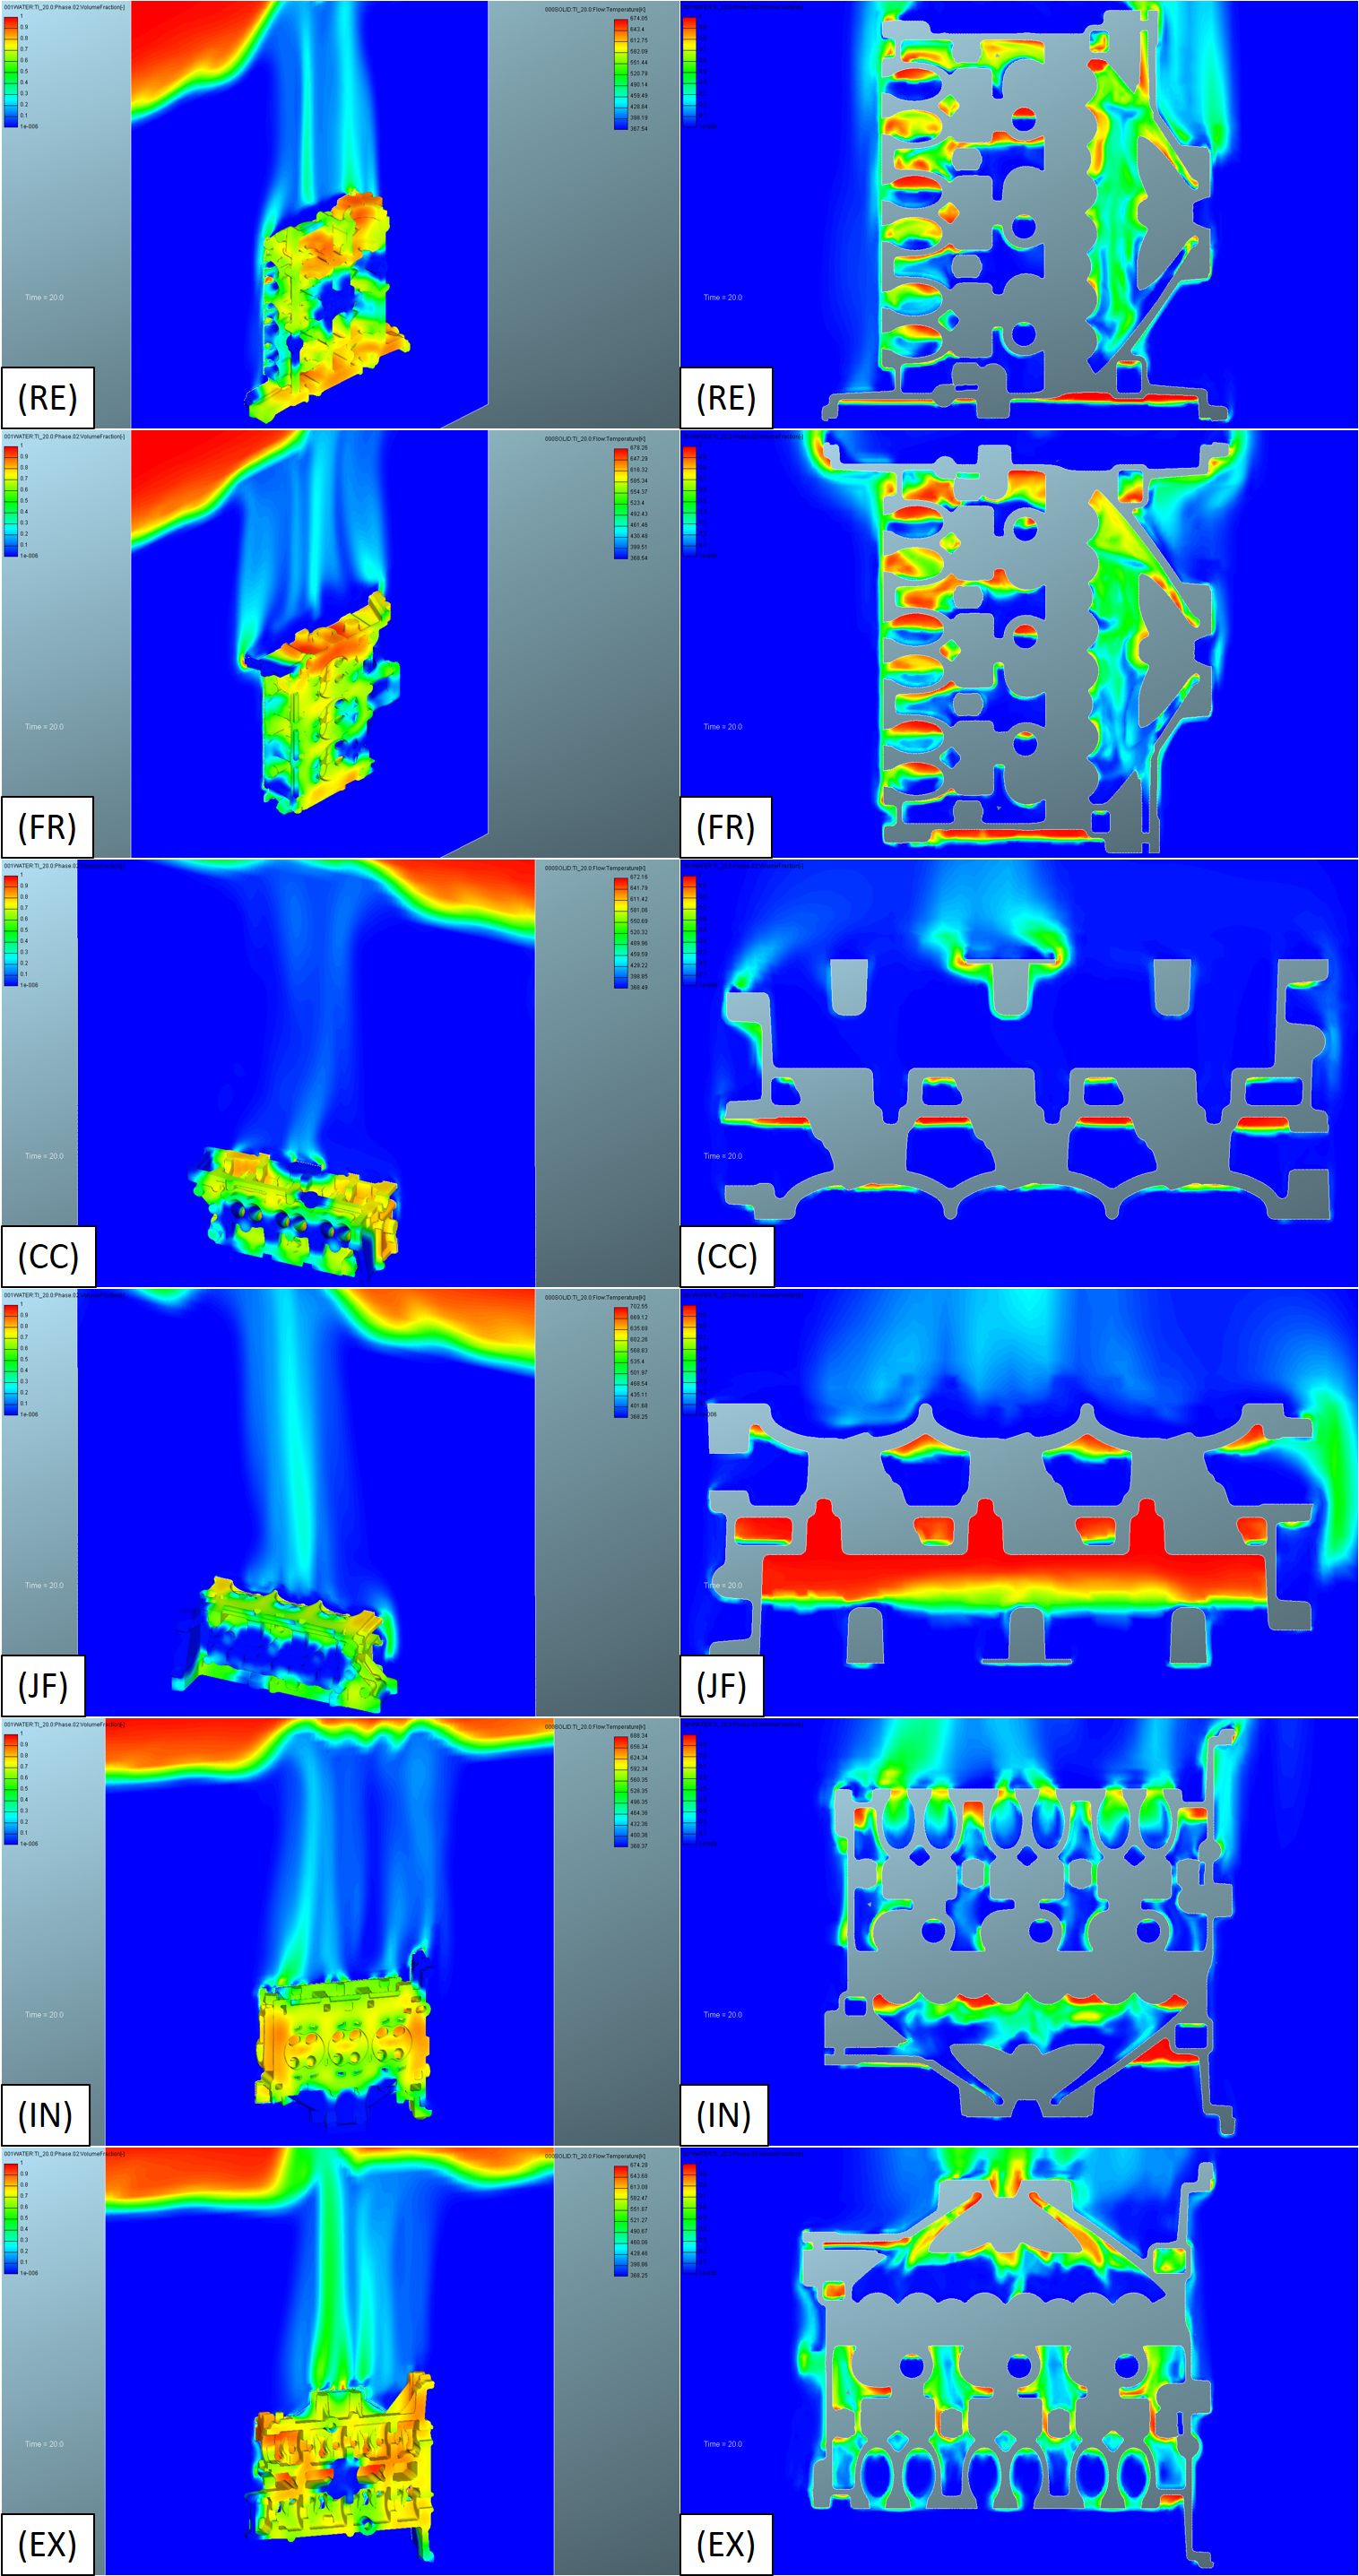

Observing the location of the high-temperature gradient, for rear face up (RE) and cam cover face up (CC) quenching, high-temperature gradient appears in the intake port area, similar to the air quenching cases. Since the high-temperature gradient is observed near the intake port for all quenching cases, both air quenching and water quenching, very likely it is a design-related issue.

Comparison of Air and Water Quenching Process
The underlying heat extraction for air and water quenching is very different. While air quenching relies on convection heat transfer to cool the metal, water quenching relies on water to vapor phase change to take the heat away. Therefore, metal cools significantly faster in water quenching than in air quenching. The maximum temperature gradient for water quenching is also much larger than air quenching. Since water only vaporizes in areas in contact with a hot surface, the heat loss is a local phenomenon subject to vapor escape route and the supply of fresh water. In other words, the heat transfer may not be as smooth as air quenching and it is reflected in the fluctuation of high-temperature gradient plot.
A much higher temperature gradient in water quenching does not necessarily generate much higher residual stress. We can also see in the plot that the duration of peak temperature gradient only lasts about 15 seconds. In this duration, the metal may exceed yielding stress and plastic deformation starts. However, the final deformation also depends on how long the state of stress stays in plastic deformation zone.

Conclusions
The rapid, large temperature drop in the quenching process has two opposite effects on the eventual outcome. On one hand, the large cooling rate produces metals with better quality, but it also induces residual stress. Thanks to the advancement of 3D CFD methodology, now the metal cooling in the quenching process can be much better understood using computer simulations. By using validated air and water quench modeling method, we compared the cooling curves and temperature gradient to evaluate quenching performance for various quenching configurations.
For air quenching processes, the study finds that cylinder heads cool faster in basket quenching than in conveyer quenching environment. The explanation is that airflow is accelerated when passing through the narrow gaps between cylinder heads in basket quenching. For water quenching processes, the study finds the orientation has little effect on the overall cooling rate as well as maximum temperature gradient except for a time shift in the maximum gradient. The results also show that the temperature gradient in water quenching is significantly larger than air quenching but last a much shorter period of time. Studying the temperature gradient for all air and water quenching case reveals a weak spot between the intake port and water jacket. Since this spot appears in all quenching cases, it should be remedied by a design change rather than changing the manufacturing process alone.
References
- Koc, M., Culp, J., Altan, T. “Prediction of Residual Stresses in Quenched Aluminum Blocks and Their Reduction through Cold Working Processes,” Journal of materials processing technology, 174.1 (2006), pp342-354.
- Wang, D.M., Alajbegovic, A., Su, X.M., Jan, J., “Numerical Modelling of Quench Cooling Using Eulerian Two-Fluid Method”, Proceedings of IMECE 2002, ASME-33499 Heat Transfer, vol. 3, 2003, pp. 179-185. LA, USA.
- Srinivasan, V., Moon, K., Greif, D., Wang, D.M., Kim, M., “Numerical Simulation of Immersion Quench Cooling Process”: Part I, Proceedings in the International Mechanical Engineering Congress and Exposition, IMECE2008, Paper no: IMECE2008-69280, Boston, Massachusetts, USA, 2008.
- Srinivasan, V., Moon, K., Greif, D., Wang, D.M., Kim, M., “Numerical Simulation of Immersion Quench Cooling Process”: Part II, Proceedings in the International Mechanical Engineering Congress and Exposition, IMECE2008, Paper no: IMECE2008-69281, Boston, Massachusetts, USA, 2008.
- Kopun, R., Škerget, L., Hriberšek, M., Zhang, D., Stauder, B., Greif, D., “Numerical simulation of immersion quenching process for cast aluminium part at different pool temperatures”, Applied Thermal Engineering 65, pp. 74-84, 2014
- Jan, J., Prabhu, E., Lasecki, J., Weiss, U, “Development and Validation of CFD Methodology to Simulate Water Quenching Process,” Proceedings of the ASME 2014 International Manufacturing Science and Engineering Conference, Detroit Michigan, 2014.
Photo credit for all images: Ford Motor Company; cited in “CFD Investigation of Quench Media and Orientation Effects on Structural Stress Induced in the Intense Quenching Processes for Aluminum Cylinder Heads”, Heat Treat 2017: Proceedings of the 29th ASM Heat Treating Society Conference October 24–26, 2017, Columbus, Ohio, USA.