


HARDNESS TESTERS TECHNICAL CONTENT

Decarburized Layer in Steel: Understanding, Evaluation, and Control

Hardness results that fall below specification are not always caused by heat treatment errors. In this Technical Tuesday installment, Ana Laura Hernández, founder of Consultoría Carnegie, examines how decarburization develops, how it affects hardness and surface properties, and the practical methods heat treaters can use to evaluate, control, and prevent it through metallurgical analysis and process discipline.

This informative piece was first released in Heat Treat Today’s July 2026 Annual Super Brands Issue print edition.

If you have any comments or queries, on this article, let us know at editor@heattreattoday.com.

Para leer el artículo en español, haga clic aquí.


Introduction: When Results Do Not Match Theory

In heat treatment operations, hardness results outside of specification are often attributed to deviations in process parameters, operational errors, or variations in the chemical composition of the material. However, there are cases where the root cause is related to metallurgical phenomena that directly affect the surface of the material.

A representative case involved a batch of ten forged components weighing more than 5 tons each, manufactured from AISI 4340 steel. The applied heat treatment process was known and previously validated: normalizing, quenching, followed by tempering in a range of 600–610°C (1112–1130°F), with the objective of meeting the required mechanical properties. After completing the heat treatment, the inspection team reported hardness values approximately 20–30 HB below specification. This result was unexpected, considering that AISI 4340 steel, due to its alloying elements, maintains relatively high hardness values even at relatively high tempering temperatures. A hardness reevaluation was requested, increasing the surface preparation depth up to 5 mm. However, the hardness values only increased slightly (~5 HB), without reaching the required levels.

Under pressure due to delivery timelines, it was decided to reprocess the components. The complete heat treatment cycle was applied again, adjusting the tempering temperature to 580°C (1076°F), which, from a metallurgical standpoint, should increase hardness. Nevertheless, the results remained practically unchanged. The chemical composition was verified using PMI, confirming that the material was indeed AISI 4340 steel. Additionally, the evaluation piece “Qualification Test Coupon” (QTC) indicated high hardness values, consistent with the expected behavior of the material.

Given the inconsistency between experimental results, metallurgical fundamentals, and prior experience, a deeper analysis of the process history was conducted, correlating variables from each stage of processing. This is where the key to a proper failure analysis lies: thoroughly understanding the history of the component.

It was identified that, prior to heat treatment, the components had remained inside a furnace within a temperature range of 800–900°C (1472–1652°F) for approximately three days, due to delays in the rolling process caused by maintenance issues. As a result of prolonged exposure and poor communication between shift operators, the components remained inside the furnace at “lower temperatures” while waiting to complete the final rolling step. Although not at rolling temperatures, this prolonged exposure in a non-controlled atmosphere promoted decarburization of the material.

To validate this hypothesis, a longitudinal cut was performed on one of the components, and hardness measurements were carried out in the core. The results confirmed that the material exhibited significantly higher values in the interior, revealing a decarburized surface layer. This case demonstrates the importance of: Analyzing the full material and process history before concluding a non-conformance.

What Is Decarburization?
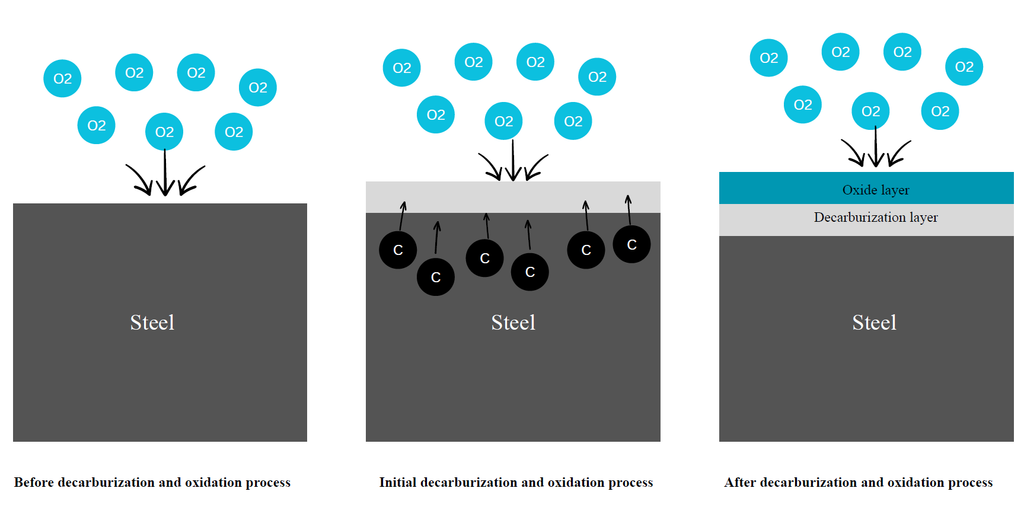
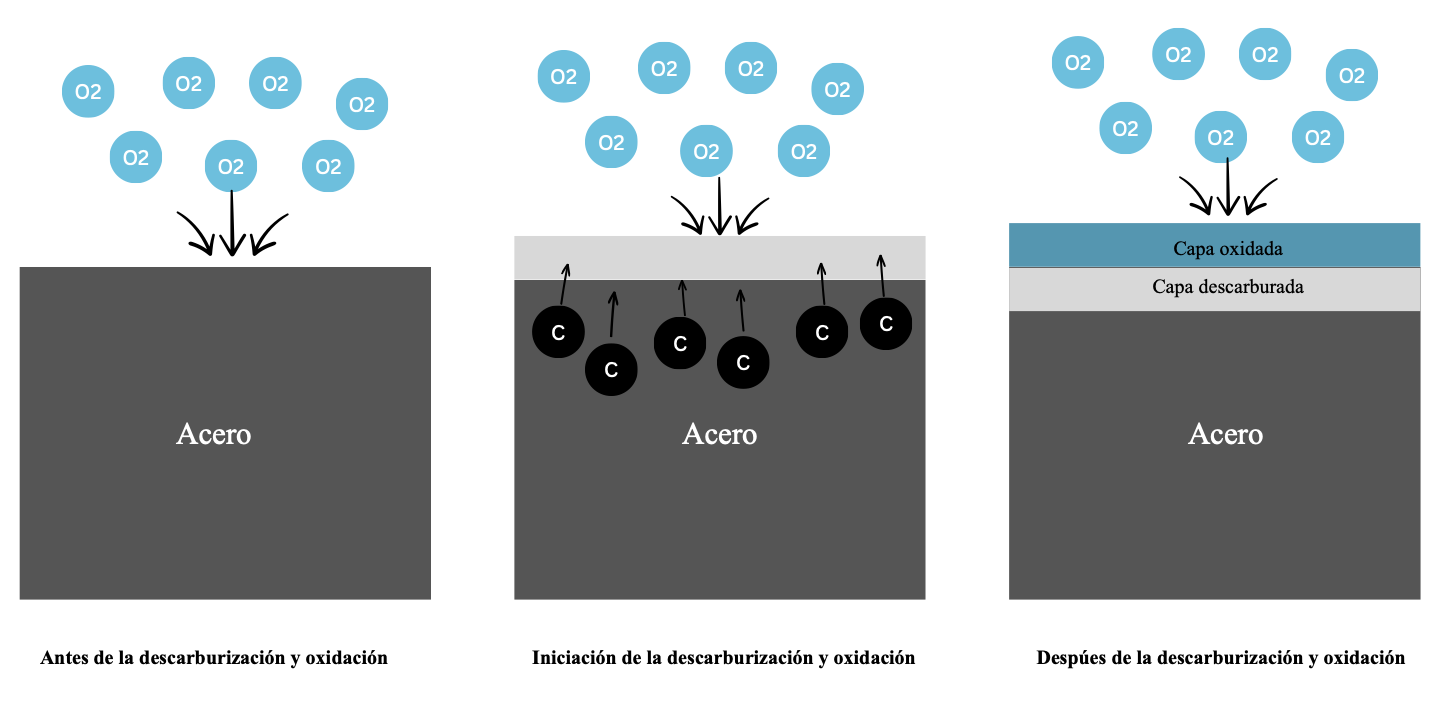
Figure 1. Representative schematic of the decarburization and oxidation process. | Image credit: Consultoría Carnegie

Steel is a solid solution based on iron and carbon, where mechanical properties depend directly on the carbon content and the alloying elements present. Decarburization is a metallurgical phenomenon consisting of the loss of carbon from the surface of steel when it is exposed to high temperatures in atmospheres with oxidizing potential or low carbon potential (Figure 1). This phenomenon commonly occurs during forging, hot rolling, normalizing, annealing, and heat treatment in conventional furnaces without atmosphere control.

From a thermodynamic perspective, decarburization occurs when the chemical potential of carbon in the steel is higher than that of the surrounding environment, which drives carbon diffusion toward the surface. In the presence of oxidizing gases, carbon reacts to form gaseous species:
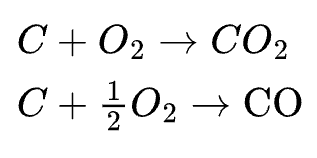
It can also react with water vapor or carbon dioxide, accelerating the process. As a result, a carbon gradient is generated (surface vs. core), the microstructure is altered, and mechanical properties are degraded, especially at the surface.

Oxidation and Its Relationship with Decarburization

Decarburization is closely related to oxidation processes. Oxidation occurs when oxygen reacts with the metal, forming oxides on the surface. This process depends on the thermodynamic equilibrium between the partial pressures of the gases present, which can be analyzed using diagrams such as the Ellingham-Richardson.

An increase in temperature accelerates both oxidation and decarburization, which is why the use of controlled atmosphere furnaces is essential to prevent these phenomena.

Process Kinetics: Carbon Diffusion

Decarburization is a diffusion-controlled process. When steel is at high temperatures, atoms gain higher mobility and carbon diffuses from regions of high concentration (core) to regions of lower concentration (surface). This process intensifies when the material is fully in the austenitic phase (above Ac₃), where carbon diffusivity is significantly higher.

The depth of the decarburized layer depends on temperature, exposure time, steel composition and furnace atmosphere conditions. This phenomenon is critical because the reduction of carbon content at the surface directly affects wear resistance and fatigue performance of the material.

Methods for Determining Decarburized Layer and Oxides

Prediction of Oxides Using Computational Tools

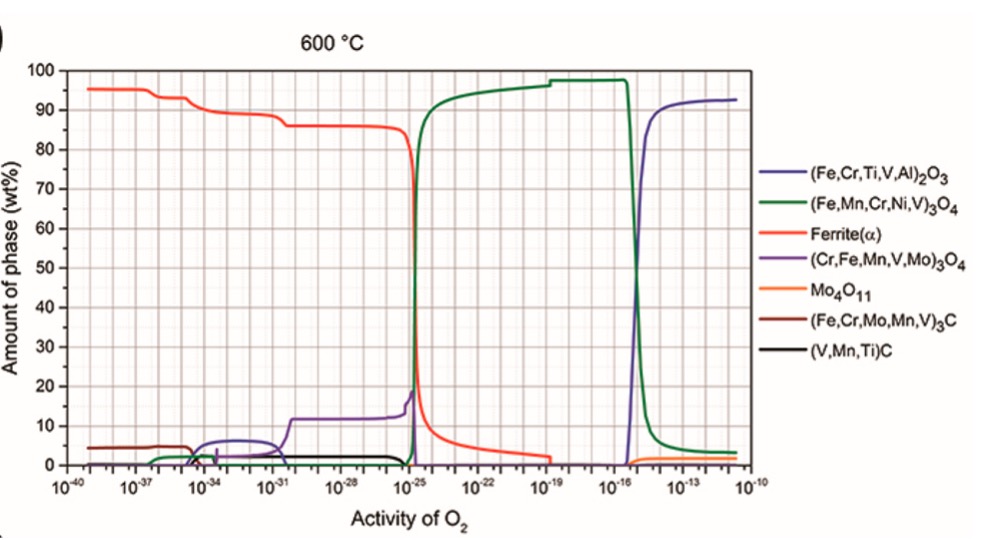
The use of tools like Thermo-Calc software allows the prediction of stable phases as a function of temperature and oxygen partial pressure. These diagrams enable identification of which oxides will form at the surface, evaluation of whether these oxides act as a barrier or facilitate carbon loss, and optimization of heat treatment conditions.
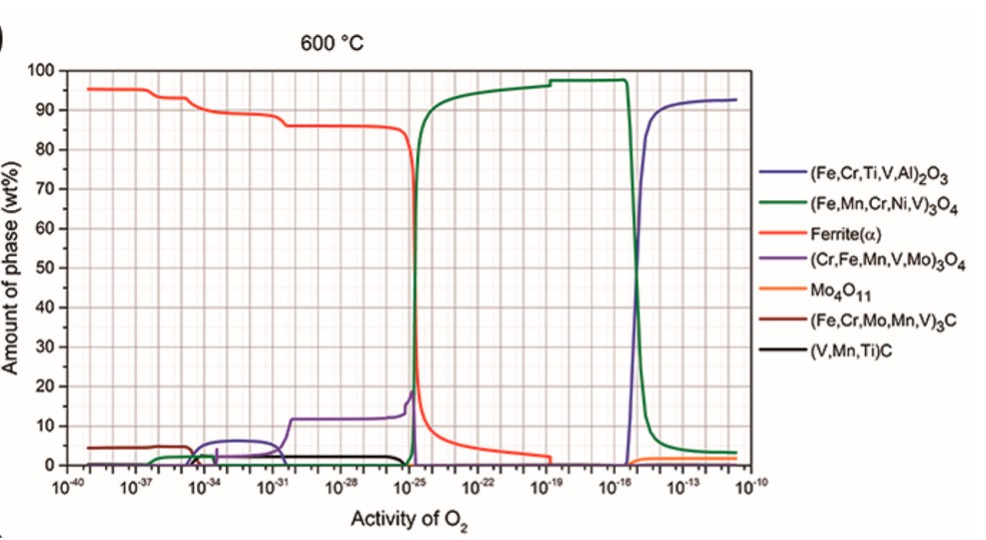
Figure 2. Thermodynamically stable phases formed during high-temperature oxidation as a function of oxygen activity for H11 steel at 600°C (1112°F) (Balaško, et al. 2021)

For example, in steels such as H11, phase stability diagrams allow visualization of how oxide formation varies as a function of temperature and oxygen activity (Figure 2). Understanding these relationships is key to preventing decarburization, designing controlled atmospheres, and avoiding undesirable mechanical property outcomes.

Determination of Decarburized Layer Depth

The ASTM E1077 standard establishes different methods to evaluate the depth of the decarburized layer, including microscopic methods, microhardness, and chemical analysis. These methods determine whether a component meets specifications and define the proper preparation required for hardness measurement. The following sections present an example of the use of these methods. The objective of this analysis was to determine the depth of this layer to generate internal instructions for proper sample preparation through grinding, ensuring accurate hardness measurements.

Experimental Methodology
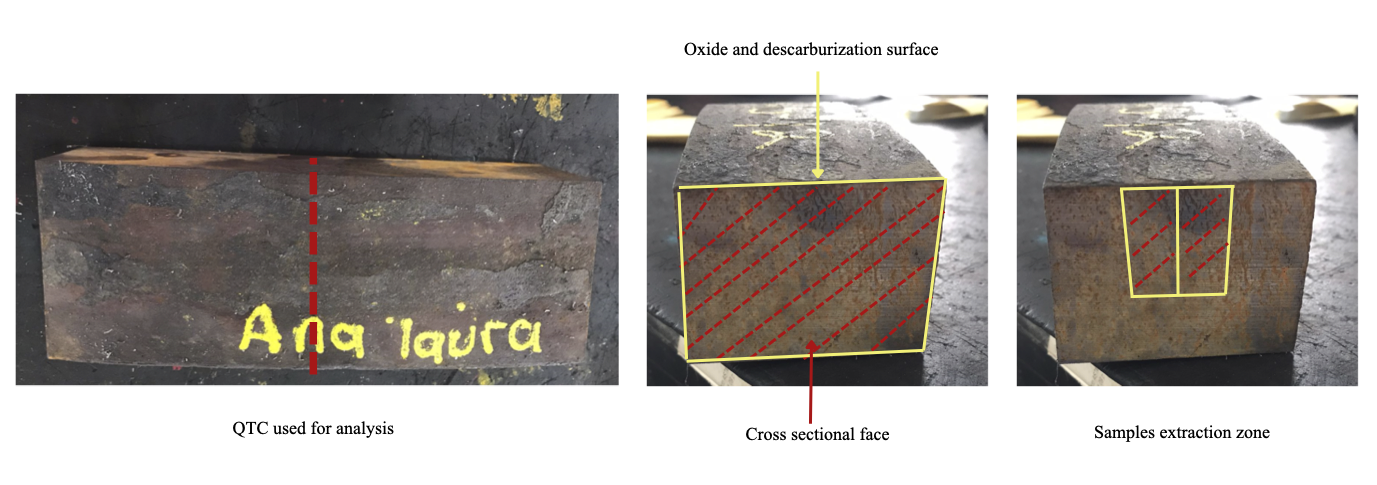
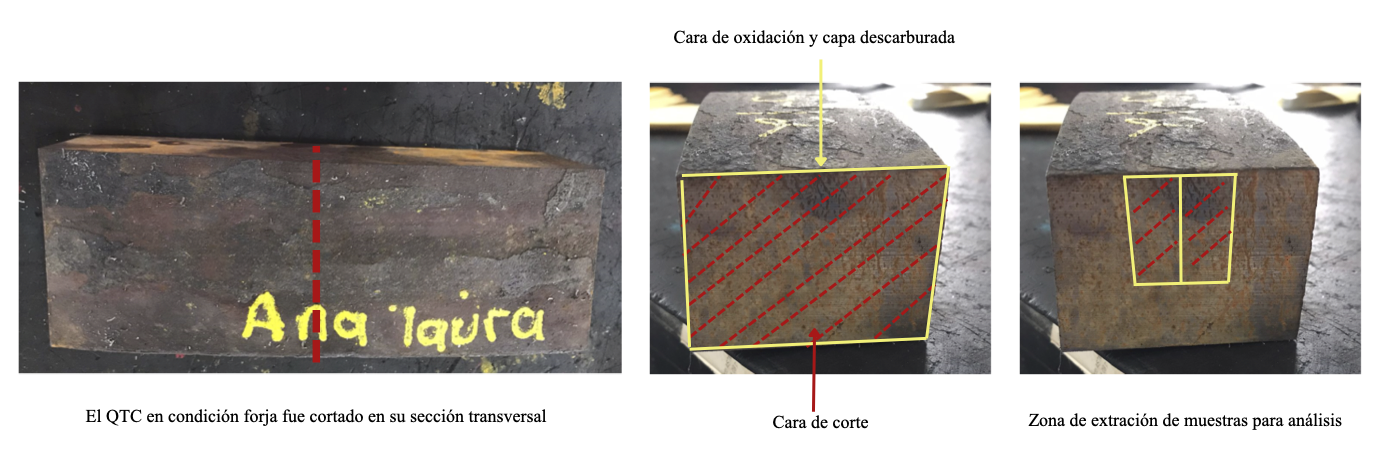
Figure 3. QTC preparation for sample extraction. | Image credit: Consultoría Carnegie

A QTC sample of AISI 4340 steel in forged condition was selected and subjected to normalizing, quenching, and tempering. Samples were obtained through cross-sectional cutting to perform hardness testing, optical microscopy, and carbon chemical analysis (by LECO, Figure 3).

Results

Hardness Profile

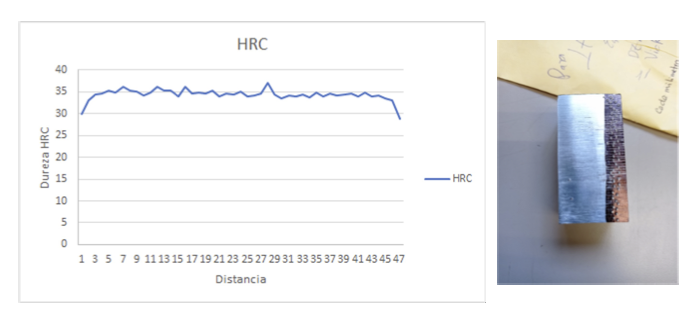
Measurements were taken at 1 mm intervals from the surface toward the interior. The results showed 0–3 mm low hardness values (~30 HRC) and an increase up to 35–36 HRC at 5 mm, remaining constant (Figure 4). This indicates that the surface region does not represent the actual properties of the material.
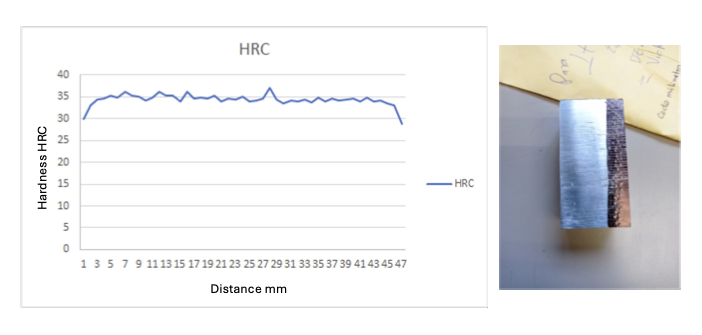
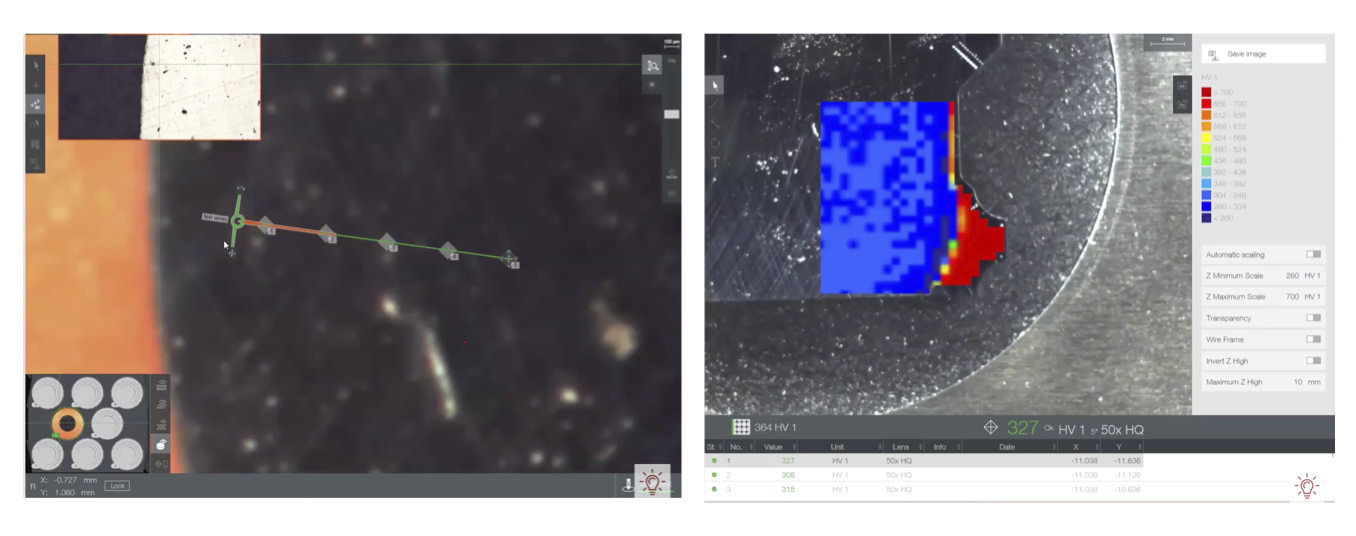
Figure 4. a) Hardness profile results, b) sample used for hardness profile analysis. | Image credit: Consultoría Carnegie
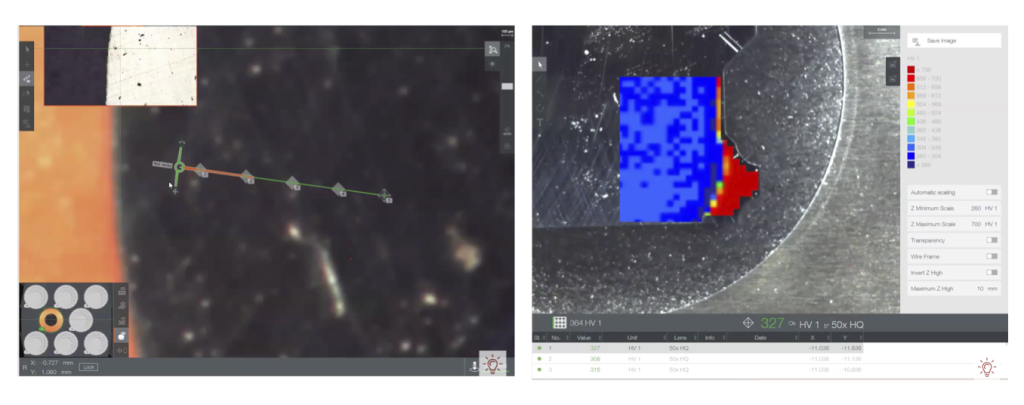
Figure 5. a) Hardness evaluation zones every 1 mm, b) hardness results shown as a color map (blue represents the softer surface region and red represents the harder region at 5 mm depth). | Image credit: Consultoría Carnegie and Mikra QATM

One of the challenges in this method is the precision of hardness indentations. It can be observed in Figure 4b that a fine marker was used to define the measurement zones; however, nowadays the use of advanced equipment allows automated programming of measurement locations (Figure 5).

Chemical Analysis (LECO)
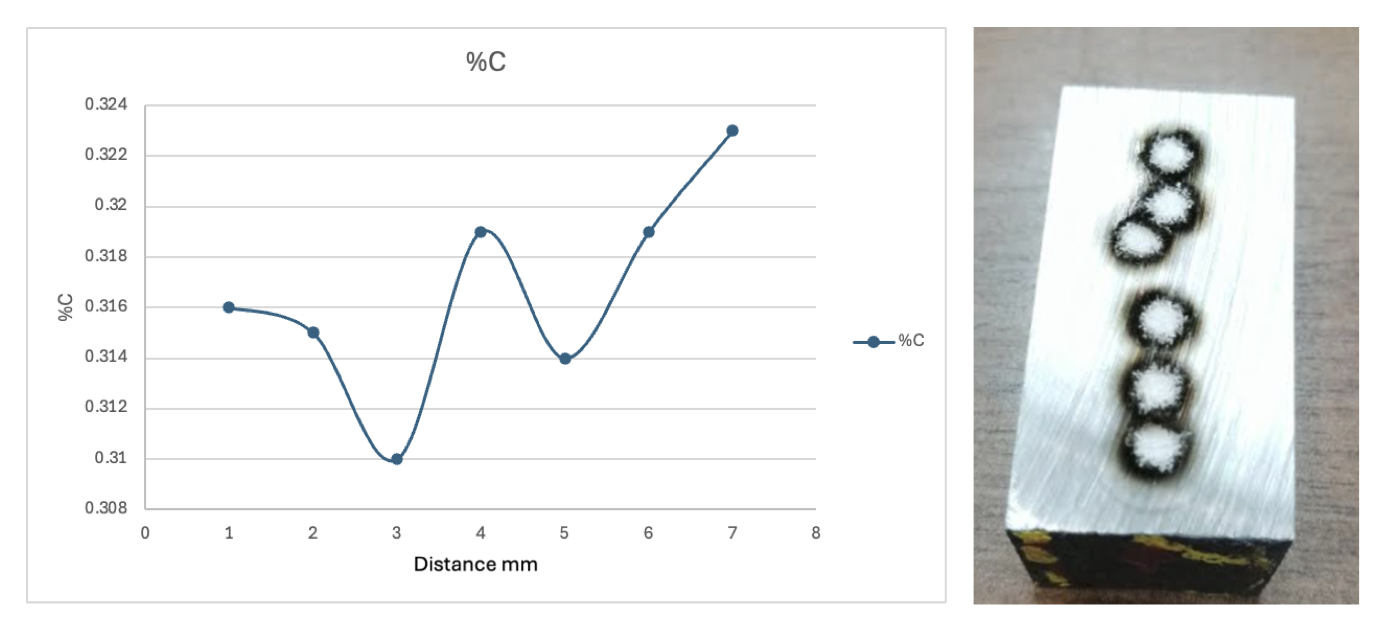
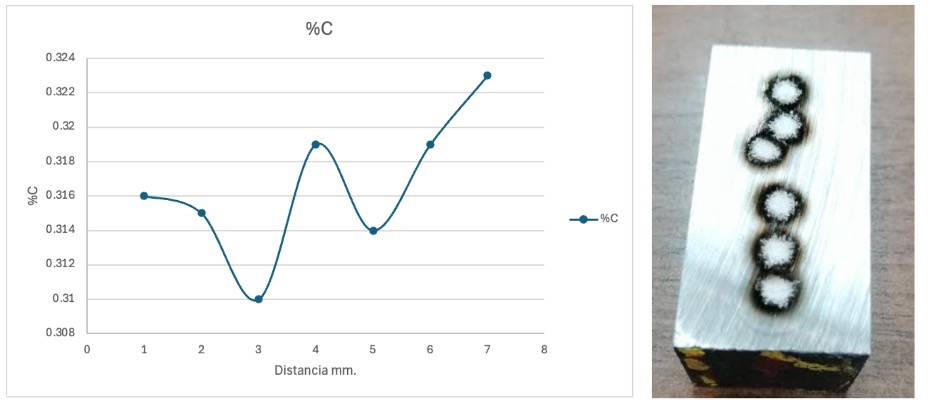
Figure 6. a) Carbon analysis results using a LECO system, b) sample used for carbon analysis. | Image credit: Consultoría Carnegie

The LECO analysis showed an increase in carbon percentage starting at approximately 5 mm depth, confirming the presence of a decarburized layer (Figure 6).

Optical Microscopy
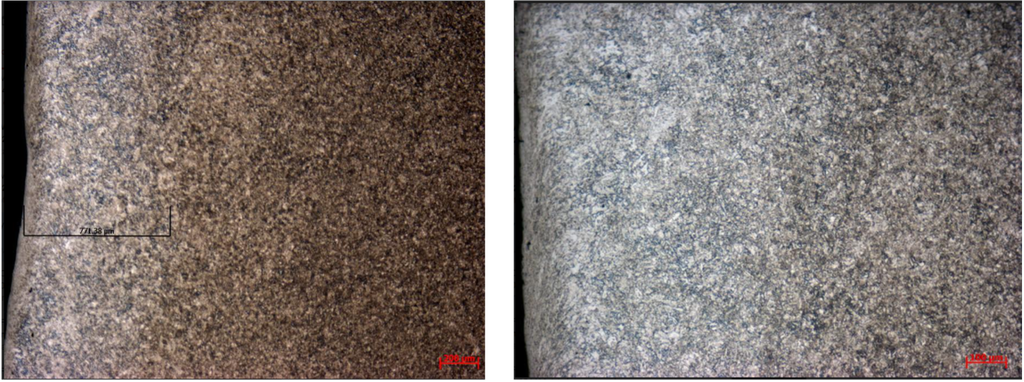
Figure 7. Results of decarburized layer analysis using optical microscopy. | Image credit: Consultoría Carnegie

The optical microscopy analysis allowed observing microstructural changes between the surface and the core associated with carbon loss (Figure 7).

Practical Application: Shop Floor Control
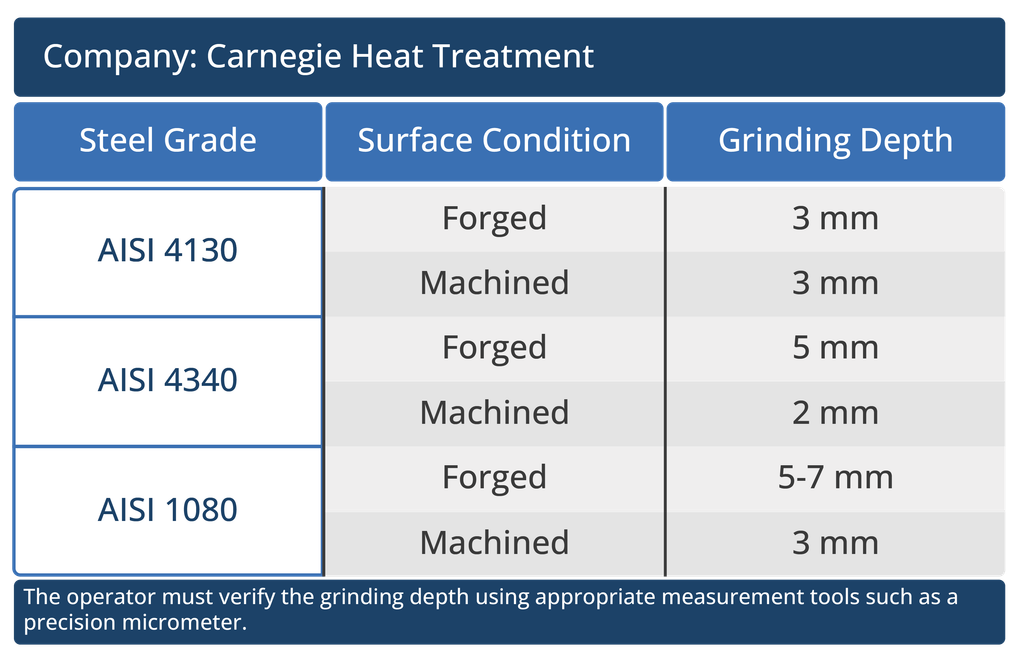
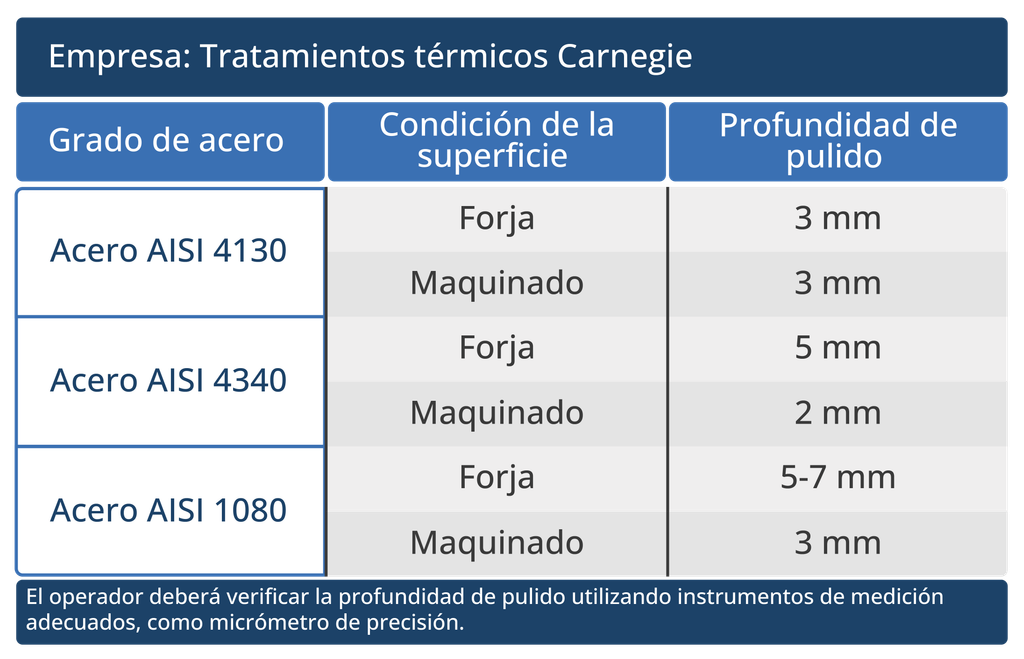
Table A. Work Instruction in the Hardness Testing Area

Based on the results, work instructions were established to ensure reliable hardness measurements (Table A).

Operational Implementation

It is essential to involve operational personnel in understanding these phenomena, explaining why proper surface preparation is critical, how it impacts hardness measurement, and how this helps prevent rework. Additionally, it must be considered whether the dimensions of the components allow such preparation. Otherwise, it is necessary to communicate possible deviations or limitations to the client.

This analysis should be conducted for different steel grades, as well as at different temperatures and processing times, in order to estimate the effect on decarburization depth. This will facilitate the implementation of preventive actions for the operational team, instructing them to avoid overheating the parts or exposing them in the furnace for prolonged periods.

Conclusion

It is highly recommended that heat treatment companies conduct this type of metallurgical study, since it allows a deeper understanding of the real behavior of their processes. As previously mentioned, the depth of the decarburized layer is influenced by multiple variables, which may impact each company differently depending on factors such as steel type, furnace type, and processing time, among others.

Based on the results, it is possible to establish clear guidelines for operators, specifically regarding the depth at which samples must be prepared or ground to ensure that hardness values reported to the client are accurate and representative. Likewise, these analyses can be extended to different steel grades, allowing the development of specific work instructions indicating the required grinding depth depending on the material and processing conditions.

Decarburization is a critical phenomenon in heat treatment processes that can lead to incorrect interpretation of hardness results. A comprehensive analysis combining metallurgical fundamentals, standard methodologies, computational tools, and process history allows avoiding unnecessary rejection, improving process control, and ensuring final product quality.

References

Balaško, T., Vončina, M., Burja, J., Šetina Batič, B., & Medved, J. 2021. High-Temperature Oxidation Behaviour of AISI H11 Tool Steel. Metals, 11(5), 758. https://doi.org/10.3390/met11050758.

Herring, Daniel H. 2014. Atmosphere Heat Treatment: Atmospheres, Quenching, Testing. Vol. 2. Troy, MI: BNP Media.

Juan Hou, Fen-Fen Han, Xiang-Xi Ye, Bin Leng, Min Liu, Yan-Ling Lu, Xing-Tai Zhou. 2019. Effect of Surface Decarburization on Corrosion Behavior of GH3535 Alloy in Molten Fluoride Salts[J]. Acta Metallurgica Sinica (English Letters). 32(3): 401-412. https://doi.org/10.1007/s40195-018-0814-5.

Krauss, George. 2015. Steels: Processing, Structure, and Performance. 2nd ed. Materials Park, OH: ASM International.

About The Author:

Ana Laura Hernández Sustaita
Founder
Consultoría Carnegie

Ana Laura Hernández Sustaita holds a Master’s degree in Materials Science and engineering. She is the founder of Consultoría Carnegie, a technical consulting and training firm specializing in steel heat treatment in Mexico. Additionally, she works as a technical support engineer at Thermo-Calc Software, providing assistance to clients across México, Canada, and United States of America. Ana actively promotes metallurgical education throughout Latin America and advocates for the integration of computational tools into industrial heat treatment practice.

For more information: Contact Ana Hernández at anahdz@consultoriacarnegie.com.

Decarburized Layer in Steel: Understanding, Evaluation, and Control Read More »

Capa descarburada en aceros: comprensión, evaluación y control

Los resultados de dureza inferiores a las especificaciones no siempre se deben a errores en el tratamiento térmico. En esta entrega de Technical Tuesday, Ana Laura Hernández Sustaita, fundadora de Consultoría Carnegie, analiza cómo se desarrolla la descarburización, cómo afecta a la dureza y a las propiedades superficiales, y los métodos prácticos que los técnicos de tratamiento térmico pueden utilizar para evaluarla, controlarla y prevenirla mediante análisis metalúrgicos y una estricta disciplina en el proceso.

Este artículo informativo se publicó por primera vez en Heat Treat Today’s July 2026 Annual Super Brands Issue print edition.

Si tiene comentarios o preguntas sobre este artículo, háganoslo saber en: editor@heattreattoday.com.

To read this article in English, click here.


Introducción: cuando los resultados no coinciden con la teoría

En operaciones de tratamiento térmico, los resultados de dureza fuera de especificación suelen atribuirse a desviaciones en los parámetros del proceso, errores operativos o variaciones en la composición química del material. Sin embargo, existen casos donde la causa raíz está relacionada con fenómenos metalúrgicos que afectan directamente la superficie del material.

Un caso representativo involucró una carga de diez piezas forjadas de más de 5 toneladas cada una, fabricadas en acero AISI 4340. El proceso térmico aplicado era conocido y previamente validado: normalizado, temple seguido de revenido en un rango de 600-610°C (1112–1130°F), con el objetivo de cumplir con las propiedades mecánicas requeridas por el cliente. Tras finalizar el tratamiento térmico, el equipo de inspección reportó valores de dureza de las piezas aproximadamente 20-30 HB por debajo de la especificación. Este resultado fue inesperado, considerando que el acero 4340, debido a su contenido de elementos aleantes, mantiene valores elevados de dureza incluso a temperaturas relativamente altas de revenido. Se solicitó una reevaluación de dureza, incrementando la profundidad de preparación de la superficie hasta 5 mm. Sin embargo, los valores de dureza únicamente aumentaron ligeramente (~5 HB), sin alcanzar los niveles requeridos.

Ante la presión por los tiempos de entrega, se decidió reprocesar las piezas. Se aplicó nuevamente el ciclo completo de tratamiento térmico, ajustando la temperatura de revenido a 580°C (1076°F), lo cual, desde el punto de vista metalúrgico, debería incrementar la dureza. No obstante, los resultados permanecieron prácticamente sin cambios. Se procedió a verificar la composición química mediante PMI, confirmando que el material correspondía efectivamente a un acero 4340. Adicionalmente, la pieza de evaluación “Qualification Test Cupon” (QTC) indicaba valores de dureza elevados, consistentes con el comportamiento esperado del material.

Ante la inconsistencia entre resultados experimentales, fundamentos metalúrgicos y la previa experiencia personal, se decidió profundizar en el análisis del historial del proceso y correlacionar las variables de cada uno de los procesos. Y aquí es donde se encuentra la clave de un buen análisis de fallas, el detallar el historial de la pieza con la que se está trabajando.

Se identificó que, previo al tratamiento térmico, las piezas habían permanecido dentro de un horno en un rango de 800-900°C (1472–1652°F) durante aproximadamente tres días, debido al retraso que el equipo de mantenimiento tenía en la máquina de rolado, debido a esto y a una falta de comunicación entre los operadores de turno, la pieza continuaba en espera en el horno de calentamiento a “baja temperaturas” para concluir su último paso. Aunque no fue a temperaturas de rolado, esta exposición prolongada en una atmósfera no controlada promovió la descarburización del material.

Para validar esta hipótesis, se realizó un corte longitudinal en una de las piezas y se llevaron a cabo mediciones de dureza en el núcleo. Los resultados confirmaron que el material presentaba valores significativamente mayores en el interior, evidenciando una capa superficial descarburada. Este caso demuestra la importancia de: Analizar integralmente la historia del material y del proceso antes de concluir con una no conformidad.

¿Qué es la descarburización?

Figura 1. Esquema representativo del proceso de descarburización y oxidación. | Referencia: Consultoría Carnegie

El acero es una solución sólida basada en hierro y carbono, donde las propiedades mecánicas dependen directamente del contenido de carbono y los elementos aleantes presentes. La descarburización es un fenómeno metalúrgico que consiste en la pérdida de carbono desde la superficie del acero cuando este es expuesto a altas temperaturas en atmósferas con potencial oxidante o bajo potencial de carbono (Figura 1). Este fenómeno ocurre comúnmente durante: forja, laminación en caliente, normalizado, recocido y tratamientos térmicos en hornos convencionales sin control de atmósfera.

Desde el punto de vista termodinámico, la descarburización ocurre cuando el potencial químico del carbono en el acero es mayor que el del ambiente circundante, lo que impulsa la difusión del carbono hacia la superficie. En presencia de gases oxidantes, el carbono reacciona formando especies gaseosas:

También puede reaccionar con vapor de agua o dióxido de carbono, lo que acelera el proceso. Como consecuencia: se genera un gradiente de carbono (superficie vs núcleo), se altera la microestructura, se degradan propiedades mecánicas, especialmente en la superficie.

Oxidación y su relación con la descarburización

La descarburización está estrechamente relacionada con los procesos de oxidación. La oxidación ocurre cuando el oxígeno reacciona con el metal formando óxidos en la superficie. Este proceso depende del equilibrio termodinámico entre las presiones parciales de los gases presentes, lo cual puede analizarse mediante diagramas como el de Ellingham-Richardson.

El incremento de la temperatura acelera tanto la oxidación como la descarburización, por lo que el uso de hornos con atmósfera controlada es fundamental para prevenir estos fenómenos.

Cinética del proceso: difusión del carbono

La descarburización es un proceso gobernado por difusión. Cuando el acero se encuentra a altas temperaturas los átomos adquieren mayor movilidad y el carbono difunde desde regiones de alta concentración (interior) hacia regiones de menor concentración (superficie). Este proceso se intensifica cuando el material se encuentra completamente en fase austenítica (por encima de Ac3), donde la difusividad del carbono es significativamente mayor.

La profundidad de la capa descarburada depende de: temperatura, tiempo de exposición, composición del acero y condiciones de la atmósfera del horno. Este fenómeno es crítico, ya que la reducción del contenido de carbono en la superficie afecta directamente la resistencia al desgaste y fatiga del material.

Métodos para la determinación de la capa descarburada y óxidos

Predicción de óxidos mediante herramientas computacionales

El uso de herramientas como Thermo-Calc software, permite predecir las fases estables en función de la temperatura y la presión parcial del oxígeno. Estos diagramas permiten identificar que óxidos se formarán en la superficie, evaluar si los óxidos actúan como barrera o facilitan la salida del carbono y optimizar las condiciones del proceso térmico.

Figura 2. Fases termodinámicamente estables formadas durante la oxidación a alta temperatura (600°C [1112°F]) en función de la actividad del oxígeno para el acero H11 (Balaško, et al. 2021)

Por ejemplo, en aceros como H11, los diagramas de estabilidad de fases permiten visualizar cómo varían los óxidos formados en función de la temperatura y la actividad de oxígeno (Figura 2). Comprender estas relaciones es clave para prevenir la descarburización, diseñar atmósferas controladas y evitar resultados no deseados en propiedades mecánicas.

Determinación de la profundidad de capa descarburada

La norma ASTM E1077 establece diferentes métodos para evaluar la profundidad de la capa descarburada, incluyendo: métodos microscópicos, microdureza y análisis químico. Estos métodos permiten determinar si una pieza cumple con las especificaciones y definir la preparación adecuada para medición de dureza. A continuación, se muestra un ejemplo del uso de los métodos. El objetivo de este análisis fue determinar la profundidad de esta capa para generar instrucciones internas para la preparación adecuada mediante del pulido de las piezas para la medición correcta de dureza.

Metodología experimental

Figura 3. Preparación de QTC para extracción de muestras para análisis. | Referencia: Consultoría Carnegie

Se seleccionó un QTC de acero AISI 4340 en condición forja, sometido a un ciclo de normalizado, temple y revenido. Las muestras se obtuvieron de un corte transversal para realizar el análisis de dureza, microscopía óptica y análisis químico de carbono (LECO, Figura 3).

Resultados

Perfil de dureza

Se realizaron mediciones a intervalos de 1 mm desde la superficie hacia el interior. Los resultados mostraron: 0–3mm valores bajos de dureza (~30 HRC), a 5 mm: incremento hasta 35–36 HRC, manteniéndose constante (Figura 4). Esto indica que la zona superficial no representa las propiedades reales del material.

Figura 4. a) Resultados de análisis de perfil de dureza, b) muestra utilizada para el análisis de perfil de dureza. | Referencia: Consultoría Carnegie
Figura 5. a) Zonas para evaluación de dureza a cada 1 mm b) resultados de dureza en mapa de color (en azul la zona más suave es la superficie y en rojo la zona más dura a 5 mm de profundidad). | Referencia: Consultoría Carnegie and Mikra QATM

Uno de los retos en este método es la precisión de las huellas de dureza, se puede observar como la muestra Figura 4b, se usó un marcador fino para determinar las zonas a medir, sin embargo, hoy en día el uso de equipos sofisticados nos permite realizar una programación automática de las zonas a evaluar (Figura 5).

Análisis químico (LECO)

Figura 6. a) Resultados de análisis de %C en un equipo LECO, b) muestra utilizada para análisis de %C. | Referencia: Consultoría Carnegie

El análisis mostró un incremento en el porcentaje de carbono a partir de aproximadamente 5 mm de profundidad, confirmando la existencia de una capa descarburada (Figura 6).

Microscopía óptica

Figura 7. Resultados de análisis de capa descarburada mediante microscopía óptica. | Referencia: Consultoría Carnegie

Este análisis permitió observar cambios microestructurales entre la superficie y el núcleo, asociados a la pérdida de carbono (Figura 7).

Aplicación práctica: control en planta

Tabla A. Instrucción de trabajo en área de pruebas de Dureza

Con base en los resultados, se establecieron instrucciones de trabajo para asegurar mediciones confiables de dureza (Tabla A).

Implementación operativa

Es fundamental involucrar al personal operativo en la comprensión de estos fenómenos, explicando por qué es crítico el pulido adecuado, cómo impacta en la medición de dureza y cómo esto evitará retrabajos. Así mismo, se debe considerar si las dimensiones de las piezas permiten dicha preparación. En caso contrario es necesario comunicar al cliente posibles desviaciones o limitaciones en la medición.

Se recomienda llevar a cabo este análisis para los diferentes grados de aceros, temperaturas y tiempos de procesamiento, que ayude a estimar el efecto sobre la profundidad de capa descarburizada y con esto implementar acciones preventivas al equipo operativo sobre evitar un sobrecalentamiento o someter las piezas a periodos prolongados de tiempo en un horno.

Conclusión

Es altamente recomendable que las empresas dedicadas al tratamiento térmico lleven a cabo este tipo de estudios metalúrgicos, ya que estos permiten comprender con mayor profundidad el comportamiento real de sus procesos. Como se mencionó previamente, la profundidad de la capa descarburada está influenciada por múltiples variables, las cuales pueden impactar de manera distinta en cada empresa, dependiendo de factores como el tipo de acero, el tipo de horno utilizado, los tiempos de tratamiento entre otros.

A partir de los resultados obtenidos, es posible establecer lineamientos claros para los operadores, específicamente en relación con la profundidad a la que deben preparar o pulir las muestras, con el objetivo de asegurar que los valores de dureza reportados al cliente sean representativos y correctos. Así mismo estos análisis pueden desarrollarse para distintos grados de acero, permitiendo la generación de fichas o instrucciones de trabajo específicas para cada caso donde se indique de manera precisa la profundidad de pulido requerida en función del material y las condiciones de proceso.

La descarburización es un fenómeno crítico en procesos de tratamiento térmico que puede llevar a interpretaciones incorrectas de los resultados de dureza. El análisis integral que combine: Fundamentos metalúrgicos, normativas estándar, herramientas computacionales, historial del proceso, permite: evitar rechazos innecesarios, mejorar el control del proceso y asegurar la calidad del producto final.

Referencias

Balaško, T., Vončina, M., Burja, J., Šetina Batič, B., & Medved, J. 2021. High-Temperature Oxidation Behaviour of AISI H11 Tool Steel. Metals, 11(5), 758. https://doi.org/10.3390/met11050758.

Herring, Daniel H. 2014. Atmosphere Heat Treatment: Atmospheres, Quenching, Testing. Vol. 2. Troy, MI: BNP Media.

Juan Hou, Fen-Fen Han, Xiang-Xi Ye, Bin Leng, Min Liu, Yan-Ling Lu, Xing-Tai Zhou. 2019. Effect of Surface Decarburization on Corrosion Behavior of GH3535 Alloy in Molten Fluoride Salts[J]. Acta Metallurgica Sinica (English Letters). 32(3): 401-412. https://doi.org/10.1007/s40195-018-0814-5.

Krauss, George. 2015. Steels: Processing, Structure, and Performance. 2nd ed. Materials Park, OH: ASM International.

Acerca de la autora:

Ana Laura Hernández Sustaita
Fundadora
Consultoría Carnegie

Ana Laura Hernández Sustaita cuenta con Maestría en Ciencia e Ingeniería de los Materiales, Es fundadora de Consultoría Carnegie, una firma de consultoría y capacitación técnica especializada en el tratamiento térmico de aceros en México. Asimismo, se desempeña como Ingeniera de Soporte Técnico en Thermo-Calc Software, brindando asistencia a clientes en México, Canada y Estados Unidos de América. Ana promueve activamente la educación metalúrgica en Latinoamérica y fomenta la integración de herramientas computacionales en la práctica industrial del tratamiento térmico.

Para más información: Contacte con Ana Hernández en anahdz@consultoriacarnegie.com.

Capa descarburada en aceros: comprensión, evaluación y control Read More »
The Jominy and Rapid Quench, Part 1: An American Story

In this two-part series, Dr. Gopal Nadkarni, an associate professor of mechanical engineering at the University of Akron, revisits the American origins and impacts of the Jominy test while exploring how rapid quenching technologies are exposing its limitations. Discover how a new approach builds on ASTM foundations to better reflect today’s high-performance cooling methods.

This informative piece was first released in Heat Treat Today’s April 2026 Annual Induction Heating & Melting print edition.


Introduction

For nearly a century, the Jominy End-Quench Test has shaped how North American engineers design alloys, specify steels, and heat treat critical components across automotive, oil and gas, heavy machinery, and aerospace industries. It involves one small piece of steel and a stream of water. Simple, repeatable, and powerful, it was revolutionary for its time. But it derived from a different world of manufacturing. Furnaces were batch loaded. Parts required hand transfer. Quenching utilized tanks with modest agitation — not high-pressure sprays, induction-to-quench lines, or high-performance water systems.

Today’s rapid quench technologies reveal a key limitation: the classic Jominy test can systematically underestimate what many steels are capable of under aggressive convective cooling. Why? Because film boiling — a vapor layer at the steel surface — chokes heat transfer right where it matters most.

In order to take advantage of a wider range of materials and processing methods, a shift in how to leverage this test is necessary. The discussion that follows elaborates on this American origin story of the Jominy’s test and what challenge the film boiling layer posed 75 years ago versus today.

Pursuing Performance: The Origins of the Jominy Test

In 1947, Fred P. Peters wrote in Scientific American that hardenability was no longer just a technical trend; it was a revolution changing how the steel industry did business. He was describing a shift in which clients wanted to move away from buying a grade based on chemistry specs alone to buying a product that would guarantee performance.

*Hardenability: the ability of a steel to harden to a certain depth. Hardness, by comparison, is the measurement of how hard a material is at a given location. High hardenability ensures desired properties and microstructure at a given depth for critical components; this leads to more efficient optimized part designs.

But there was a problem: Steelmaking was, and still is, a complex science with unavoidable variability arising from chemical, thermal, and metallurgical processes involved. From batch-to-batch, a single supplier could achieve different hardenability results. That variability caused headaches for manufacturers.

Two metallurgists working with General Motors, Walter Jominy and A.L. Boegehold, proposed an elegant solution: standardize the cooling conditions instead of chasing exact chemistry. Pinpointing the “maximum hardness at center” had been an estimate derived from submerging several steel bars of various diameters in a quench tank. Speaking to the Detroit Chapter of American Society of Metals, the metallurgists pushed for an end-quench test using a standardized one-inch round bar, heated uniformly, and quenched at one end with a water jet. Their practical solution replicated the range of cooling rates from the maximum cooling rate (water) at the quench face to the slowest cooling rate (air) at the other end of the bar. The resulting hardness profile became a “fingerprint” of that alloy’s hardenability.

That fingerprint changed everything.

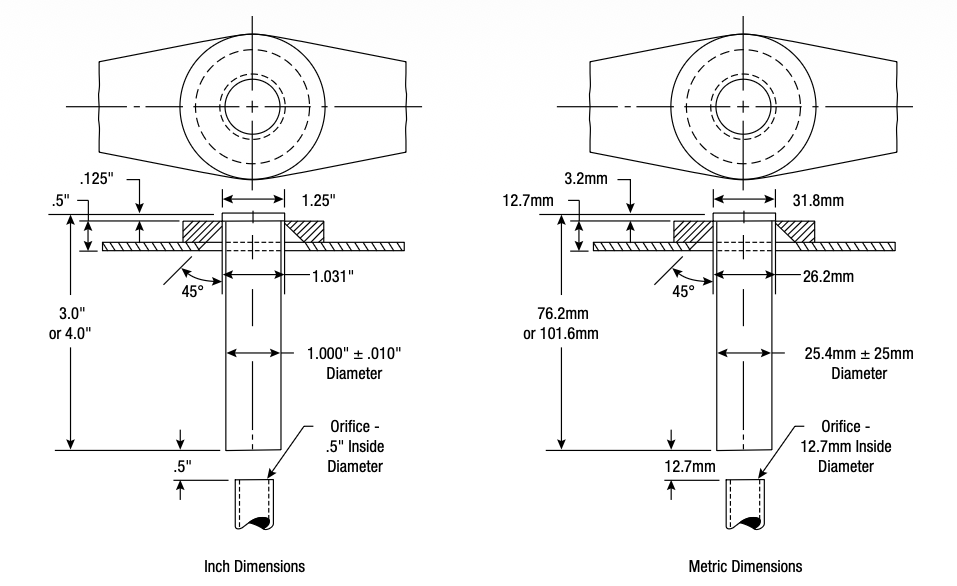
Figure 1. Diagram of the Jominy End-Quench Test | Reference: ASTM A255-02

Metallurgists could now rapidly compare alloys from different suppliers or with minor chemistry differences. Additionally, design engineers could specify hardenability bands rather than tight chemistry limits. Steelmakers could adjust compositions and quickly verify performance. Scrap heats dropped. Costs fell. Customers gained predictable, repeatable results. ASTM A255 formalized the method, and the Jominy test became the global language of hardenability (Figure 1).

Known Limitations and Rapid Quench

Heat treaters know the Jominy test is a simplification. The specimen is a straight bar, not a gear or forging. Only one end is quenched. The cooling method represents one type of quench: water, not oil, polymer, or gas.

There’s also a compositional limitation; highly alloyed steels often show little variation along the four-inch test length.

But one limitation has taken on new importance in modern heat treatment: the vapor blanket.

The Vapor Blanket Problem

When red-hot steel hits water, a vapor layer instantly forms on the surface. This “Leidenfrost layer” acts like insulation. Heat transfer drops until the vapor film collapses and nucleate boiling begins.

That means the cooling severity at the Jominy face is not just “water quench.” It is water quench through a steam barrier.

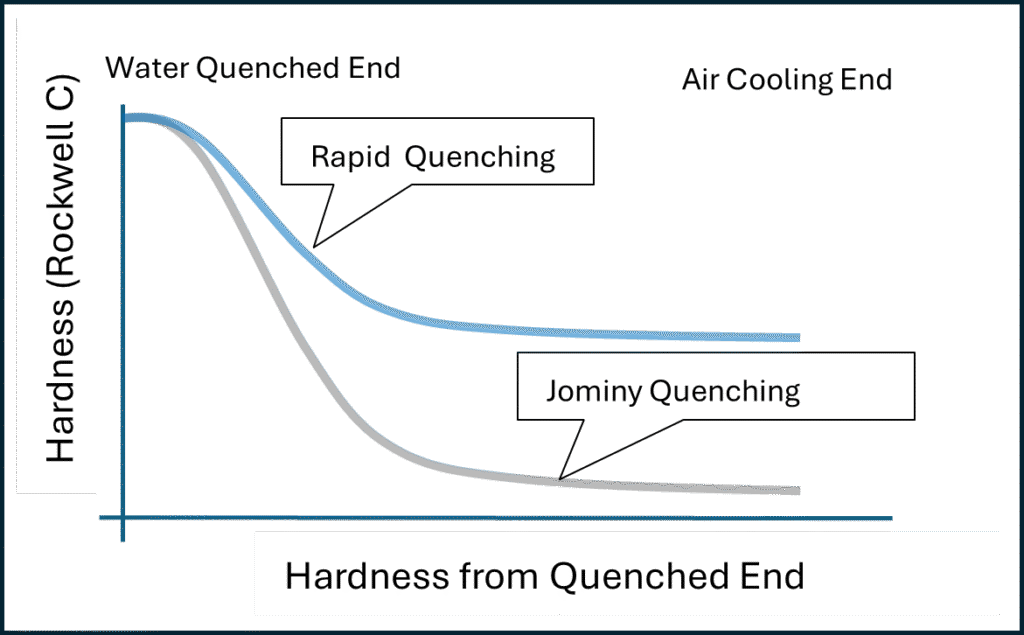
So, the hardenability curve we measure reflects steel transformation behavior plus a boiling-limited surface condition. If that vapor layer is removed or shortened, the cooling rate at the surface rises, and the steel may harden deeper than the standard Jominy curve suggests.

Heat treaters know this problem firsthand. Agitated water tanks try to break up the vapor film, but removal is inconsistent. The result can be uneven hardening — the “spotty” surfaces everyone has seen. And the usual workarounds are to add alloy, carburize deeper, or accept extra process time and cost. In other words, the industry learned to design around the vapor blanket instead of eliminating it. The “Leidenfrost Layer” describes this insulating vapor blanket phenomenon that occurs when liquid meets a hot surface significantly hotter than its boiling point.

A Different Philosophy: Rapid Quenching

Over the past two decades, a new approach has gained traction: do not accept film boiling — remove it.

Researchers, such as Dr. Kobasko and Dr. Aronov, showed through modeling and experiments that high-velocity, high-pressure water flow can consistently suppress the vapor layer, a method known as Intensive Quenching™. This approach pushes the hot surface quickly into high heat transfer by removing the vapor film and has been referred to as High Convective Quenching, High-Pressure Convective Quenching, and Rapid Quenching.

The result is more than faster cooling.

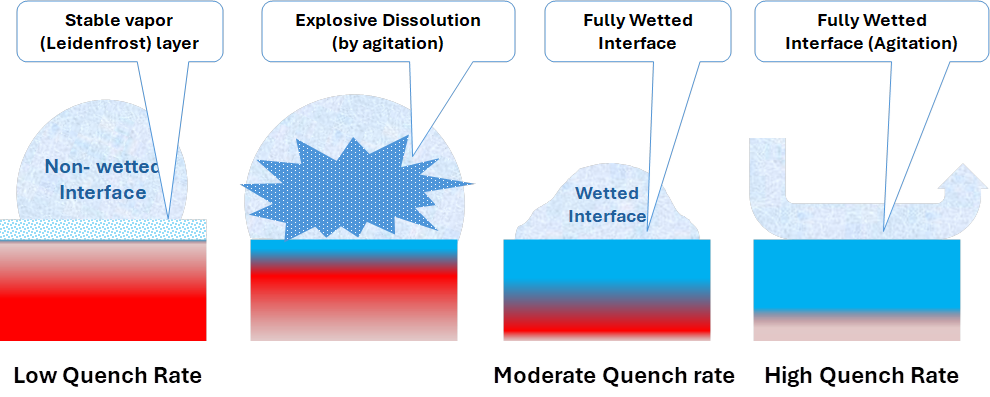
Figure 2. Quench rate and surface reactions

Early formation of a martensitic surface shell creates compressive stresses that enhance fatigue and wear resistance. Parts can show deeper effective hardening and improved surface performance without increasing alloy content (Figure 2). Some studies even suggest differences in martensite morphology (twinned morphology) compared to conventional quenching (lath morphology). This is not just “harder steel.” It is a different thermal-mechanical response at the surface.

Rethinking the Jominy Test

If quenching technology has changed, should the hardenability test evolve too?

Research at the University of Akron has shown that the standard Jominy setup itself forms a vapor layer. Raising the jet height does not eliminate it. That means the test measures hardenability under a boiling-limited condition, not under maximum achievable heat transfer.

Figure 3. Standard vs. Rapid Quench Hardenability | Image Credit: Gopal Nadkarni

Working with industry partners, the university researchers developed a modified end-quench configuration that uses high-convective water impingement to strip the vapor barrier. The measurement philosophy remains Jominy-based i.e. measure hardness along the length of the bar. What changes is that the end of the flat bar is given a slight taper to allow it tightly seal into a chamber where a water jet is sprayed on the surface, much like a jet pressure washer. Modeling this scenario allows us to predict that the new pressure and flow conditions are sufficient to strip the vapor and keep it from reforming, thus creating conditions of maximum heat transfer without the continuous formation of the film. The old “umbrella” method of cooling does not ensure the removal of the vapor or film on surface. The result is a new method that reveals how steels behave under rapid quench — conditions increasingly used in advanced heat treat operations (Figure 3).

Why This Matters to Industry Now

For 75 years, engineers have relied on handbooks filled with Jominy curve diagrams. Those curves remain valuable, but they reflect a quenching severity rooted in mid-20th-century practice.

Today, heat treaters, steelmakers, and designers have a chance to expand that framework. A rapid-quench Jominy approach could help:

  • Optimize alloy design for modern quench systems
  • Improve simulation accuracy in digital twins
  • Reduce over-alloying and cost
  • Increase part performance and consistency

This is not about redefining hardenability. It is about recognizing that hardenability is expressed under a defined cooling boundary. As quenching technology advances, our standardized ways of describing steel response should advance with it.

In Part 2, we’ll look at how this modified Jominy approach aligns with ASTM philosophy, what simulation reveals, and how rapid quenching translates into real improvements for gears, heavy components, and other critical parts.

About The Author:

Dr. Gopal Nadkarni
Associate Professor of Mechanical Engineering
University of Akron

Dr. Gopal Nadkarni is an Associate Professor of Mechanical Engineering at the University of Akron and manages its Manufacturing Graduate Certificate Program. He brings extensive industry and innovation experience, having held previous leadership roles at industry and in technology ventures, with research and teaching focused on manufacturing, materials, and product design.

To contribute to ongoing industry-academia research regarding this topic, please contact Professor Gopal Nadkarni.

For more information: Contact Gopal Nadkarni at gnadkarni1@uakron.edu.

The Jominy and Rapid Quench, Part 1: An American Story Read More »
Tech Round Up: Helpful, Readable, and Applicable Content

On just about any given Tuesday, Heat Treat Today features an article that aims to educate our heat treating readers — be it in a process, equipment, metals, analysis, critical parts, or more. On this Thursday, enjoy this sampling of Technical Tuesday articles from the past several months. 


Case Study: Heat Treat Equipment Meets the Future Industry Today 

How has one heat treat furnace supplier contended with modern challenges of manufacturing? In this case study about a shift away from traditional forms of heat treat, explore how vacuum furnace technology has more technological horizons to bound. 

Figure 1. Construction and schematic furnace cross-section CMe-T6810-25 

Several key features discussed are the various challenges that characterize modern industry; the differences between historical heat treat furnaces and vacuum furnaces; furnace features that can meet these obstacles; and a close look at what one equipment option from SECO/WARWICK can offer. Additionally, explore the case study of a process that resulted in the following assessment: All technological requirements have been met, obtaining the following indicators of efficiency and consumption of energy factors calculated for the entire load and per unit net weight of the load (700 kg).” 

Read the entire article at “Case Study: Heat Treat Equipment Meets the Future Industry Today”

How Things Work: Thermocouples 

How do thermocouples work? How would you tell if you had a bad one? Those ever-present temperature monitors are fairly straightforward to use, but when it comes to how it works — and why — things get complicated.  

Figure 2. Eric Yeager of Cleveland Electric Laboratories explaining the 101 of all things thermocouple

This transcript Q&A article was published in a print edition, but there was too much information to fit the pages. Click below to read the full-length interview, including the final conversation about how dissimilar metals create electromotive force (EMF). Included in the discussion is proper care of T/C and guidance on when it’s time to replace. 

Read the entire article at “How Things Work: Thermocouples”

A Quick Guide to Alloys and Their Medical Applications 

Figure 3. Sneak peak of this medical alloys resource 

If you’re pining for a medical heat treat quick resource in our “off-season,” we have a resource for you. Whether you are a seasoned heat treater of medical application parts or not, you know that the alloy composition of the part will greatly determine the type of heat treat application that is suitable. Before you expand your heat treat capabilities of medical devices, check out this graphic to quickly pin-point what alloys are in high-demand within the medical industry and what end-product they relate to. 

The alloys addressed in this graphic are titanium, cobalt chromium, niobium, nitinol, copper, and tantalum.  

Check out the full resource at “A Quick Guide to Alloys and Their Medical Applications”

Resource — Forging, Quenching, and Integrated Heat Treat: DFIQ Final Report 

How much time and energy does it take to bring parts through forging and heat treatment? Have you ever tried integrating these heat intensive processes? If part design, forging method, and heat treat quenching solutions are considered together, some amazing results can occur. Check out the report findings when Direct from Forge Intensive Quenching (DFIQTM) was studied. 

Figure 4. Examples of DFIQ equipment

Forgings were tested, in three different locations, to see if immediate quenching after forging made a difference in a variety of steel samples. The report shares, “The following material mechanical properties were evaluated: tensile strength, yield strength, elongation, reduction in area, and impact strength. Data obtained on the mechanical properties of DFIQ forgings were compared to that of forgings after applying a conventional post-forging heat treating process.” 

Read the entire article “Forging, Quenching, and Integrated Heat Treat: DFIQ Final Report”

3 Top Tips for Brinell and Rockwell Hardness Tests 

Figure 5. Testing hardness 

Accurate hardness testing is a critical business for numerous industries, not least heat treatment. In this guide, evaluate “best practice” for getting the best possible reading for your hardness test with the most efficiency. These comprehensive tips include proper set up for test equipment and need-to-know information regarding the preparation and execution of both Brinell and Rockwell hardness tests. 

In fact, while there are some practices that overlap, knowing the differences is critical to determine whether or not a piece has reached the appropriate hardness. For Brinell, grease may skew a reading so that “at 300 HBW the material may appear 20 HBW softer than it actually is.” On the other hand, the precision in measuring indentation depth (versus indentation width) makes it imperative to keep the surfaces clear of any contamination.  

Read the entire article at “3 Top Tips for Brinell and Rockwell Hardness Tests”

Trending Market Insights for Aluminum Thermal Processing 

Figure 6. State of the North American aluminum industry

In this survey on recent and developing changes in the aluminum market, we asked industry players about the impact of trending technology and the overall state of the industry. Their responses to our questions in August 2023 described a steady and increasing melters’ demand; a limited, or lack of, business increase from additive manufacturing and 3D printing; the impact of — and response to — slow supply chains; the status of sustainability in the aluminum market; and how they plan to meet future market demand. 

Read the entire article at “Trending Market Insights for Aluminum Thermal Processing”


Tech Round Up: Helpful, Readable, and Applicable Content Read More »

How To Tell If You Really Have an Abrasion Problem

Understanding abrasion can be the key to extending the life of your refractory lining. The following article provided by Plibrico Company examines abrasion resistance, its role in choosing a refractory solution, and what factors to take into consideration when assessing counter-measures.


Refractory material is designed to be very durable, withstand extreme service conditions and defy mechanical abuse in many different types of thermal-processing operations. However, severe conditions that cause abrasion in the form of high levels of mechanical scraping and airborne particulate matter can challenge refractories, shortening their service lives. 

Abrasion resistance is one of the most critical and possibly the most misunderstood considerations when choosing a refractory solution. A clear understanding of what abrasion is and, perhaps more importantly, what it is not can prevent needless repair costs and lead to significant savings. This is especially important when evaluating refractory designs for a new application or when considering upgrades for an existing one. 

What Abrasion Is 

Abrasion is the destructive process that causes a material to wear away through mechanical scraping or scratching. Anyone who has ever grated cheese or sanded wood has experienced the abrasion encountered in everyday life. As abrasion continues, thin layers of the abraded material are removed, leaving the object thinner and usually making its surface smoother. 

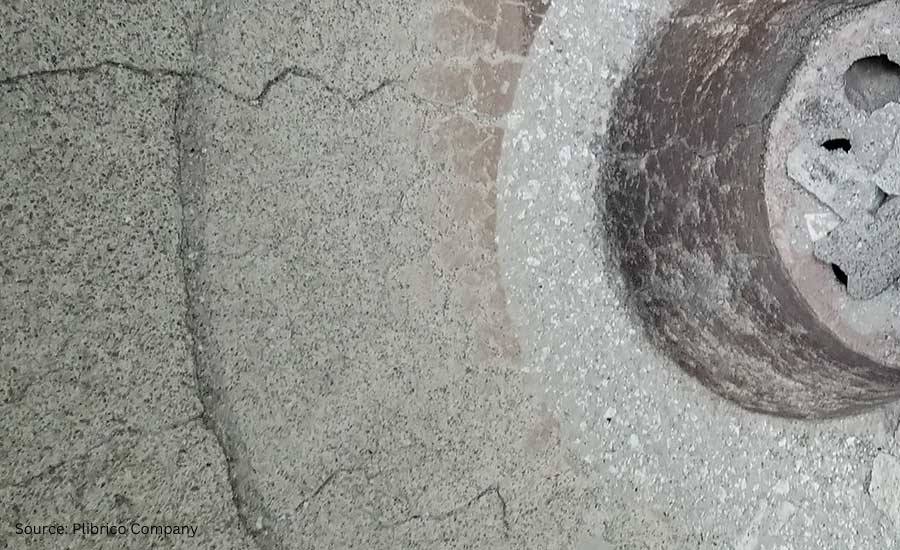
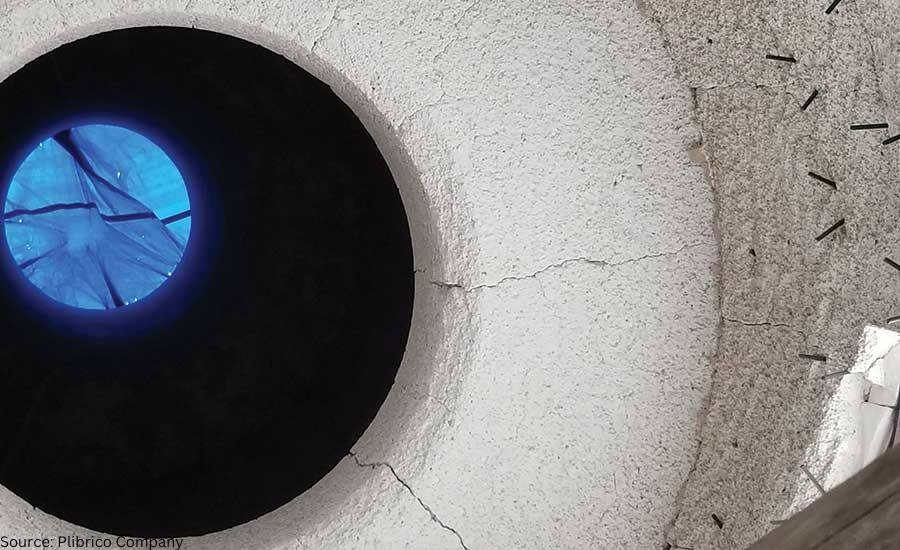
The same process can be observed in the refractory world. Refractory linings are abraded by high-velocity airborne particulate, cleaning tools and fuel/process materials that pass through the unit and come into contact with the lining. The telltale sign of abrasion is a refractory lining that has steadily become thinner while its surface has become smoother. The surface may even shine as if it had just been polished, which is not surprising when we consider that polishing is another common form of abrasion. 

Fig. 1. Abrasion damage to the refractory bottom of a choke ring of a thermal-oxidizer unit

What Abrasion is Not 

Abrasion is considered a type of mechanical abuse, but it is not the only type of mechanical abuse to which refractory linings are subjected. Equally common is impact: the sudden, forceful collision between the refractory lining and a moving object. Impact can come from a variety of sources. The moving object may be a cleaning tool, a piece of process material, a chunk of fuel or a dislodged mass of refractory or slag, depending on the application. Impact with such objects typically results in chips and cracks in the refractory lining. 

Refractory materials designed for abrasion resistance tend to have increased strength and hardness compared to those found in traditional refractories, and these abrasion-resistant materials may provide some resistance to impact. Abrasion-resistant properties can also lead to increased brittleness. This is because if the impact exceeds the strength of the material, chipping and cracking could potentially be worse than in traditional refractories. 

Compression and tension are also forms of mechanical abuse and can be caused by changes in the shape of the refractory lining as it is heated or cooled or by movements of the furnace shell itself – by intentional design or otherwise. Here again the increased strength and corresponding brittleness of the material could potentially result in a negative effect on the refractory lining. 

All types of mechanical abuse can cause thinning of the refractory lining, so it is important to conduct a detailed investigation into the destructive mechanism before drawing any conclusions. Refractory solutions designed to resist abrasion may not be helpful against damage caused by impact, compression or tension. 

Similarly, solutions designed to address other types of mechanical abuse may be ineffective against abrasion. For example, stainless steel needles are commonly incorporated into refractory linings to extend service life when impact resistance is required. The needles bridge cracks formed as a result of the impact, making it more difficult for these cracks to grow and connect. This helps the refractory lining hold together longer. The bridging provided by needles has no effect in an abrasion situation, however, since crack growth is not caused by the abrasion process. 

Meeting Abrasion-Resistance Demands 

Once abrasion is identified as the main mode of failure, there are several options to counter it. Selecting a refractory material based on a raw material hard enough to resist the abrasion is a common technique. For one material to abrade another it must be harder than the material being abraded. For instance, a diamond can be used to scratch glass, but glass cannot be used to scratch a diamond. 

It follows that refractory materials based on very hard raw materials, like silicon carbide, can be used to resist abrasion and extend the life of the lining. It should be remembered, however, that a refractory lining is made up of many different materials, not just the main constituent raw materials. Clay, cement, silica and other softer components will still be exposed and abraded even if abrasion of the main aggregate is stopped completely. 

Another option is to investigate the source of the abrasion and make adjustments to the process. Can a less-abrasive cleaning tool be used? Is there a way to limit the contact of the abrading process materials with the refractory lining? Is it possible to adjust the angle between the refractory lining and the incoming airborne particulate? 

A seemingly minor change in the process, with minimal cost and no downsides to the operation, can save in refractory replacement costs. When changes to the process are not an option, it is best to consider the abrasion resistance of the lining as a whole and select a specifically designed abrasion-resistant solution. A qualified, knowledgeable refractory solution expert with genuine experience will help you make the best decision for your specific application, taking into consideration the following: 

  • Speed of installation 
  • Service life 
  • All-in price 
Fig. 2. Airborne particle matter has contributed to the abrasion damage seen in the refractory of a thermal-oxidizer choke ring. Notice on the left side of the photo how the abrading of the refractory lining becomes worse.

Abrasion-Resistance Testing 

The most common measure of holistic abrasion resistance used to compare refractory solutions is the ASTM 704 test. This test exposes refractory lining materials to a stream of abrasive particulate that cause a portion of the sample to be abraded over time. By keeping sample size and shape constant – along with particle velocity, particle material and test duration – various refractory materials can be compared on an apples-to-apples basis. 

This testing can be performed by any qualified refractory testing lab and most reputable refractory manufacturers. Test results are recorded based on the volume of material lost from the sample during the test and are reported in cubic centimeters. Products with excellent abrasion resistance consistently test at 5 cc of loss or less, while elite materials can score less than 3 cc of loss. 

Products designed specifically for abrasion resistance will report ASTM 704 results on their material technical data sheets. It is important to remember that the abrasion-loss numbers reported on material technical data sheets are based on samples prepared in a lab under controlled conditions. Achieving these same properties in the field under real-world, job-site conditions would require a high-quality refractory installer partnered with a world-class refractory manufacturer. 

Fig. 3. Severe conditions lead to abrasion damage in the refractory lining of this dry-ash hopper. Notice the abrasion damage goes past the anchor line, leaving the bottom-left anchors exposed. 

Conclusion 

The thinning of a refractory lining due to abrasion is a source of frustration for many thermal-processing operations and is one of the most common modes of failure encountered in the refractory world. But, by taking the time to understand the failure mechanism and learn about the options available, you can realize significant savings by avoiding needless costs in the future. 

Learn more at www.plibrico.com

This article was initially published in Industrial Heating. All content here presented is original from the author.


How To Tell If You Really Have an Abrasion Problem Read More »
Automating the Brinell Hardness Tester In-House

Automating Brinell hardness testing could mean saving on expensive laboratories, as was the case for one oil tool industry manufacturer. Learn the basics of Brinell hardness testing, its strengths and weaknesses, and options for automation.

This Technical Tuesday article, written by Alex Austin, managing director of Foundrax Engineering Products Ltd., was originally published in Heat Treat Today’s December 2023 Medical and Energy Heat Treat print edition, both in English and in Spanish.


Brinell Hardness Testing: Strengths and Weaknesses

Alex Austin, Managing Director, Foundrax Engineering Products Ltd.

In many steelworks producing large forgings and billets, in numerous heat treatment companies, and near many factory lines producing components for safety-critical applications, you’ll find a Brinell hardness tester. These machines have been used all over the world for more than a century (the test was first demonstrated by its inventor, the Swedish metallurgist August Brinell, in 1900), determining metal hardness by means of a tungsten carbide indenter ball that leaves a dish-shaped indentation in the surface of the test material.

Figure 1. Brinell equation (Source: Foundrax Engineering Products Ltd.)

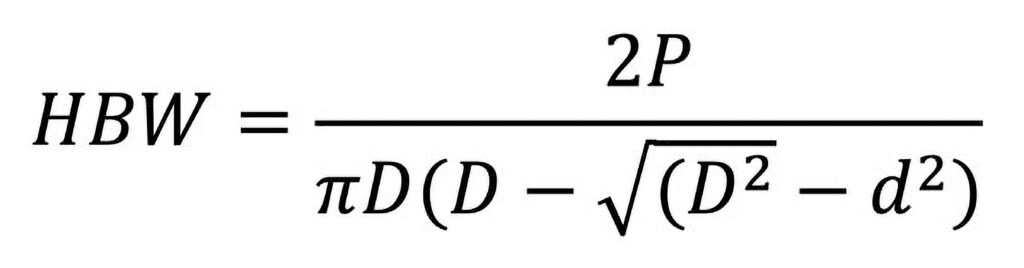
In the test, the material sample is placed on a rigid anvil, and the indenter descends onto it under loads ranging from 1 kg up to 3,000 kg, depending on the material. Indenters vary in diameter from 1 mm to 10 mm. Most tests use a 3,000 kg load and a 10 mm ball, and the standards always refer to this as “HBW 10/3000.” HBW stands for Hardness Brinell Wolfram, Wolfram being another name for the tungsten carbide the indenter ball is made from. After the (approximately) fifteen second indenting cycle, the indentation is measured across both its x and y axes, as a minimum, by a special calibrated microscope. The mean of the diameter readings is then fed into the Brinell equation.

Contact us with your Reader Feedback!

Naturally, most technicians would rather not use that equation, so they look the indentation diameter up on a chart and “read across” to the derived hardness.

The great advantage of the Brinell test, when considered alongside other metal hardness testing methods, is that the large indentation diameter (typically between 2.4 mm and 6 mm) means the test result is generally unaffected by the grain structure of the metal. It also means that the surface of the test sample can be adequately prepared in just a few seconds with an angle grinder. For these reasons, the test is regarded by many as the “default” one for rough-surfaced and/or coarse-grained samples.

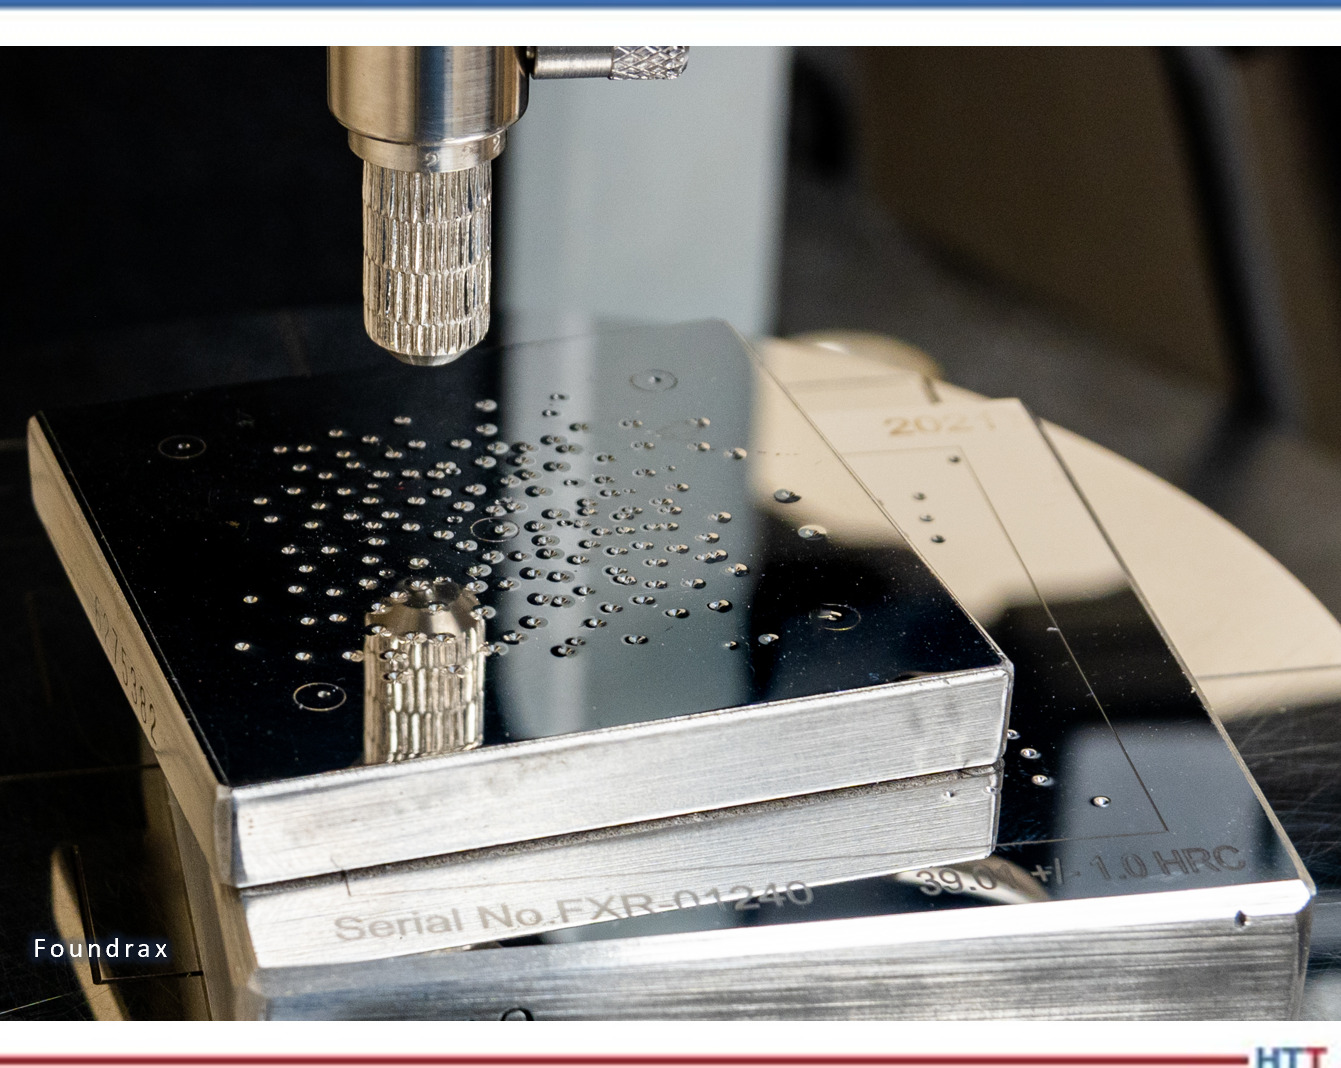
On the block in image (Figure 4), the distortion around the indentations can be seen very clearly.

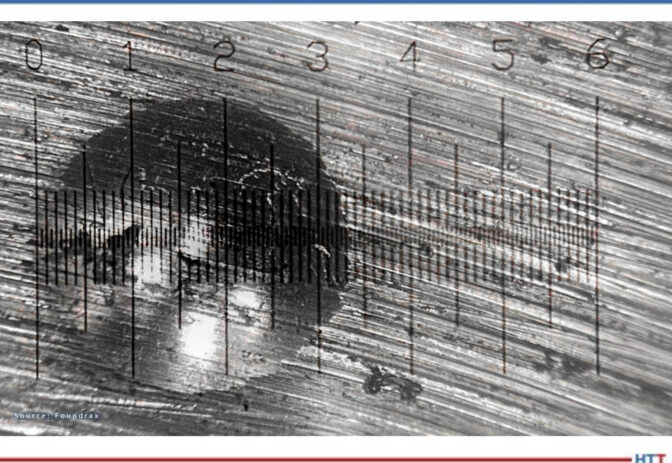
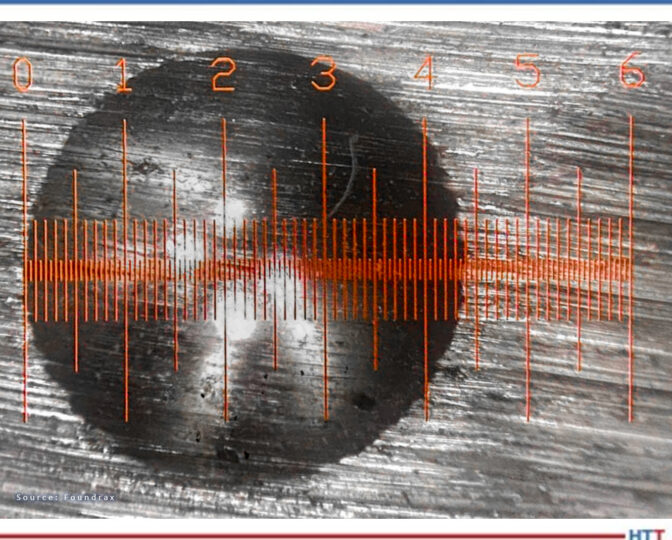
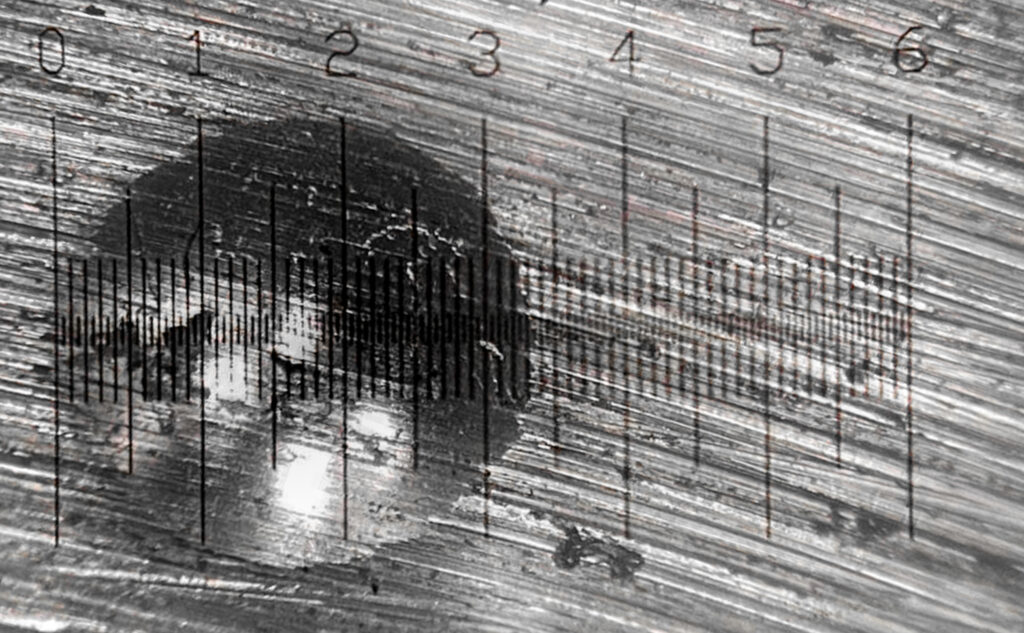
That seems pretty simple, but there are inherent weaknesses in the Brinell test: measuring the indentation. In our previous article (read it in Heat Treat Today’s August 2023 Automotive Heat Treat print edition), we used this image (Figure 2) to illustrate how difficult it could be to work out exactly where an indentation edge begins and ends.

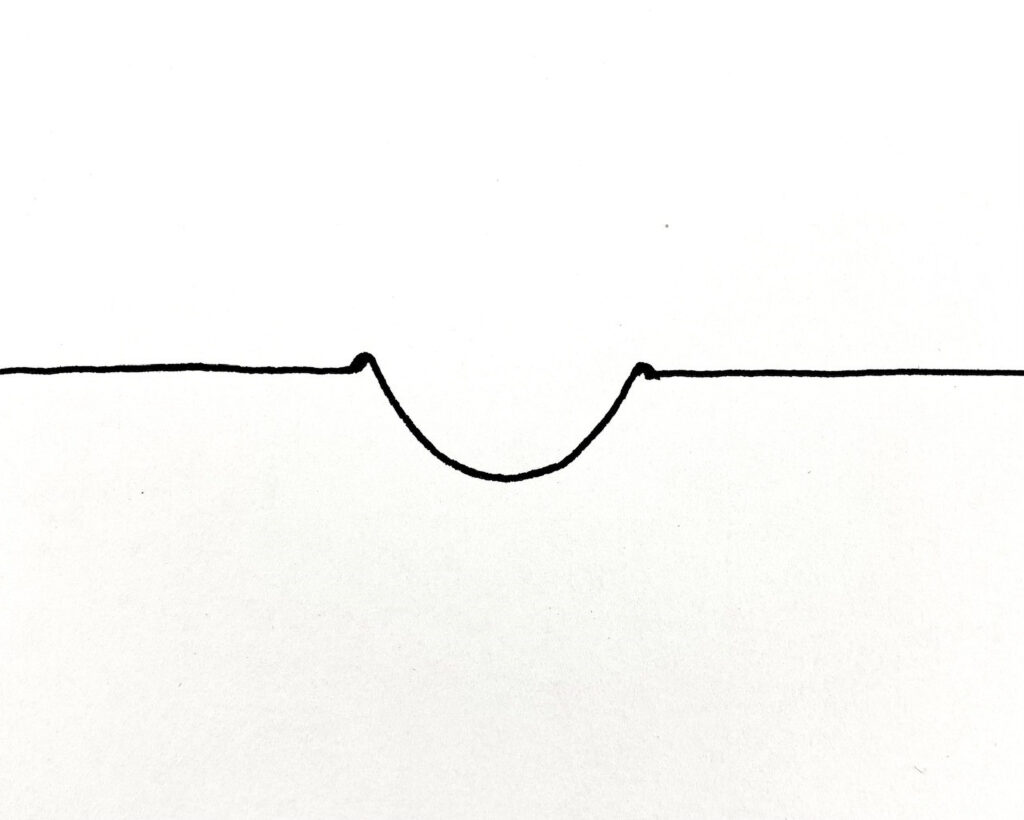
You might look at Figure 2 and think, “I’m pretty confident about where that indentation edge is,” but it’s trickier than it looks, because the process of indenting doesn’t just push material downwards; it also spreads it sideways, and you get a “pile up” around the rim of the indentation. The pile up may be difficult to see on hard material, or there may be a subtle “lip” inside the pile up that represents the true edge, but considered in cross-section, indentations look roughly like this simple sketch above (Figure 3).

Figure 2. Measurement of Brinell hardness test indentation (Source: Foundrax Engineering Products Ltd.)
Figure 3. Sketch of cross-section of indentation (Source: Foundrax Engineering Products Ltd.)

The overhead light illuminates the “pile up” rim very clearly on some of those indentations as a highlight around the edge. Where, exactly, does the pile up end and the true edge of the indentation begin? Bear in mind that 0.2 mm can equal 20 hardness points. You could show an indentation to three experienced workshop technicians and receive three different answers to the diameter question, and this problem has been a challenge of the Brinell test from its inception. Special blocks are available for training technicians in measurement, but the problem of operator interpretation was such that, in some quarters, the Brinell test was regarded as a bit “rough and ready.” “Ok for the workshop but not for the lab,” was perhaps how it was once seen.

Why Automate the Brinell?

The first question to consider when looking at the automation of the Brinell test is the measurement system because this is the inherent weakness. There are, of course, applications where only narrow tolerances are acceptable, and disagreements can arise between customers and suppliers.

Over the years, certain manufacturers, who mill heat treated materials for the oil tool industry, confided to us that they were regularly using expensive testing laboratories because of clients disputing the hardness figures of their products. They had previously been using manual microscopes. Obviously, this has reputational, as well as financial, consequences. If a manual microscope is employed on raw materials at the goods-in-process stage and there’s an error reading the hardness, you could find at final machining that you have put a lot of time and effort into a part that, in the end, is too hard or soft for the intended application.

Manually manipulating the microscope may not be worth the effort, especially when even a diligent operator may read the result incorrectly. With an automatic Brinell microscope, however, there is the possibility of major time and cost savings.

4 Levels of Automation

#1 Beginnings of Brinell Automation

The first step in automating Brinell hardness testing began 40 years ago when the world’s first automatic measurement microscope hit the market. The system, still being regularly refined, was able to measure the diameter of the indentation across over 100 axes, calculate the mean, and determine the hardness in a split second. It can handle most surface irregularity, operate in poor lighting, and warns operators of unacceptable surface preparation. Additionally, its precision adjusts for spatial error when lining up with a graticule. Within a few years of launch, a major oil tool manufacturer’s quality chief recommended its use to his suppliers, and user uptake was rapid.

#2 Integrated Microscope Model

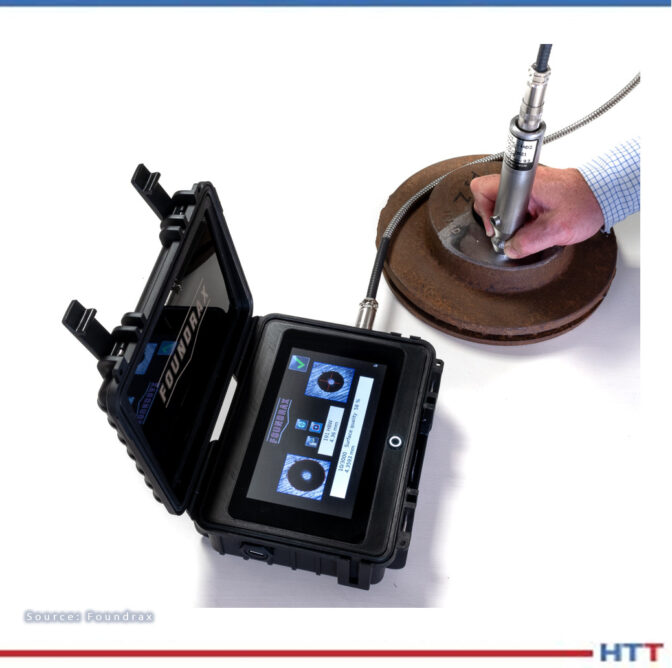
A further step in automation is to dispense with operator handling of the microscope entirely by the acquisition of a tester with an integrated microscope. The microscope mentioned above, for example, is a feature on several hardness testing machines. The heavy-duty indenter holder pivots away from its normal line of thrust at the end of the indenting cycle, allowing a supra-mounted camera to view the indentation. This is hugely advantageous: no separate apparatus near the test machine, reduced handling time, and thus, much faster testing overall. Results from such machines are displayed next to the control panel and quickly uploadable to company quality systems.

Figure 4. Block with distortion around indentations (Source: Foundrax Engineering Products Ltd.)

#3 Dispensing of Manual Operations

Another automation option is to dispense with a hand-cranked anvil capstan and purchase a tester with a fixed anvil and movable test head. The technician is not required to manually raise and lower the anvil to allow for variations in the size of sample. Instead, the test head automatically “takes up” the space and also clamps the test piece very securely in place during the test cycle.

#4 Incorporate Custom Hardness Tester in Production Line

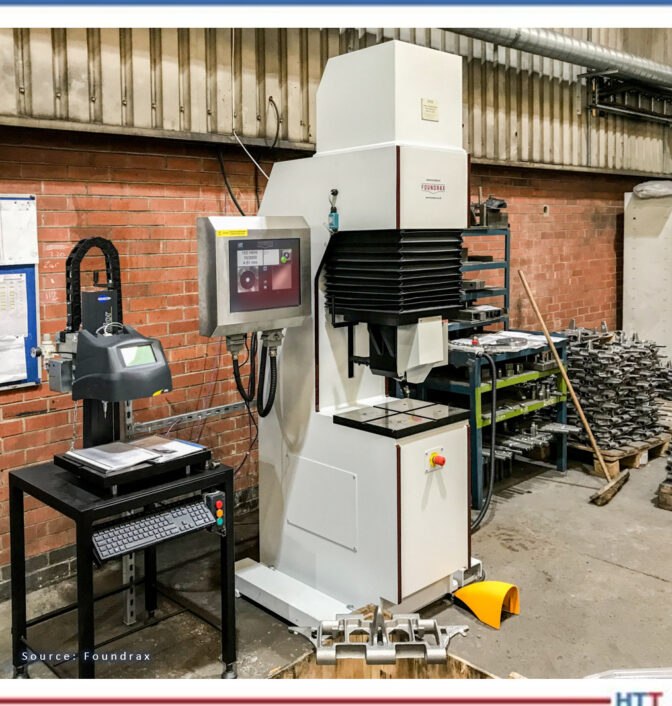
The fourth, and obviously most dramatic, automation step to consider is incorporating a custom-designed hardness tester into the production line. In some industries, this is essential. Large billets and forgings can’t be lifted into the jaws of a benchtop or floor-standing Brinell tester; so, for highly accurate testing of such items, a larger machine is required (Figure 5).

Figure 5. A custom-designed production line hardness tester. This machine is now in Texas. (Source: Foundrax Engineering Products Ltd.)

The whole gantry moves on one axis of travel while the test head moves perpendicular to that and, of course, up and down. This provides the full x, y, z movement. Large samples are maneuvered on and off by crane. The test head assembly incorporates the automatic microscope and results are displayed on a screen beside the control panel. Test results can be instantly uploaded to factory quality systems. The head assembly can also incorporate a milling tool for surface preparation!

With any decision to purchase plant and machinery equipment, some form of cost-benefit analysis is worthwhile. Clearly, if you’re doing a significant amount of business annually with a customer who is threatening to cease contracting with you because your hardness measurements are wrong too often, then the decision to buy an automatic microscope is not a difficult one. If staff are on overtime because mandatory hardness testing is adding too much time to production schedules, then a heavy-duty production machine with automatic microscope, movable test head, and sample clamp will pay for itself easily.

One thing is certain: Every automation option in Brinell testing increases accuracy and saves time.

About the Author

Alex Austin has been the managing director of Foundrax Engineering Products Ltd. since 2002. Foundrax has supplied Brinell hardness testing equipment for 60+ years and is the only company in the world to truly specialize in this field. Alex sits on the ISE/101/05 Indentation Hardness Testing Committee at the British Standards Institution. He has been part of the British delegation to the International Standards Organization advising on the development of the standard ISO 6506 “Metallic materials – Brinell hardness test” and is the chairman and convenor for the current ISO revision of the standard.

For more information: Visit www.foundrax.co.uk


Find Heat Treating Products And Services When You Search On Heat Treat Buyers Guide.Com

Automating the Brinell Hardness Tester In-House Read More »
3 Top Tips for Brinell and Rockwell Hardness Tests

OC

Accurate hardness testing is a critical business for numerous industries, not least heat treatment. In this guide, we will offer our “best practice” list for getting the best possible reading for your hardness test with the most efficiency.

This Technical Tuesday article was written by Alex Austin, the managing director at Foundrax Engineering Products Ltd.  


1. Tip for All Tests 

Contact us with your Reader Feedback!
Alex Austin
Managing Director
Foundrax Engineering Products Ltd.
Source: Foundrax

Make sure the test equipment is properly set up. In most instances, this involves keeping the test machine serviced and calibrated in accordance with the international standards (ASTM E-10 for Brinell and ASTM E-18 for Rockwell) or the manufacturer’s instructions — whichever are more strict — along with mounting it on a level, vibration-free surface. The absence of vibration is crucial if you are using a lever and weight machine, but still desirable for hydraulic and motor-driven types, and it is mandated by the standards. 

It is worth noting that for tests made using portable Brinell hardness testers that apply the full test load (albeit without the ability to maintain it uninterrupted for the full ten seconds), while it might not always be possible to mount the machine on a solid and level surface, the rest of the above still applies.  

If the anvil is mounted on a leadscrew, ensure that it is properly secured. Similarly, jigs should be in good condition, correctly mounted and hold the test piece securely. It is easy to become very relaxed about the amount of energy that goes into applying 3000 kg to a 10 mm ball, but if the component shatters under load the results can be dramatic and, potentially, very dangerous. 

Don’t forget your safety boots!  Also, as fingerprint residue is corrosive, always wear gloves.

2. Brinell Hardness Testing 

Preparation 

Before performing a Brinell hardness test, make sure both the test area and the indenter ball are clean and free of all lubricants. Oil or grease on the test surface or indenter could wreck the test by lubricating the path of the indenter, making a very significant difference to the apparent hardness level. For example, at 300 HBW the material may appear around 20 HBW softer than it actually is. Moreover, it can change the appearance of the indentation edge, causing a false diameter measurement. In any case, the hardness standards are clear that test pieces must be clean and lubricant-free. 

Prepare the area of the component surface where the test is to be carried out so that the indenter comes into direct contact with the core material. For this, the skin must be removed, including any decarburized layer, using a hand grinder with 60 grit abrasive (or finer, if appropriate) in 3–5 seconds, if a good automatic Brinell microscope will measure the indentation, or 10–15 seconds for a good manual microscope. This time differential is on the basis that a good automatic system will measure hundreds of diameters and ignore grinding “noise” when identifying the true edge of the indentation. On the other hand, use of a manual microscope is limited to the number one can reasonably measure by the time available and the equipment at hand. However, in the case of both automatic and manual testing, the better the surface, the better the result.    

Next, place the material on the test machine’s table or anvil. Ensure that it is stable and cannot move under the test load (machines with an integral clamp are preferable from this point of view). The clamp should be holding the material so that the test surface is perpendicular to the indenter’s line of operation.  

Carrying Out the Brinell Hardness Test

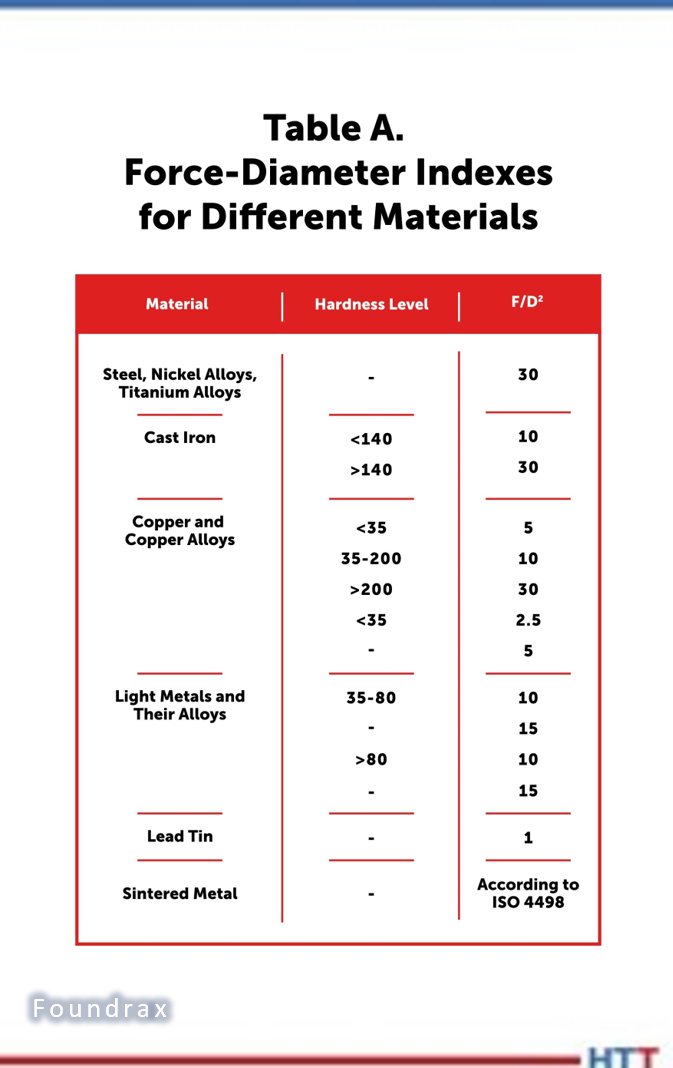
Table A. Force-diameter indexes for different materials

Use the correct force-diameter index (F/D²) for the material being tested; see Table A.

Apply the test force in accordance with ISO6506 or ASTM E-10, as appropriate. While the indenter is in downward motion and in contact with the material, avoid doing anything that might create vibrations that could reach the machine. When the indenter has withdrawn, measure the resulting indentation in a minimum of two diameters perpendicular to each other and convert the mean measurement into an HBW number.  

If using a portable Brinell hardness tester, exercise caution when removing the machine from the component so that the edge of the indentation is not accidentally damaged when the machine is released.  

3. Rockwell Hardness Testing

Preparation 

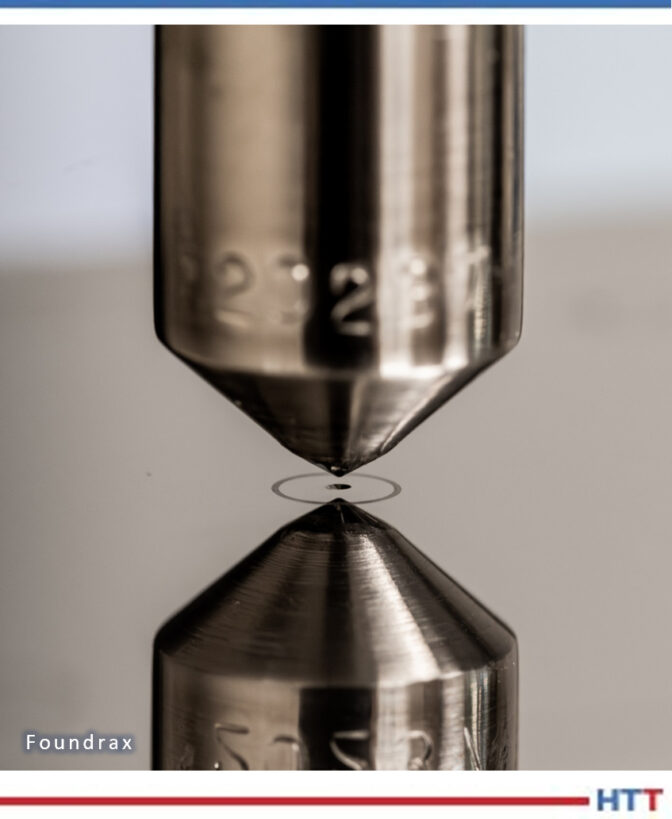
Figure 1. Close-up of Rockwell indentation

Cleanliness is everything in Rockwell testing. The indenters are much smaller than those used in Brinell testing and (as you would expect) so are the indentations (see Figure 1). And because the Rockwell test measures indentation depth, not width, any contaminant or particle that gets between the indenter and the material is a problem. Underside contamination is almost as important. There have been instances of clients finding that the testing block seemed to render two hardness points lower than we stated, yet in every instance, we found a buildup of soft contaminants (e.g., grease, oxides, micro-swarf) on the underside of the block. These contaminants “give” as the indenter is driven into the block, thereby permitting further indenter travel than would occur in the block material alone.

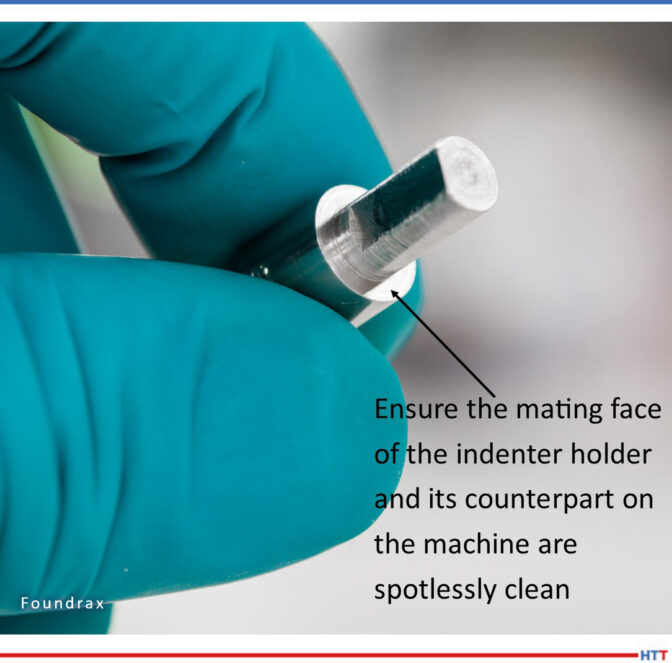
Lubricant contamination on the block surface is obviously extremely problematic. All blocks should be cleaned with a cloth and a liquid solvent that leaves minimal residue (e.g. isopropyl alcohol). Tissue paper can be used for cleaning but can scratch aluminum and brass easily; untreated cotton wipes are preferable. The anvil should also be cleaned by gentle application of a lint-free cloth dampened with solvent, and the indenter itself should be gently wiped at intervals throughout the test session. Another place where contaminants can build up (easily producing an error in excess of one Rockwell point) is the mating face where the indenter holder is inserted into the test head of the machine (see Figure 2). 

Figure 2. Importance in preparation

It is obviously also essential that the anvil mount cannot budge under the indenting load. If it is mounted on a vertical threaded column, the column should be free of excess grease and tightened to the point of no movement. Column “give” is another area where we have detected consequential erroneous readings.  

A further notable check worth performing is that the block, or test piece, has not been dropped and landed on a corner of the underside, which would leave a burr. This would prevent the piece from sitting flush on the anvil and probably negate the possibility of correct readings, as the piece would move under the indenter load. 

Procedure 

Figure 3. Softer block placed over test material during Rockwell test

If the first indentation on a block suggests a lower hardness than the remainder, there is a chance that air was trapped underneath it. The first indentations usually drives any air out, but in the case that air remained trapped beneath the indenter, the hardness reading will be falsely soft; the block will have moved downwards as it displaced the air, and the indenter will, therefore, have travelled further than if the block were truly sitting flush on the anvil. Placing a block that is softer than the test material on top of the test block and putting one indentation into it before commencing the tests will eliminate this problem (see Figure 3). 

Have an aerosol duster to hand during indenting to keep the block surface clear. 

Test blocks should, ideally, be stored in airtight cases to reduce the rate at which oxides form on their surfaces. Better still, wrap them in rust-reducing paper as well.   

(Photo Source: Foundrax Engineering Products Ltd.) 


About the Author: Alex Austin has been the managing director of Foundrax Engineering Products Ltd. since 2002. Foundrax has supplied Brinell hardness testing equipment for 60+ years and is the only company in the world to truly specialize in this field. Alex sits on the ISE/101/05 Indentation Hardness Testing Committee at the British Standards Institution. He has been part of the British delegation to the International Standards Organization advising on the development of the standard ISO 6506 “Metallic materials – Brinell hardness test” and is the chairman and convener for the current ISO revision of the standard.

For more information:

Contact www.foundrax.co.uk


Find heat treating products and services when you search on Heat Treat Buyers Guide.com


3 Top Tips for Brinell and Rockwell Hardness Tests Read More »
El ensayo de dureza Brinell para principiantes

Cuáles son las características más deseables de un probador de dureza Brinell? Esta reseña del equipo le permitirá evaluar si debe o no incorporarlo a su departamento de tratamiento térmico.

Read the Spanish translation of this article in the version below or read the English translation when you click the flag to the right. Both the Spanish and the English versions were originally published in Heat Treat Today's August 2023 Automotive Heat Treat print edition.


Toda empresa dedicada al tratamiento térmico deberá practicar ensayos de dureza, algunos de ellos utilizando la medición Brinell que data desde el año 1900, lo que lleva a que se amerite el análisis de tan perdurable técnica. La prueba en mención requiere de un penetrador de bola de carburo de tungsteno que impacte de manera vertical sobre la superficie del material a ser ensayado, previamente ubicado éste sobre un yunque fijo. Paso seguido, se mide el diámetro de la “huella” generada por la bola, mínimo por los ejes “x” y “y,” y se toma el promedio de estas mediciones como cifra operativa de la que se pueda valer el técnico para establecer la dureza, bien sea alimentando una ecuación o mediante la lectura de una tabla de valores en la que se relacione diámetro frente a dureza.

Contact us with your reader feedback!

Para el ensayo Brinell se dispone de una amplia gama de cargas de fuerza, al igual que de diámetros de penetradores, reflejando la gran variedad de metales a ser probados; no obstante, en la mayoría de ensayos se implementa una bola de 10mm bajo una carga de 3.000 kg. En las grandes máquinas de apoyo a suelo por lo general el penetrador es motorizado, aunque otras operan a partir de palancas y pesas, mientras que también las hay hidráulicas o neumáticas.

Existen tres razones principales por las que la prueba Brinell no deja de ser el método más opcionado para la medición de la dureza en muchas industrias de tratamiento térmico.

1. Preparación de la superficie

La preparación de la superficie de una muestra para las pruebas Brinell toma solo unos segundos con una amoladora. Siempre que la muestra esté firmemente asentada sobre el yunque presentando la cara superior en dirección perpendicular a la dirección de la fuerza del penetrador, de acuerdo a lo exigido por las normas, no es necesario lograr una superficie demasiado lisa.

Figura 1. Robusto probador Brinell in situ

2. Contaminación de la superficie

Es poco probable que los contaminantes diminutos en una superficie generen una “prueba errónea” bajo un penetrador Brinell, a diferencia de la prueba de dureza Rockwell (el método más común en la industria). En esta prueba un pequeño indentador de diamante penetra menos de una centésima de pulgada, arrojando como resultado el que cualquier contaminante o anomalía en la superficie que pueda impedir o favorecer el progreso del penetrador (incluído el paralelismo) represente un problema, y obligando a que las muestras para la prueba Rockwell se deban preparar cuidadosamente antes de realizar la misma.

3. Portabilidad

Quizás el factor más significativo es que los robustos equipos portátiles de mano Brinell, con cabezales de prueba hidráulicos, permiten probar, in situ, piezas grandes, pesadas, de superficies rugosas o formas irregulares. Esta característica es de tal utilidad en la industria que ha motivado a que los órganos de normalización internacional otorguen una dispensación especial, una excepción si se quiere, a las máquinas portátiles, pese a que la ejecución de las mismas no sea susceptible de verificación directa como sí lo es la de sus equivalentes, las máquinas fijas.

Con fuerzas que van desde los 3000 kg hasta 1 kg, y bolas penetradoras tan pequeñas como 1 mm, las pruebas Brinell se pueden usar en una amplia gama de metales, pero los lugares en los que existiría la mayor probabilidad de encontrar un equipo de 10mm/3000kg son las forjas, las fundiciones, las plantas de tratamiento térmico, los laboratorios y las áreas de control de calidad. Previamente mencionamos que no se requiere que la superficie de las muestras de prueba sea absolutamente lisa; de hecho, es posible medir con un grado importante de precisión las superficies irregulares en materiales de configuración gruesa ya que el diámetro de la hendidura es tan grande en relación con cualquier irregularidad en la superficie.

Figura 2. Probador de Brinell, grado calibrador, en primer plano

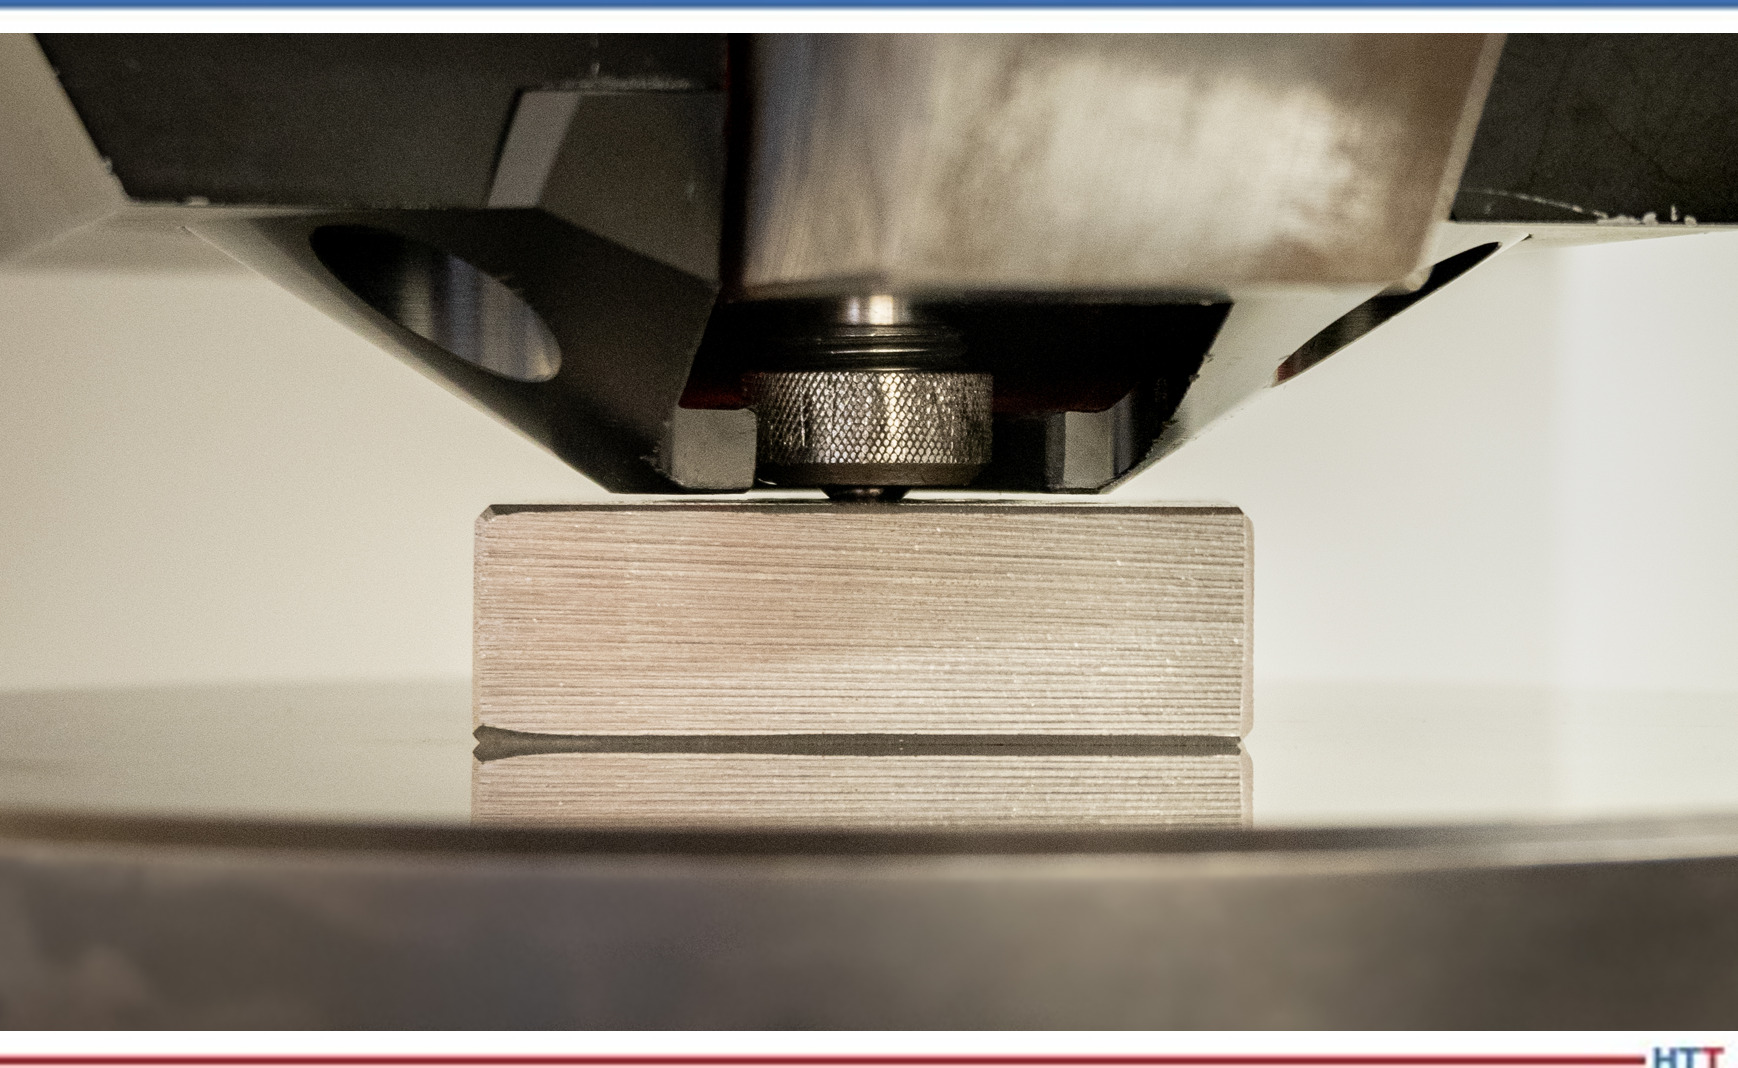
En la Figura 2 se puede apreciar cómo un probador Brinell de grado calibrador introduce la bola de carburo de tungsteno en la muestra de prueba. Se mantiene la bola en posición para estabilizar la deformación plástica.

Las normas que rigen de manera detallada las pruebas Brinell son la ASTM E-10 y la ISO 6506, pero el procedimiento práctico para los técnicos es muy sencillo, tanto que el entrenamiento no debería tardar más de una hora. Para ensayar piezas forjadas, palanquillas y otras muestras, una hendidura debería bastar aunque, desde luego, en ciertas aplicaciones de extrema importancia se podrá utilizar más de una para mayor seguridad.

Saber si analizar o no cada muestra en un lote determinado deberá decidirse con base en la inconsistencia de las muestras mismas, más no responde a problemática alguna con las pruebas de Brinell en sí. En ciertas industrias se prueba cada pieza que se produce debido a que el riesgo de error es demasiado alto. Un buen ejemplo lo encontramos en la producción de los componentes de los eslabones para las orugas utilizadas en tanques y maquinaria pesada (retroexcavadoras y demás). Cada eslabón de cada oruga de un tanque en uso en el ejército británico ha sido probado por Brinell en una máquina totalmente automática, de alta velocidad, que cuenta con una poderosa abrazadera integral para mantener el componente absolutamente rígido durante la prueba. Por cierto, esa máquina es la de la primera foto. Con un cuidado adecuado y razonable, un probador Brinell robusto podrá generar cientos de miles de pruebas; de hecho, el probador de la Figura 1 ha realizado varios millones.

Las pruebas duran aproximadamente quince segundos ya que el penetrador se debe dirigir hacia el material de manera uniforme sin permitir la posibilidad de un “rebote” y evitando por completo llegar a golpear el material. Por otro lado, el metal debe recibir la presión por un período de tiempo suficiente que garantice que la hendidura se deforme de la manera más plástica posible, es decir, minimizando al máximo el riesgo de la más ligera contracción de la hendidura una vez retirado el penetrador.

Figura 3. Medición de una hendidura de prueba de dureza Brinell

Sin embargo, es en este punto que se presentan las complicaciones. Después de generar cuidadosamente la hendidura y retirar la muestra de prueba de la “boca” de la máquina probadora, es necesario medir la hendidura en al menos dos diámetros. Dado que las hendiduras de Brinell tienen como máximo 6 mm de ancho y que una diferencia de 0,2 mm en el diámetro podría equivaler a 20 puntos de dureza, obtener la medición correcta es esencial y de alta complejidad. La mayoría de los técnicos usan un microscopio iluminado para lograrlo, pero aún así puede ser un desafío. Considere la Figura 3.

Los microscopios de medición manual han mejorado a lo largo de los años, y cuando se obtiene una hendidura relativamente “limpia” con una retícula nítidamente iluminada, se le puede facilitar al técnico experimentado realizar una medición precisa. La Figura 4 presenta un escenario menos complejo que el anterior pero, aun así, ¿cómo podemos saber si realmente se ha juzgado con precisión la posición del borde?

Figura 4. Medición con microscopio mejorado y retícula bien iluminada.

Al crearse la hendidura se genera un cordoncillo en el perímetro de la misma debido a que el metal no solo presiona hacia abajo, sino también hacia los lados. Este cordoncillo puede difi cultar la ubicación del punto en el que comienza realmente la hendidura, y tres técnicos diferentes pueden hacer fácilmente tres estimaciones diferentes de su lugar de inicio. Es esta variación en la interpretación de los resultados por parte de los operadores la que ha llevado a que, durante más de 80 años, la prueba Brinell se haya considerado un poco “ordinaria”, apta tal vez para el maquinista en el taller, pero de dudoso valor para el científi co en el laboratorio.

En 1982 llegó a los mercados el primer lector automático, siendo éste la culminación de años de investigación, y valiéndose de software privado que llevó a las computadoras de la época a sus límites. El equipo podía hacer cientos de mediciones de un lado a otro de la hendidura y calcular el diámetro medio en una fracción de segundo. Poco después llegó a ser parte integral de una máquina de prueba Brinell. La noticia de la aparición de este equipo pronto llegó a algunos usuarios importantes en la industria de las herramientas petroleras quienes exigieron a sus proveedores valerse de él; quince años más tarde se había diseminado ampliamente el uso de esta tecnología generando la transformación de la percepción que se tenía de la prueba Brinell. Podríamos decir que la prueba Brinell había llegado a la mayoría de edad.

Figura 5. La última versión de ese microscopio automático en acción

Desde luego, como con cualquier equipo de medición importante, la calibración y el mantenimiento regulares son aconsejables, si no obligatorios. Los fabricantes mismos suelen estipular un cronograma de mantenimiento que se debe tener en cuenta junto con las reglas de calibración establecidas por las agencias internacionales.

Al considerar las opciones para la prueba de dureza en muestras con tratamiento térmico, en última
instancia existen tres métodos: Brinell, Rockwell y Microdureza (Vickers o Knoop).

Pese a que no es adecuada para muestras muy pequeñas o demasiado delgadas, la prueba Brinell es relativamente “inmune” a los contaminantes pequeños, los penetradores no son costosos, y, gracias al ancho de la hendidura, las pruebas de superficies con acabado áspero e irregular no presentan dificultades. Con el desarrollo, hace 40 años, de la medición automática de la hendidura, se superó la única deficiencia grave de la prueba Brinell, proporcionando las garantías que tan vital importancia revestían para los proveedores de piezas esenciales en industrias de toda índole, incluídas las de petróleo y gas, aeroespaciales y de defensa y transporte.

Sobre el autor: Alex Austin se viene desempeñando desde 2002 como gerente de Foundrax Engineering Products Ltd. Foundrax es proveedor de equipos de prueba de dureza Brinell desde1948, siendo en realidad la única compañía en el mundo especializada en el campo.

Alex funge en el Comité de Prueba de Dureza por Hendidura ISE/101/05 del British Standards Institution. En su calidad de miembro de la delegación británica de la Organización Internacional de Normalización, ha aportado como consultor para el desarrollo de la norma ISO 6506 “Materiales metálicos–prueba de dureza Brinell” y preside en la actualidad la revisión ISO de dicha norma.

Mayor información en www.foundrax.co.uk


Find heat treating products and services when you search on Heat Treat Buyers Guide.com


El ensayo de dureza Brinell para principiantes Read More »
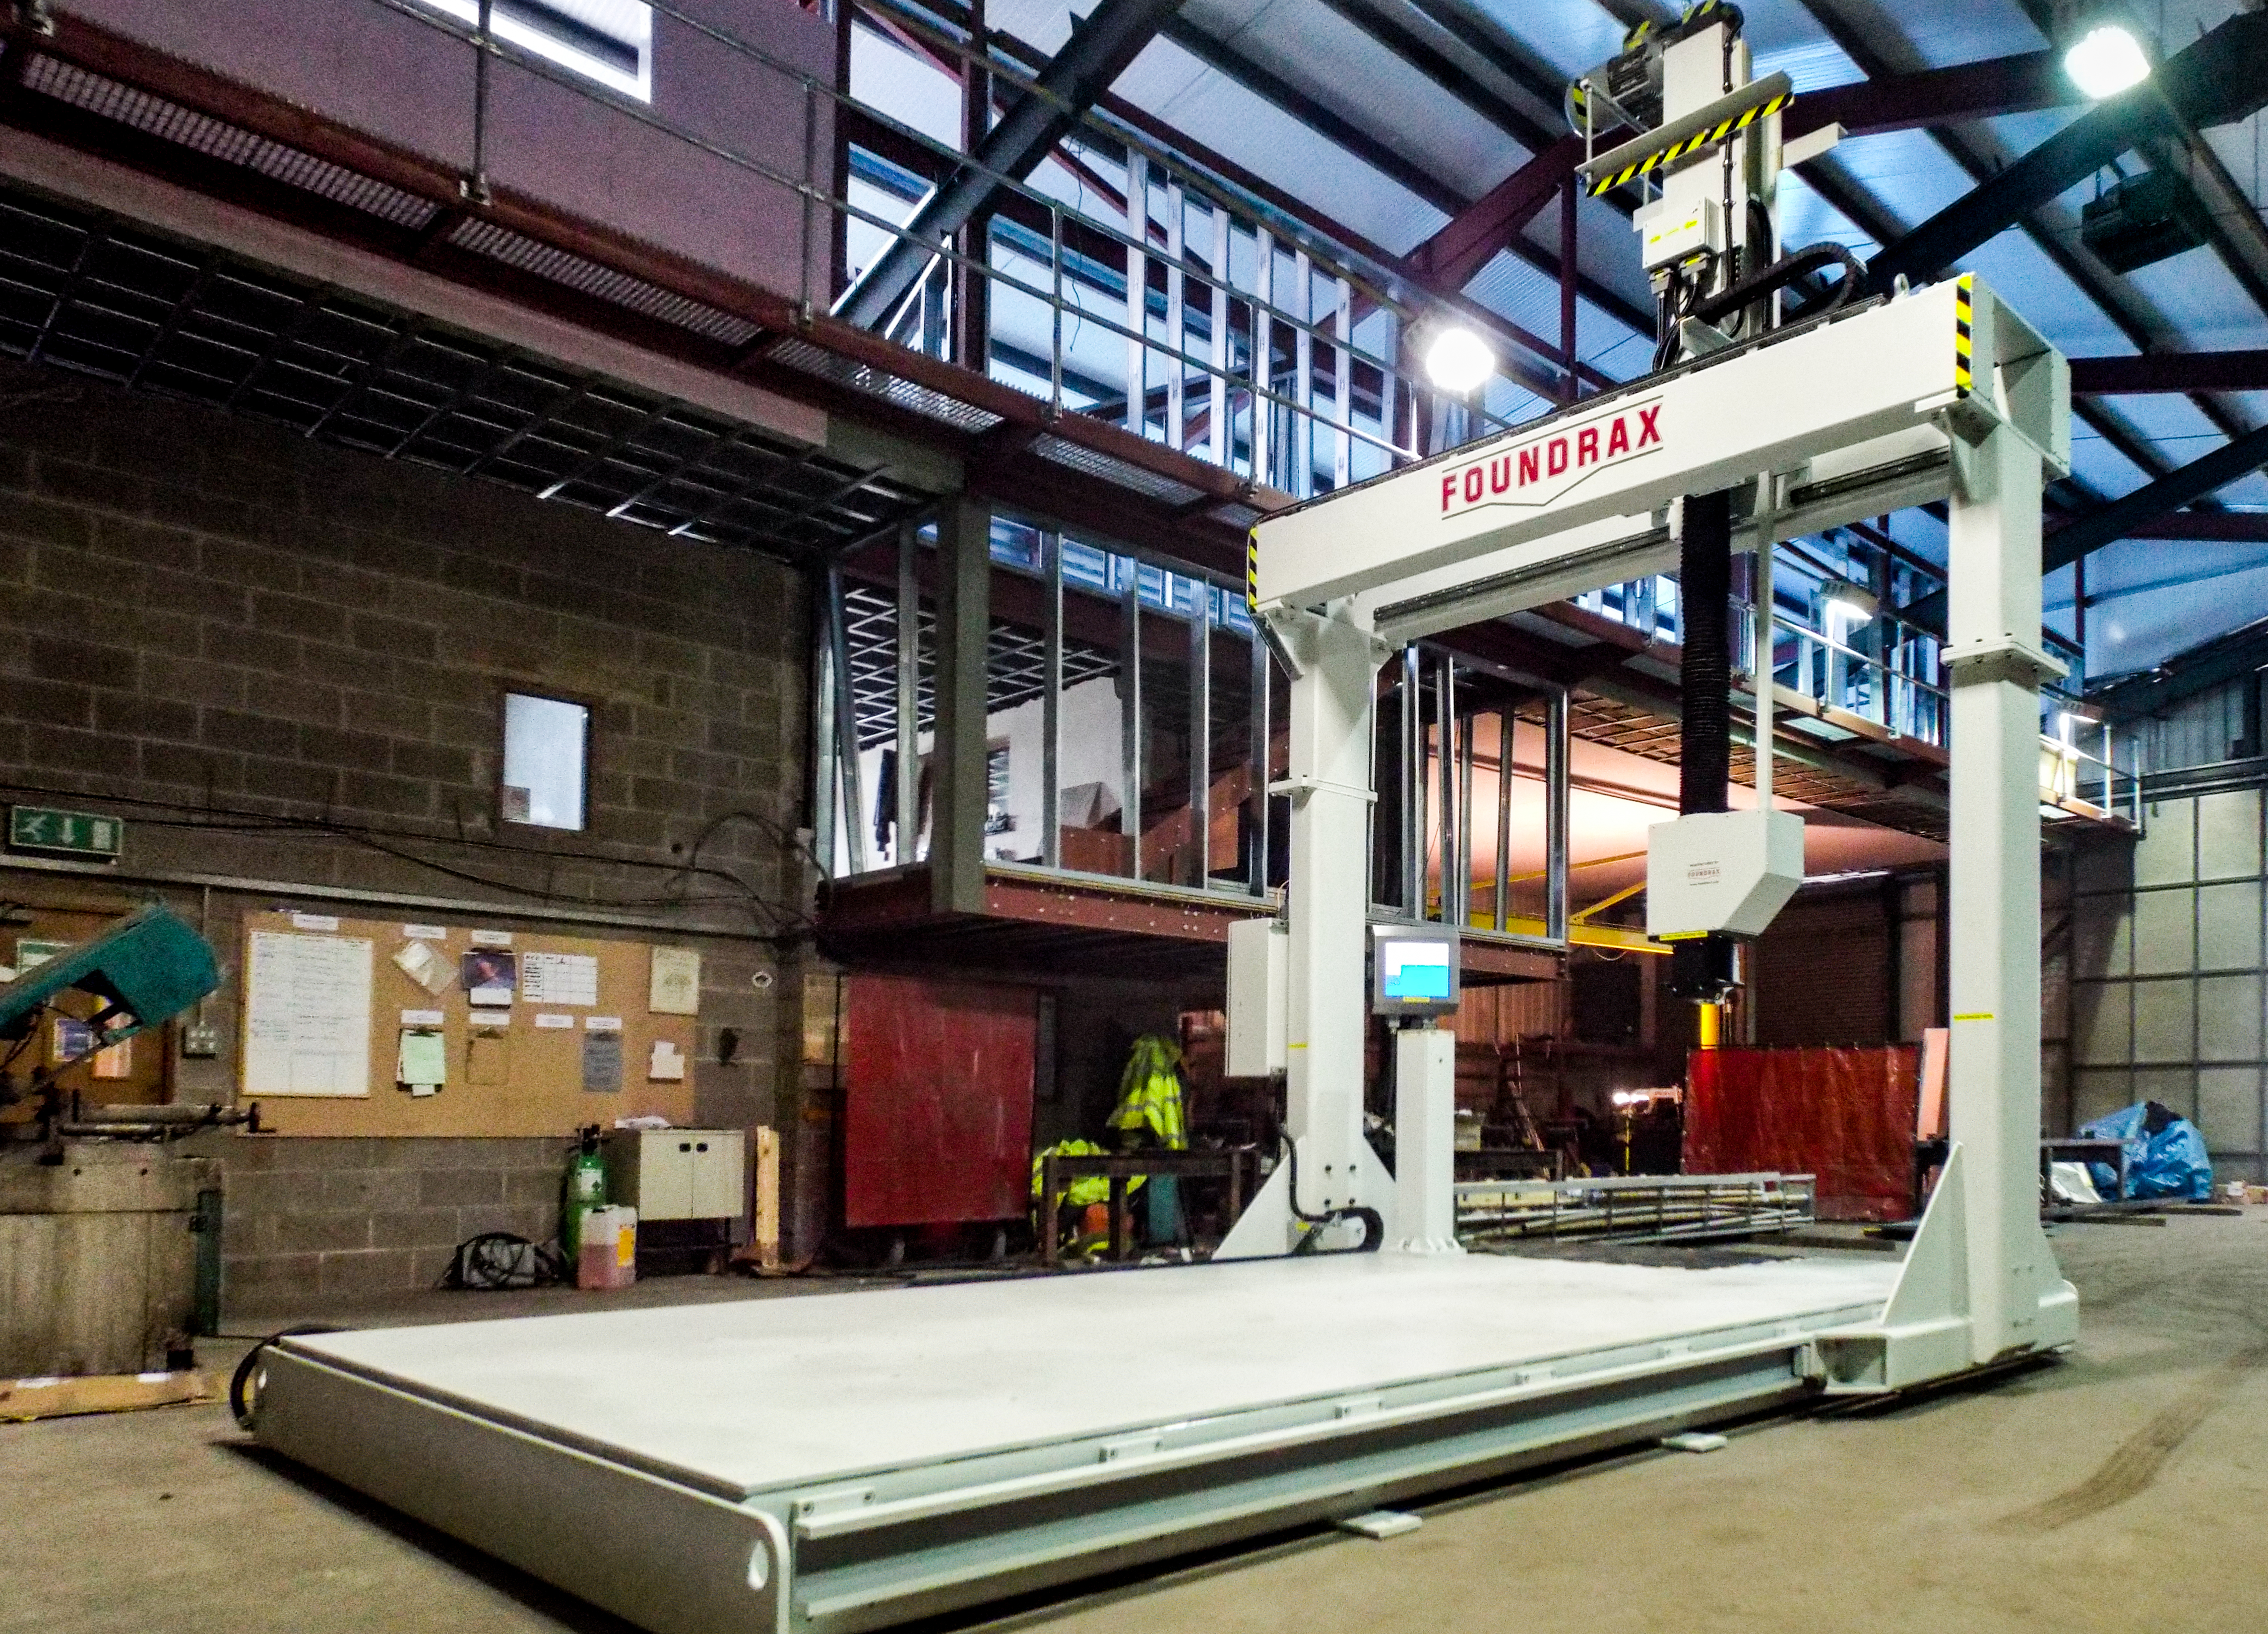
Brinell Hardness Testing 101

What are the most desirable attributes of a Brinell hardness tester? Does it belong in your heat treat department? Read this equipment overview to decide. 

Read the English translation of this article in the version below or read the Spanish translation when you click the flag to the right. Both the Spanish and the English versions were originally published in Heat Treat Today's August 2023 Automotive Heat Treat print edition.


Alex Austin
Managing Director
Foundrax Engineering Products Ltd
Source: Foundrax

All heat treatment companies must test hardness; many with a Brinell tester. Existing since 1900, a review of this time-tested method is in order.

Contact us with your Reader Feedback!

The Brinell test requires a tungsten carbide ball indenter to be forced vertically into the surface of the test material, placed on a rigid anvil. The diameter of the indentation made by the ball is then measured across both its x and y axes as a minimum, and the average of these measurements is taken as the working figure. The technician can then either feed that figure into an equation to determine the hardness or read from a “diameter-to-hardness” chart.

There are various forces and indenter diameters available for Brinell testing reflecting the very wide range of metals that need to be assessed, but most tests involve a 10 mm ball under a 3,000 kg load. In large, floor standing machines, the indenter is usually motor-driven, but some machines use levers and weights, while others are hydraulic or pneumatic. The Brinell test remains the default method for hardness measurement in many heat treatment facilities, for three primary reasons.

1.  Surface Preparation

Preparing the surface of a sample for Brinell testing takes just a few seconds with a grinder. Provided the sample is sitting steadily on the anvil and the top face of the sample is perpendicular to the direction of force of the indenter — as mandated by the standards — the surface does not need to be particularly smooth.

Figure 1. Heavy-duty Brinell tester in situ

2. Surface Contamination

Minute surface contaminants under a Brinell indenter are unlikely to cause a “mis-test.” By comparison, during Rockwell testing, the most widely used method across all industries, a tiny diamond indenter penetrates the surface by less than one hundredth of an inch, and any contaminants or surface abnormalities (including parallelism) that could impede or assist the progress of the indenter are a problem, which means that Rockwell samples must be carefully prepared before testing.

3. Portable

Perhaps most significant, rugged, hand-held portable Brinell testers with hydraulic test heads enable large, heavy, and awkwardly shaped components of rough surface finish to be tested in situ. This feature is of such utility in industry that the international standards authorities give a dispensation — a special designation — to portable machines, although their performance cannot be directly verified like their floor-standing cousins.

With forces ranging from 3000 kg down to 1 kg and indenter balls as small as 1 mm, Brinell testing can be used on a vast range of metal, but forges, foundries, heat treatment plants, quality control areas, and laboratories are the places one would most likely find a test machine working at 10 mm/3000 kg. It was mentioned earlier that the surface of test samples doesn’t need to be particularly smooth, in fact roughly- ground surfaces on materials with a coarse grain structure can be measured quite safely because the diameter of the indentation is so large relative to any irregularities on the surface.

Figure 2. Close-up of a calibration-grade Brinell tester

In Figure 2, a calibration-grade Brinell tester drives the tungsten carbide ball into the test sample. The ball is being held in position to stabilize plastic deformation. ASTM E-10 and ISO 6506 — the authoritative documents for Brinell testing — lay out standards in detail, but the practical procedure for workshop technicians is very straightforward; training should not take longer than an hour. When testing forgings, billets, and other samples, one indentation should suffice but in certain critical applications more than one indentation may be used for assurance.

The question of whether to test every sample in a batch will depend on how inconsistent those samples might be; it has nothing to do with any issues with Brinell testing itself. In certain industries, every single product is tested because the risk of failure is too high. A good example of this is the production of links for the tracks used on tanks and other armored vehicles. Every link in every tank track in use by the British Army has been Brinell tested on a high-speed, fully automatic machine that features a powerful integral clamp to keep the component rigid during the test. You can view the machine in Figure 1 on page 44. Subject to reasonable care, a heavy-duty Brinell tester will perform many hundreds of thousands of tests. The machine in Figure 1 has performed several million.

Tests take approximately fifteen seconds. The indenter must be driven uniformly into the material with no possibility of either a rebound or a speed that would “punch” the indenter into the material. Also, the metal must be loaded for a sufficient length of time to ensure the indentation is properly (plasticly) deformed, that is, the risk of an indentation shrinking very, very slightly after the indenter is withdrawn is kept to a minimum.

Figure 3. Measurement of Brinell hardness test indentation

Measuring the indentation is more challenging. After carefully making the indentation and withdrawing the test sample from the “jaws” of the test machine, one must measure the indentation across at least two diameters. Given that Brinell indentations are at most 6 mm across and that 0.2 mm difference in diameter might equal 20 hardness points, getting the measurement right is critical — and tricky. Most technicians will use an illuminated microscope to do this, but even then it can be a challenge. Consider Figure 3 on the next page.

Making an indentation leaves a “ridge” at the indentation perimeter because metal is not just pushed downwards, but also sideways. This ridge can obscure where the real indentation begins, and three different technicians can easily make three different estimates of where that is. And this variation in operators’ interpretation of results is why, for over 80 years, the Brinell test was seen as a little “rough and ready,” for the workshop machinist, perhaps, but probably not for the laboratory scientist.

Manual measurement microscopes have improved over the years, and a relatively “clean edged” indentation with a crisply illuminated graticule can be less challenging for the experienced technician to make an accurate measurement. Figure 4 is a less difficult scenario than the one above. Even so, how can we know if we have really judged the position of the edge precisely?

Figure 4. Measurement with improved microscope and well-illuminated graticule

In 1982, the first automatic reader hit the markets. This was the culmination of years of research and used proprietary software that pushed the computers of the day to their limits. The equipment could make hundreds of measurements across the indentation and calculate the mean diameter in a split second. Not long afterwards, it was available as an integral part of a Brinell test machine. Word of this equipment soon reached critical users in the oil tool industry, and they mandated its use to their suppliers. Within 15 years, the use of this technology was widespread and the perception of the Brinell test’s accuracy had been transformed. The Brinell test, in a sense, had come of age. See Figure 5 for the latest version of that automatic microscope in action.

Finally, like any important measuring equipment, regular calibration and servicing is desirable, if not compulsory. Manufacturers typically stipulate a service schedule which must be considered alongside the calibration rules dictated by international agencies.

When considering options for hardness testing of heat treated samples, there are ultimately three test methods: Brinell, Rockwell, and Microhardness (Vickers or Knoop).

Figure 5. Latest version of the automatic microscope in action

While Brinell testing isn’t suited to very small or very thin samples, it is relatively “immune” to small contaminants, the indenters are not expensive, and the width of the indentation means that testing of coarse grained and roughly finished surfaces is not problematic. With the development of reliable automatic indentation measurement, the one serious deficiency of the Brinell test was overcome, providing the assurance that was vital to critical components suppliers in all types of industries such as oil and gas, aerospace, defense, and transportation.

About the Author:

Alex Austin has been the managing director of Foundrax Engineering Products Ltd. since 2002. Foundrax has supplied Brinell hardness testing equipment since 1948 and is the only company in the world to truly specialize in this field. Alex sits on the ISE/101/05 Indentation Hardness Testing Committee at the British Standards Institution. He has been part of the British delegation to the International Standards Organization advising on the development of the standard ISO 6506 “Metallic materials – Brinell hardness test” and is the chairman and convenor for the current ISO revision of the standard.

For more information:
Contact www.foundrax.co/uk.


Find heat treating products and services when you search on Heat Treat Buyers Guide.com


Brinell Hardness Testing 101 Read More »
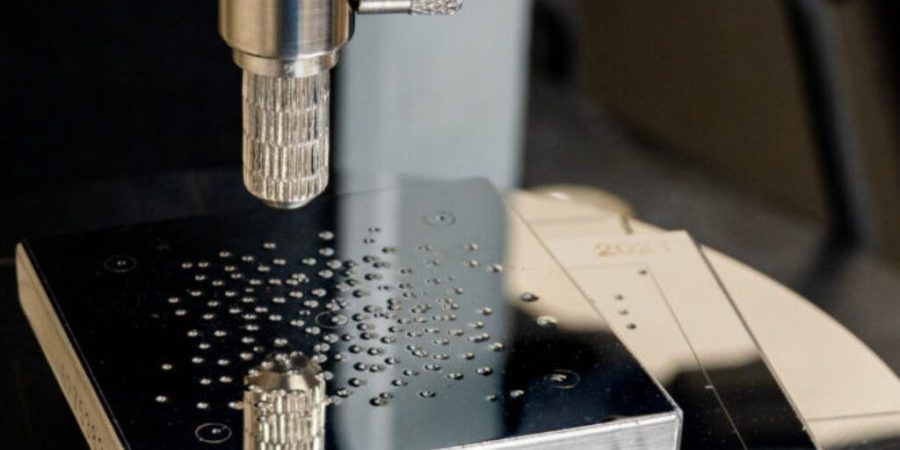
Tips #13 – 23 – 33 – 43

One of the great benefits of a community of heat treaters is the opportunity to challenge old habits and look at new ways of doing things. Heat Treat Today’s 101 Heat Treat Tips is another opportunity to learn the tips, tricks, and hacks from some of the industry’s foremost experts.

Heat Treat Today’s latest round of 101 Heat Treat Tips is featured in Heat Treat Today 2020 fall issue (also featuring the popular 40 Under 40).

Today’s selection includes four tips from Leybold Vacuum USA, Young Metallurgical Consulting, Dr. Valery Rudnev, and Chiz Bros. Increase output, decrease production costs, hit target temperature, and avoid thermal shock with these four tips.


Heat Treat Tip #13

New Diffusion Pump Technology Increases Production Output

Gain immediate positive net cash flow with a lease to own finance option by upgrading your diffusion pumps with the new immersion heater technology. The new style heater will extend oil life and reduce energy consumption. New heater technology can increase production by eliminating the need of dropping your pump every time you change oil for faster maintenance turn around. Drop in place pump design with improved performance.

NEW-DIJ Diffusion Pumps with smart heater technology by Leybold Vacuum
Source: Leybold Vacuum USA

(Leybold Vacuum USA)


Heat Treat Tip #23

Inspection Mistakes That Cost

Rockwell hardness testing requires adherence to strict procedures for accurate results.  Try this exercise to prove the importance of proper test procedures.

  • A certified Rc 54.3 +/- 1 test block was tested three times and the average of the readings was Rc 54 utilizing a flat anvil.  Water was put on the anvil under the test block and the next three readings averaged Rc 52.1.
  • Why is it so important that samples are clean, dry, and properly prepared?
  • If your process test samples are actually one point above the high spec limit but you are reading two points lower, you will ship hard parts that your customer can reject.
  • If your process test samples are one point above the low spec limit but you are reading two points lower, you may reprocess parts that are actually within specification.
  • It is imperative that your personnel are trained in proper sample preparation and hardness testing procedures to maximize your quality results and minimize reprocessing.

Properly preparing a hardness sample can save time and money.

Source: Young Metallurgical Consulting

(Young Metallurgical Consulting)


Heat Treat Tip #33

Not Able to Hit Target Temperature — What To Do

Situation: Customer had an available 100kW/1kHz inverter and needed to heat 1-in.-diameter carbon steel bar to hot working temperature (2000°F). It was a low production application and cycle time was not critical. However, regardless of the heat time and irrespective of using maximum available output power, it was not possible to reach required target temperature. Actually, after reaching about 1470o°F there was no noticeable temperature rise regardless of increased heat time.

Solution: Severe eddy current cancellation was responsible for a failure to reach target temperature. The use of frequencies 6 kHz and greater can easily help to accomplish the goal. As a simple “rule-of-thumb,” in order to provide an efficient heating and avoid eddy current cancellation in through heating applications (e.g., through hardening or hot working), it is necessary to choose a frequency that will guarantee that the “bar diameter-to-penetration depth” ratio exceeds 3.6 at a target temperature.

(Dr. Valery Rudnev, FASM, Fellow of IFHTSE/Professor Induction/Director Science & Technology, Inductoheat Inc., An Inductotherm Group company)


Heat Treat Tip #43

Brick to Fiber to Avoid Thermal Shock

Thermal shock is a regular issue with hard refractory and brick-lined furnaces due to the constant changes in temperature for batch annealing. Switching an old furnace over to ceramic fiber is an easy process that can save time and money.

(Chiz Bros)


Tips #13 – 23 – 33 – 43 Read More »