No matter what causes poor quality and adds to your waste, scrap, and rework, the result is the same: it ties up resources, wastes time, and costs money. Reducing scrap and rework must be a priority in dealing with your quality control issues.
To drive consistent and sustainable yield, you must create a seamless workflow and understand the role that it plays in throughput, yield, energy, and quality control issues.
In this Technical Tuesday feature written by Bluestreak | Bright AM, learn about common mistakes that lead to quality control issues.
1. Misunderstanding Product Specifications
Information disconnects related to job processing are all too common and problematic. If part-processing specifications aren’t effectively communicated to everyone in the production chain, mistakes canwill happen. Paperwork can get lost or be outdated. Change orders may not be updated and communicated all the way to the individual frontline operator level. Corrective actions might be taken one time, but fail to become part of the standard operating procedures, as sometimes they should be.
Each of these avoidable quality control issues is solvable by creating an integrated end-to-end solution for production control, with everyone using the same database of information in real time.
2. Using Improper Tools
A common problem that will create quality control issues is when the wrong tools or improperly calibrated tools are used, including:
Equipment, furnaces, etc. that are not appropriate for the job
Equipment/machines that do not comply with the appropriate specification requirements
Machines and equipment that are not maintained properly (or timely)
Employees who are not qualified/certified/trained to operate a furnace or piece of equipment
Testing tools that are inadequate
3. Using Manual Processes
Exceptio probat regulam in casibus non exceptis. This Latin phrase translates to, “The exception confirms the rule in cases not excepted.” But you may be more familiar with the colloquialism, “lost in translation.” When you’re doing things manually, it’s easy for critical details to be either overlooked or lost in translation.
Quality control issues are extremely difficult to manage (and document) when you’re doing things via mostly manual processing. Your processing system must allow for capturing the appropriate information throughout the entire work order operation steps.
4. Failing to Plan
Failing to adequately plan out your work or using generic institutional knowledge, rather than your own actual production facility facts and operational data to make decisions, can lead to waste and ineffective decision-making.
Planning should include having an eye on continuous improvement in every department and production work center. Proper prior planning precludes poor performance (the 6 P’s of planning). This cannot be done unless you have the right system in place. One that provides the right information to the right people at the right time and collects the right information (in real time) as the work is being done.
5. Failing to Document
Companies that effectively improve their overall quality, reduce rework, and improve throughput and equipment utilization involve everyone in the production chain to document and evaluate each step in your processes. Bottlenecks and the cause of continuous processing errors cannot be determined and alleviated without properly documenting what actually happens in each step of processing.
It is crucial that you have an effective heat treat-specific manufacturing execution system and quality management system (MES/QMS) implemented in your organization that successfully addresses all five of these more common quality control issues. Also, using electronic job travelers (work orders) will reduce the amount of error-prone paper documents that flow throughout your production facility, while allowing your operators to enter the required information that feeds continuous improvement and verifies/validates compliance adherence. Additionally, outside auditors are always looking for better and meaningful documentation for your various production processes.
How to Tell If Your Quality Control Plan Is Failing
Unacceptable levels of scrap and rework may be two of the most obvious signs, but there are other warning signs that you should look for that indicate that your quality control plan needs work.
These include:
Missed deadlines and budgets
Higher than normal maintenance and/or support costs
Defect related repairs or rework
Failed audits (or too many audit findings)
Customer complaints
Failure to meet customer demands (or compliance with specification requirements)
These are often symptoms of an inefficient quality control and production Process. You’ll need to attack the root cause of the symptom if you expect to effectively change things. Don’t just mask the symptoms with temporary workarounds.
And don’t continue to ‘limp’ along with inadequate production control and quality management systems when, deep down inside, you know your business needs a better software system implemented as soon as possible. When the quality control plan is flawed (or lacks individual operator accountability), your operation ultimately pays the price.
Practice Proactive Quality Control
An integrated quality control/quality assurance system helps you better manage the many service-based heat treating processes for many different types of parts and sets the stage for continuous improvement. If you wait to react until problems become obvious, it’s too late, and you may have already lost a key customer to your competition. Reducing quality control issues requires a proactive approach.
Conclusion
Avoiding quality control issues within the various types of heat treat processes requires a proactive approach. Look for early warning signs, and take steps to make changes before they grow into bigger problems.
It’s essential to look at quality control issues holistically. Examine the entire production process from start to finish, analyzing each step along the way. It can be extremely challenging when you’re doing things manually on spreadsheets or utilizing software that’s been adapted from another industry. That’s because using the wrong software, i.e., ERP/MRP systems where the primary focus is inventory management or other outdated systems, typically requires expensive customizations (if they are even possible) to adequately handle the various heat treating workflow requirements.
About the Author: Bluestreak’s QMS was designed 15 years ago exclusively for the heat treating industry to drive quality control management from the front office directly to the production floor, with additional functionality added monthly, based on heat treat customer feedback. For more information, contact Bluestreak.
"SLM"? You may have heard of AM -- additive manufacturing -- but how about selective laser melting, SLM? Stay on top of your acronyms with this overview on how vacuum furnaces and SLM, an AM technology, can increase fatigue performance of parts.
In this Technical Tuesday, the author not only shares what this technology can do, but also the results of SLM in laboratory studies and research at the University of Parma.
"When SLM processes are conducted within a vacuum heat process, it is possible to make more detailed components which have more intricate forms. Crucially, this means that they will often perform better than would otherwise be the case when they are in use."
Hot isostatic pressing (HIP) has been a player in heat treating for 50 years, but recent advances in its technology are providing cutting edge opportunities for new applications in the thermal processing industry.
Heat Treat Today asked two experts in the HIPing world about the state of hot isostatic pressing: What are the latest technologies and where are its potential growth markets in the thermal processing industry? They represent both sides of HIPing – one from a HIP equipment manufacturer and the other from a HIP process/service provider. Each gives a unique perspective on the HIP market and the industry itself.
Our expert contributors are Chad Beamer, an applications engineer in Hot Isostatic Pressing, at QuintusTechnologies, a high pressure technology company, and Derek Denlinger, a corporate lead metallurgist at Paulo, a thermal processes and metal finishing operations company. This Original Content Technical Tuesday article was taken from 2020 Q4 Heat Treat Todayprint magazine.
What is HIP?
Derek Denlinger Corporate Lead Metallurgist Paulo
Paulo’s Derek Denlinger says, “Hot isostatic pressing is fundamentally, when parts simultaneously see high temperature (in some cases as much as 2500oF) and very high pressure (up to 30,000psi) from all directions for a duration of time.”
Chad Beamer Applications Engineer – Hot and Cold Isostatic Pressing Quintus Technologies LLC
Chad Beamer of Quintus adds, “Pressure-based compaction processes can be used to establish density by applying a uniaxial pressure within rigid dies. Such mechanical or hydraulic approaches can produce non-complex parts or ‘green’ compacts. Although a cost-effective and high-throughput technique, these conventional presses exhibit geometrical limitations and compressibility constraints, yielding product that is not uniform in density and microstructure.”
“Isostatic pressing was developed with the desire to improve upon these shortcomings,” continues Beamer. “Such compaction techniques leverage Pascal’s law by using a fluid contained in a pressure vessel, either in the liquid or gas state, to transmit equal pressure in all directions on the surface of a workpiece.”
Beamer further explains, “Various isostatic pressing techniques exist today such as cold isostatic pressing (CIP), warm isostatic pressing (WIP), and hot isostatic pressing (HIP). HIP is a heat treatment process that utilizes isostatic pressure via a gas at high temperatures. It is commonly used to consolidate metal or ceramic powder and to reduce defects present in castings and additively manufactured parts. The output is a product with improved mechanical properties, workability, and reliability.”
Pore eliminated before and after HIP process
What happens in the HIPing process?
Denlinger explains, “In the HIPing process, parts are heated to a temperature high enough to weaken material strength. High pressure, usually applied through a pressurized gas medium such as argon, applies a compressive stress onto the part from every direction. Given a hold period of time, this compression effectively allows for internal voids or pores to close up due to a mixture of mechanical deformation, creep, and metallic diffusion. The part consolidation sets the stage for any other heat treatment that may follow in order to maximize material performance.”
Since the densification of the workpiece is achieved by the simultaneous application of pressure and elevated temperature during HIP, Beamer adds, “Temperatures are usually in the range of 900oF-3600oF (500o-2000oC) depending on the material being HIPed. A good rule of thumb is a temperature targeting approximately 80% of the materials solidus temperature. Pressures in the vessel can reach twice that of the pressure at the bottom of the Mariana Trench, generally in the range of 15,000-30,000 psi (100-200MPa). The combined temperature and pressure applied should be capable of exceeding the yield strength of the material.”
Latest HIP Technologies
Both Beamer and Denlinger share optimism about the new HIP advancements, especially the new high pressure heat treatment (HPHT).
Beamer states, “A recent development in HIP technology is the ability to perform rapid gas cooling and quenching in the HIP system. Originally developed to shorten cycle time, this advancement is now being leveraged to perform many of the standard heat treatments for metals in the HIP furnace. Now a single piece of equipment can be used to apply both HIP and heat treatment, all carried out in one cycle. This approach is referred to as high pressure heat treatment (HPHT). Benefits to this new treatment include:
the ability to remove an additional process step and piece(s) of equipment
more cost-effective manufacturing path
fewer times a component must be heated up
less time spent at elevated temperature
elimination of the risk of thermally induced porosity (blistering) in additively manufactured parts
“These modern systems are continuing to evolve with other promising advancements such as steered cooling. This controlled cooling approach within a HIP vessel allows cooling rates for a component to be optimized in order to achieve the desired microstructure. These advancements are quite exciting for many industries as they are expanding the design windows for material systems and creating new opportunities within a HIP system.”
“HIP has been around commercially for around 50 years,” Denlinger points out, “but more recent technology has been focused on better control of thermal aspects of the process. This is opening the doors for more fine-tuned ‘high pressure heat treatment’ processing that can offer speed and, in some cases, performance benefits that were previously not possible. These types of processes have often been coupled with the ever-growing additive manufacturing processes, though applications to more traditional manufacturing methods are gaining momentum. The influence of pressure on diffusion and transformation in materials has been identified, but not fully explored for many alloys, so new high pressure heat treatments are now being considered to compete with traditional HIP and heat treatment methods.”
What is HIP’s niche in the thermal processing industry? Who are its customers? Where do you see potential growth markets?
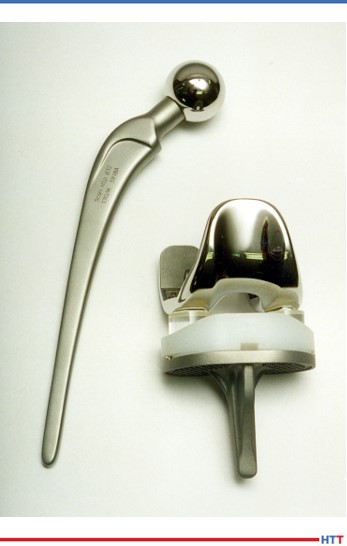
HIP implants
According to both men, the future is bright for HIPing.
Beamer explains why specific industries choose HIPing: “HIP is often desired where the risk of failure is not an option. Therefore, it is not surprising that HIP is commonplace in aerospace, energy, and medical industries. Applications within these industries include densification of products, consolidation of powder, diffusion bonding, as well as HPHT. For the aerospace industry, HIP is used to remove porosity from nickel-base and titanium-base castings as well as defects present in additively manufactured parts. The medical industry applies HIP to improve the quality and durability for cobalt chrome and titanium implants. HIPing of large and complex near-net-shape powder metal components to achieve fully densification is routine in the energy industry.”
Denlinger agrees, “HIP has most often been used for fatigue benefits, which is an important performance criterion in the aerospace industry. This remains in the scope, but applications in other sectors are growing due to the adoption of additive manufacturing. Oil and gas, medical, manufacturing equipment, space, firearms, and other industries are increasing their use of HIP and high-pressure heat treatment. Partnering with companies to explore additive manufacturing solutions with both HIP and traditional heat treatment in our arsenal has been very successful; challenging the status quo with the latest HIP technology and our expertise in heat treatment has been a great learning experience.
Regarding market expansion for HIP, Beamer shares, “Potential growth markets for HIP include medical, defense, space, automotive and the ongoing developments with additively manufactured applications. The medical industry is showing growth with an aging population coupled with a cultural shift to living a more active lifestyle. Another trend within the medical industry is to insource HIP versus going through a supplier, which can offer process optimization opportunities and increased quality control.”
The future of HIP technology is likely to include the automotive industry.
Beamer continues, “Growth for HIP in the defense industry can be attributed to strong government funding, such as the development work being done through America Makes. One of the most exciting growth markets here in the US is space, in which many high-profile companies are showing interest in HIP and HPHT technologies.
“Although the HIP process is not typically characterized as a high-volume process,” Beamer concludes, “the automotive industry is finding its benefits useful for cast engine blocks and emerging technology such as binder jet applications. Despite the present challenges due to the Covid-19 pandemic, specifically within the civil aerospace industry, there are many exciting growth opportunities for HIP.”
(All photos in this article provided by Quintus Technologies)
About the Authors:
Chad Beamer has a MS from the Ohio State University in Material Science and has worked as a material application engineer with GE Aviation for 7 years and as a technical services manager with Bodycote for 5 years. In February, Chad began working with Quintus Technologies as an application engineer for the Advanced Material Densification division focusing on hot isostatic pressing (HIP). As an applications engineer, he manages the HIP Application Center located in Columbus, Ohio, educates on the advancements of HIP technologies, and is involved in collaborative development efforts both within academia and industry.
Derek Denlinger is the corporate lead metallurgist at Paulo. Derek has a Bachelor of Science in Metallurgical Engineering from Missouri S&T in Rolla. He started in the foundry industry before transitioning to heat treatment at Paulo where he has been for the past 5 years. The past two years, Derek has been focused on additive manufacturing and hot isostatic pressing assisting with Paulo’s entry into the HIP market.
CQI-9 compliance demands adherence to the standards for the purpose of excellence in automotive heat treating. Poorly maintained quench oil can cost heat treaters in many areas.
In this Heat TreatToday Technical Tuesday feature, Greg Steiger, senior key account manager at Idemitsu Lubricants America, shares how costly quench oil issues can be addressed through proper adherence to the CQI-9 quench oil testing protocols. Let us know if you’d like to see more Original Content features by emailing editor@heattreattoday.com.
Greg Steiger Sr. Key Account Manager Idemitsu Lubricants America
Introduction
A poorly maintained quench oil can cost a heat treater in more ways than simply the cost of having to replace the oil. The costs can quickly expand to include those associated with poor quality. For example, costs associated with part rejects, or rework and downstream costs for shot blasting, or third-party inspection are often the cause of poor quench oil maintenance. Dirty or poorly maintained oils can affect part cleanliness, surface hardness, and surface finish. For instance, it is well known that a heavily oxidized oil may create surface stains that must be shot blasted to remove. High molecular weight sludge or excessive water can create surface hardness issues. Many of these issues can be addressed through proper adherence to the quench oil testing protocols established by CQI-9.
How can CQI-9 help?
CQI-9 is designed as a tool to help heat treaters produce consistent parts. Using a CQI-9 compliant quench oil analysis can also be a very powerful tool in a heat treaters tool kit. Just as the level of carburization is influenced by the carbon potential of a carburizing atmosphere, the cooling speed of the oil influences microstructure formation and microstructure composition along with mechanical properties such as hardness as well as tensile and yield strength. Furthermore, the cooling speed is dependent upon the viscosity of the oil, the amount of sludge, moisture level, and oxidation of the oil. All of these are tested on a regular basis under the requirements of CQI-9, ISO TS 16949, and most quality systems adopted by modern heat treaters. All of the tested parameters required under CQI-9 will be addressed individually later in this paper.
What is CQI-9?
The member companies of the Automotive Industry Action Group (AIAG) encompassing automotive manufacturers and their Tier I suppliers have enacted an industry heat treating standard called CQI-91. This standard was originally a standalone standard designed and adhered to primarily by North American OEMs and Tier I suppliers as a quality tool to create consistent documented processes within the heat treating industry with the goal of producing consistent reproducible results. Since that first implementation of CQI-9, the standard has now been incorporated into the ISO TS 16949 standard and is now adhered to by most automotive OEMs and their Tier I suppliers. The full range of management responsibilities, material handling, and equipment operations of the CQI-9 standard is beyond the scope of this paper. Instead we will be discussing the used quench oil analysis requirements of CQI-9, why the tests are required, and how heat treaters need a CQI-9 compliant quench oil analysis to properly care for their quench oils.
Utilizing a compliant CQI-9 analysis and the supplier provided operating parameters for the CQI-9 required tests is the first step in the proper care of a quench oil.
CQI-9 Compliant Analysis
Most quench oil suppliers provide a quench oil analysis. Although the quench oil supplier may provide a quench oil analysis, for the analysis to be CQI-9 compliant the analysis must contain the following tests or their equivalent:
Water content; ASTM D6304
Suspended solids; ASTM D4055
Viscosity; ILASD509
Total acid value; ASTM D664
Flash point; ASTM D92
Cooling curve; JIS K2242
The frequency of the above testing must be a minimum of semiannually. A more frequent sampling interval does not violate CQI-9. In fact, the more often a quench oil is analyzed, the easier it is to use the quench oil analysis as a tool in the proper care of a quench oil. It is important to note that the CQI-9 standard does not prescribe specific test methods be used in the above testing; however, they must be performed to a traceable standard. The CQI-9 standard only states that the above values, along with a cooling curve, must be reported. The following sections will describe each test in a CQI-9 compliant analysis.
Water Content
Everyone knows water in a quench oil can be have catastrophic safety and performance consequences. However how much water is too much? That is a question that is difficult to answer. The answer depends on a variety of factors such as the quench oil used and all of the variables associated with a furnace atmosphere. A general rule of thumb when it comes to water levels is to keep the water level below 200PPM. At levels above 200PPM of water, uneven cooling begins to occur.2 It is important to remember a quench oil is not a pure homogenous fluid. Samples taken at various places throughout the quench tank will be similar but will also have differences. These differences will include water and solids levels. Therefore, in areas where the water content exceeds the 200PPM level, uneven cooling will begin. Parts coming into contact with this “localized” quench oil with high water can potentially begin to crack, have a high surface hardness, or have staining problems. Yet parts in other areas of the load continue to behave normally. For this reason, and also because water is much heavier than oil, it is imperative the oil be under agitation. In addition to the potential uneven cooling issues high water may create, a high level of water can also influence the rate of oxidation in an oil.
Suspended Solids
Because solids are typically denser and more viscous than liquids they do not have the same heat transfer properties as a liquid. Due to the inequality of heat transfer capacities between liquids and solids, it is very important to keep the solids level, especially high molecular weight sludge, at a minimum. Sludge reacts in an opposite manner of water. Where water can increase quench speed, high molecular weight sludge will decrease quench speed through uneven cooling.2 The result of the uneven cooling from sludge is typically seen in soft surface microstructures or soft surface hardness. Also, like water, sludge is heavier than oil and the lack of homogeneity in the oil means having proper agitation is paramount when sampling.
Viscosity
Changes in viscosity can lead to both faster quench rates and slower quench rates. As the quench oil is used in the quench process, it undergoes thermal degradation.3 This degradation process can be seen when the oil becomes thinner or less viscous. During this process, a small portion of the base oil and a small amount of the quench oil additives undergo a process called thermal cracking. In this process, heavier molecules are broken into smaller molecules through the use of heat. This thermal cracking creates lighter less viscous oil from heavier oils. The newer lighter viscosity of the quench oil can potentially lead to changes in the quench speed of the oil. These changes can have an impact on the microstructure, case depth, core hardness, and surface hardness on the quenched parts.
As an oil is subjected to the high temperatures of a quenching operation, oxidation is a natural occurrence in the oil. As the oil oxidizes it will begin to increase in viscosity until it reaches the point of forming an insoluble sludge. Therefore, an increase in viscosity typically means the oil is oxidizing. Just as an oil that becomes thinner and less viscous may have a change in cooling properties, an oil that becomes thicker and more viscous may see a change in cooling performance. A thicker oxidized quench oil may affect surface hardness, microstructure, case depth, and core hardness. In severe cases of oxidation staining may result. Such stains typically require post quench and temper processing such as shot blasting.
Total Acid Value
The Total Acid Value, or TAV, is a measure of the level of oxidation in a quench oil. The amount of oxygen in a quench oil cannot be measured without a sophisticated laboratory analysis. However, the formation of organic acids within a quench oil can be easily determined via a titration method. It is well understood that these organic acids are the precursors in a chain of chemical reactions that will eventually form sludge. As the TAV increases so will the levels of oxidation, and in turn, the amount of sludge will also increase. Consequently, as the TAV increases, the amount of staining due to oxidation may increase. The cooling properties of the oil may decrease due to the increased sludge formation as well. Figure #1 shows an example of how the acid value increases the viscosity of a quench oil due to the formation of polymeric sludge in the quench oil.2
Figure #1. Acid number vs kinematic viscosity for Daphne Hi Temp A
Flash point
The flash point of a quench oil is another check to ensure the safety of the quench oil user. As oil thermally cracks, the heavier base oils become not only lighter in viscosity, but their flash points also decrease. If left unchecked, the decrease in flash point could result in a higher risk of fire. In addition to serving as a watchdog against the results of excessive thermal cracking, a flash point is also a safeguard against human error and adding the wrong quench oil to a quench tank. High temperature oils typically have a higher flash point than conventional oils. An increase in flash point, along with no change in TAV, and an increase in viscosity could indicate a contamination issue between oils has occurred.
Cooling curve
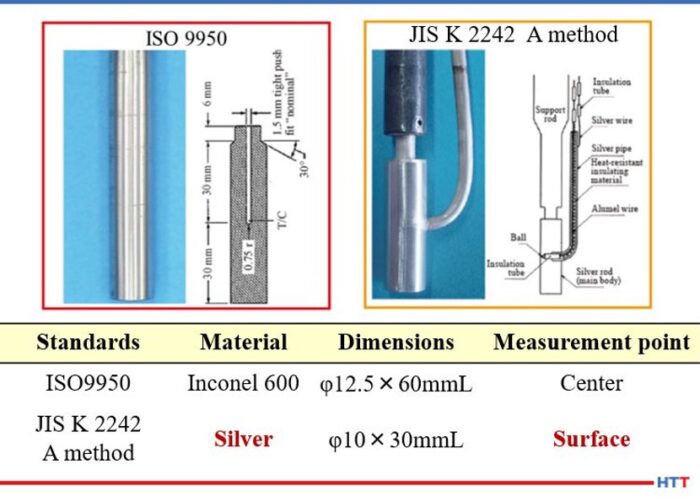
There are many different methods of running a cooling curve. Many Asian suppliers of quench oil will use the Japanese Industrial Standard (JIS) K 2242. European suppliers will use the ISO 9950 and North American suppliers rely on the ASTM D 6200 method. All of these standards measure the same basic property, the ability of an oil to reach martensite formation. However, they differ in one basic item. The JIS K-2242 and methods used in China and France use a 99.99% silver probe that is smaller than the size of the Inconel probe used in the ASTM and ISO methods of Europe and North America. Because of this difference, it is important to note that cooling curves and cooling rates between the methods should not be compared. Figure # 2 shows the comparison between the two probes and their dimensions.
Figure # 2. ASTM D-6200/ ISO- 9950 and JIS K 2242 quenchometer probes^2 ISO/ASTM Inconel probe 12.5mm x 60mm. JIS K 2242 Silver probe 10mm x 30 mm
In addition to comparing the cooling curve against the standard for the quench oil used, the Grossman H value should also be calculated and used as an indicator of cooling performance. Unlike the old GM nickel ball test that tracked the time to cool a 12mm nickel ball to 352°C, the Grossman H value measures the severity of the quench6.
In using the Grossman H value, the lower the value, the slower and less severe the quench. For use as a rough guide in comparing the quench speed in seconds to the Grossman H value measured in cm-1 the table below can be used.
Table #1
For example, air has an approximate H value of 0.01 cm-1 and water has an approximate H value of 0.4 cm-1 compared to oil with an approximate H value of ___ cm-1
The calculation used to determine the Grossman H factor has historically been:
H=h/2k
Where h is the heat transfer coefficient of the part when measured at the surface of the part and k is the thermal conductivity of the steel. Typically the heat transfer coefficient is measured at 705°C. A steel’s thermal conductivity does not typically change according to alloy composition or temperature. Therefore, the Grossman H value is proportional to the heat transfer coefficient of the part.
Interpreting a CQI-9 quench oil analysis
Table #2
Discussion
In examining the test parameters for CQI-9, it becomes apparent that many of the test results should be compared with other test results. For example an increase in the amount of sludge or solids should also increase the viscosity of the quench oil. As the sludge increases, the level of oxidation increases, and therefore, the level of organic acids formed in the quench oil should be increasing the TAV. Finally, as the sludge increases, the cooling property of the quench oil should decline as indicated in the lower H value.
Figure #3. Total Acid Value (TAV) and Grossman H value
Likewise, as the flash point decreases the amount of thermal cracking is increasing, which should reduce the viscosity and thereby increase the H value and the overall cooling speed of the quench oil. Conversely, if the test parameters are not working in concert with each other, there may be other issues going on within the quench oil. For instance, an increase in the water content can be detected before the increased water levels begin the oxidation process thereby increasing the TAV. Or a viscosity change without a change in other parameters could be an addition of the wrong quench oil to the quench tank. The graph below for Idemitsu Daphne Hi Temp A helps illustrate this point.
Figure #4. Graph for Idemitsu Daphne Hi Temp A demonstrating viscosity change
In the graph above, it can be seen when the water H value increases and the viscosity remains stable, the likely explanation is an increase in water. When both the H value and viscosity decrease, additive consumption is the most likely reason. Likewise, when the viscosity increases and the H value decreases, the formation of sludge from oxidation is the culprit.
Having test parameters that work in conjunction with each other is only beneficial if sample frequencies are often enough. While CQI-9 only stipulates a semi-annual sampling frequency, the conditions of a quench tank can change in very short order. There are the obvious changes when water is added to the tank. However, many of the changes are more subtle, and left unchecked over time can create potential costly solutions such as a partial dump and recharge of the quench tank, poor part quality, or an increase in downstream processing such as shot blasting. For this reason, many quench oil suppliers request a minimum of quarterly sampling. In addition, if a sample is missed on a quarterly sample frequency, there is still time to sample the quench tank and remain in compliance with CQI-9.
Conclusion
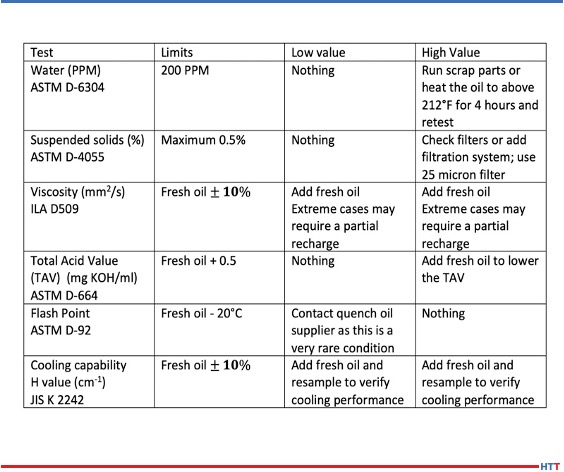
Over time the condition of a quench oil will change and corrective measures will be needed to bring the quench oil back into the suggested supplier’s operating parameters. The chart below helps understand what some of the methods need to be.
With proper care and maintenance, a quench oil can last a very long time. A conventional oil should last 10 to 15 years or longer while a marquench oil should last seven to 10 years. The proper care of a quench is simple and straight forward. A quality quench oil should not need the use of additives to improve oxidation resistance or quench speed. Simply adding enough fresh virgin oil to replace the oil that is being dragged out through normal operations should replenish the oxidation protection and quench speed to within the normal operating parameters. The table below offers recommendations for treating out of normal operating parameters for the required CQI-9 tests.
Recommendations for treating out of normal operating parameters for the required CQI-9 tests
Most heat treaters make weekly quench oil additions to their quench tanks. The most popular type of filtration system is a kidney loop style where the quench oil is constantly filtered. There are two basic types of these systems. They differ in the number of filters used. For a single filter system, a 25 micron filter is sufficient for quench oil filtration. In a two-stage filtration system, a 50 micron filter is typically used in the first stage and a 25 micron filter is used in the second stage. In a two-stage filter, the cheaper 50 micron filter will be replaced more often than the 25 micron filter in the second stage.
Utilizing a compliant CQI-9 analysis and the supplier provided operating parameters for the CQI-9 required tests is the first step in the proper care of a quench oil. The next basic steps are ensuring there is enough fresh quench oil available for regular additions to replace the oil that is lost through drag out and proper filtration of the quench oil in a constant kidney loop type of a system. With these steps in place, a quench oil will offer consistent performance for years and will be one less concern heat treaters face in the operation of their furnaces.
References:
Automotive Industry Action Group, “CQI9 “Special Process: Heat Treatment System Assessment;” AIAG version 3, 10/2011.
M.A. Grossman and M. Asimov. Hardenability and Quenching. 1940 Iron Age Vol. 107 No.17 Pp 25-29.
About the Author:
Greg Steiger is the senior key account manager of Idemitsu Lubricants America for quench products. Previous to this position, Steiger served in a variety of technical service, research and development, and sales marketing roles for Chemtool, Inc., Witco Chemical Company, Inc., D.A. Stuart Company, and Safety-Kleen, Inc. He obtained a BSc in Chemistry from the University of Illinois at Chicago and is currently pursuing a Master’s Degree in Materials Engineering at Auburn University. He is also a member of ASM International.
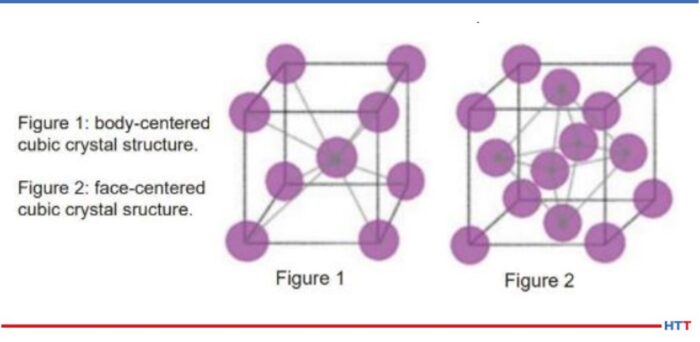
Graphic of Atomic Structures (Photo Source: AHT Blog post “What’s Happening to Metals During Heat Treatment”)
For this Heat TreatToday Technical Tuesday, check out this Best of the Web primer if you are looking to share a few basic pieces of heat treat info with your trainees. These heat treat fundamentals are about what happens to metals in the heat treatment process, tracing steel heat treating back to the ancient Romans in 223 B.C. — though, Encyclopedia Britannica currently places the origins in Egypt by 900 BC. Heat treatment benefits, atomic structural transformation, and hardenability are all covered here.
An excerpt: “Not every steel reacts the same. Chemical composition can vary greatly between the different grades of steel. Certain alloying elements can greatly increase the hardenability of steels such as nickel (Ni), chromium (Cr) and molybdenum (Mo). Hardenability is not how hard a material is. Hardenability directly relates to the ability of a metal to form martensite and martensistic [sic.] structure upon quenching, which points to…”
Heat treaters have their processes down to a science, literally. But what factor can compromise your heat treated part, let alone possibly cause detrimental damage to your facility?
Greg Steiger Sr. Key Account Manager Idemitsu Lubricants America
Michelle Bennett Quality Assurance Sr. Coordinator Idemitsu Lubricants America
Heat TreatToday is pleased to present this original content article for today's Technical Tuesday. Greg Steiger, senior key account manager at Idemitsu Lubricants America, and Michelle Bennett, quality assurance senior coordinator at Idemitsu Lubricants America, describe water contamination in quench oil, the effects of this contamination, and how to test and safely remove the water from the quench oil.
Introduction
Water is an amazing substance. Water helped create the Grand Canyon and Niagara Falls. When water freezes, it doesn’t contract like most materials. Instead, it expands and creates potholes that swallow up our cars every winter. As the temperature rises, water also expands. This property allows water to heat our homes and is why steam engines work. The thermal expansion of water as it turns into steam is what can create catastrophic events in a quench oil. This paper will look at potential water contamination sources in a quench oil, what the effects of the water can be, how to test for the presence of water in a quench oil, and how to safely remove the water from a quench oil.
Sources of water contamination
There are two major classifications of potential water contamination. The first source can be classified as potential internal sources of water. These potential sources are typically a part of heat treating furnace or oil cooling system. They include water-cooled bearings, fans, doors or heat exchangers. These water-cooled components are under a contestant pressure and will eventually leak. Because the quench tank is usually below these sources of water, the water will eventually find its way into the quench tank. Water-cooled bearings and fans are located within the furnace and are often directly above the quench tank. While a water-cooled door is typically not directly above a quench tank, it is in close proximity to the quench tank. This proximity will allow leaking water to enter the quench tank. Heat exchangers are typically situated away from the furnace. However, in a water-cooled heat exchanger, the water is never more than the wall thickness of the cooling tubes away from the oil. Should a cooling tube form a leak, the water and quench oil would simply mix within the cooling stream and the quench oil water mixture would return to the quench tank.
"The greatest risk of external water contamination lies in preventable operator or maintenance mistakes, especially when the equipment is down and open for maintenance."
The second classification is external sources. These sources of water contamination are not part of the heat treating furnace. Examples of external sources can be further broken down into leaks and operator or maintenance personnel mistakes. Leaks typically include fire extinguishers and fire suppression systems leaks, leaking fire resistant hydraulic systems, atmosphere leaks, pneumatic cylinders and building leaks. To prevent the leak type of contamination, routine maintenance, like a daily “Gemba” walk to spot any leaks, is the best defense against water entering a quench oil through a leak. The greatest risk of external water contamination lies in preventable operator or maintenance mistakes, especially when the equipment is down and open for maintenance.
Quite often when a furnace undergoes repairs, the quench oil is pumped out into empty totes to be reused after the furnace repair is finished. There is nothing wrong with doing this if the totes are clean. However, there have been reports of heat treaters doing this without first inspecting the totes to ensure that they are clean and free of any type of contamination. There have also been instances when the totes were not properly sealed and then stored outside, thus allowing rain water to get into the quench oil. But, the potential to add an incorrect product to the quench tank is a preventable operator error.
How water affects a quench oil
As previously mentioned, water expands as it turns into steam. At 212°F, water has a density of 0.96g/cm3.1 One gallon of water occupies 0.14 ft3. At one degree above boiling the steam from the boiling water has increased to occupy 224 ft3 and a density of 0.0006 g/cm3. The thermal expansion rate of water is approximately 1600%. What this means is the single gallon of water that was in the quench oil before it turned into steam now has a volume approaching 1600 gallons. In order for the 1600 gallons of steam to escape from the quench tank, it must displace an equal amount of quench oil. With nowhere to go, this displaced oil will find hot spots and open flames to create a catastrophic event.
Quench severity
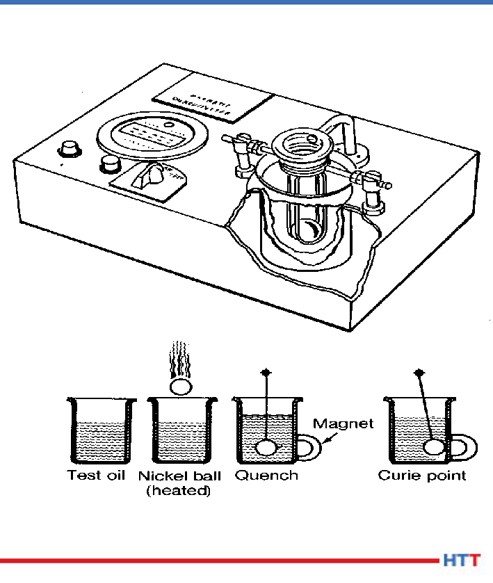
Fig.1 Schematic of ASTM D-3520 (ref. 7)
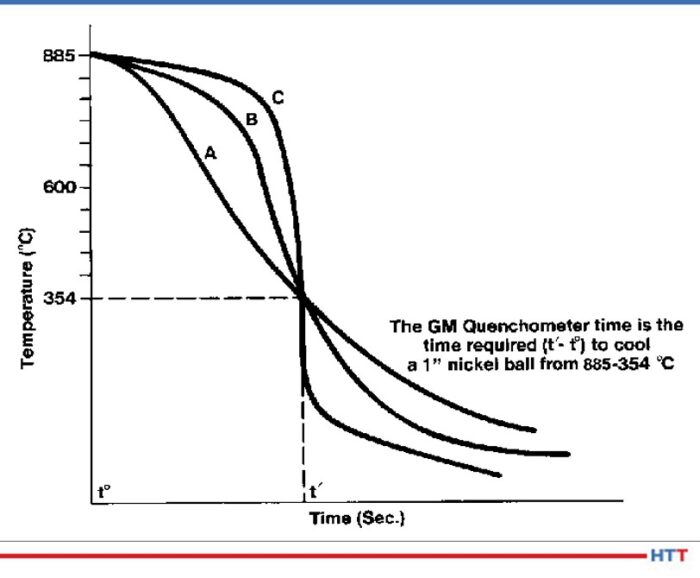
Historically, the severity of the quench has been measured by ASTM D-35202. In this method, a chromized nickel ball is heated to 885°C and is dropped through an electronic sensor, which starts a timer, and into a steel cylinder of quench oil in a magnetic field. Once the chromized nickel ball reaches the Currie temperature of nickel at 354°C, the ball becomes magnetic and closes the timing circuit when the ball comes into contact with the cylinder. The popularity of this test has always been that it provides a number that is easily interpreted by heat treaters to “rate” the oil as fast (9 – 11 seconds), “medium” (12 – 14 seconds), “slow” (15 – 20 seconds) or marquench (20 - 25 seconds). A schematic of the test method is shown in Figure #1.
This test worked well to differentiate between different how well the quench oils cooled the nickel ball. The test really didn’t distinguish between the cooling characteristics of a quench oil. The test result in Figure #2show a time in seconds for the nickel ball to reach 354°C for three separate oils. However, when the actual cooling curves of the oils are examined there are three distinct cooling curves shown.
Fig. 2 Three separate cooling curves with the same quench speed as measured by ASTM D-3520 (ref. 7)
Because mechanical properties such as yield strength and hardness are dependent on the severity of the quench, the Grossman H value3 has become more popular over the years. In using the Grossman H value the lower the value the slower and less severe the quench. For instance air has an approximate H value of 0.01 cm-1 and water has an approximate H value of 0.4 cm-1. The calculation used to determine the Grossman H factor has historically been:
Where h is the heat transfer coefficient of the part when measured at the surface of the part and k is the thermal conductivity of the steel. Typically the heat transfer coefficient is measured at 705°C. A steel’s thermal conductivity does not typically change according to alloy composition or temperature. Therefore the Grossman H value is proportional to the heat transfer coefficient of the part.
Cooling curve
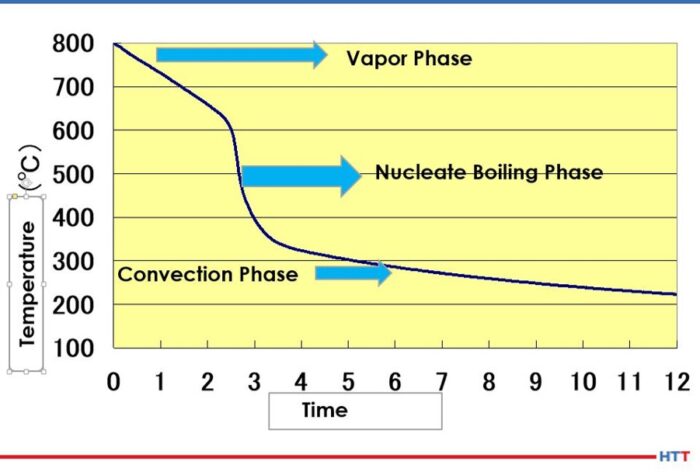
The basic cooling curve consists of three stages: the vapor blanket, nucleate boiling and convection. A basic cooling curve with the three different cooling phases is shown in Figure #3.
Fig.3 Three stage cooling curve (ref. 4)
In the vapor blanket stage, the load and the quench oil coming into contact with the load are above the evaporation temperature of the oil. An insulating vapor blanket forms around the load and no cooling occurs. Because the vapor blanket is insulating and does not allow for cooling, the vapor stage carries the highest risk of distortion.4 Once the vapor pressure decreases to a point where the oil can once again condense on the load and the temperature of the oil falls below the evaporation temperature, the nucleate boiling stage begins. In this stage, the load undergoes the most aggressive cooling. After sufficient cooling has occurred and the quench oil temperature is below the boiling temperature of the oil, a smooth transition into the convection stage begins.
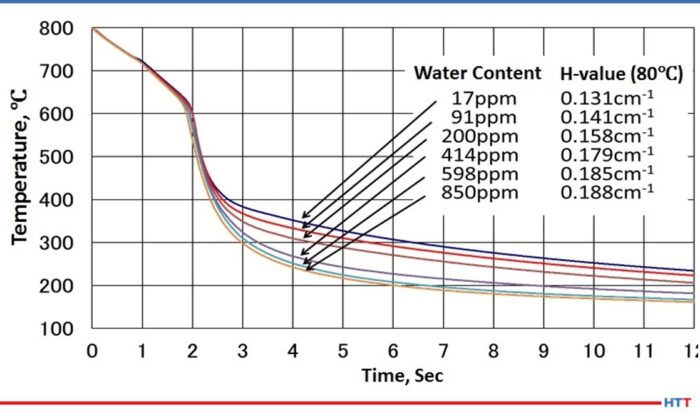
Stabilization of the vapor stage
As water is dispersed throughout the oil, the viscosity of the oil changes. As the amount of water increases, the viscosity of the oil also increases.5 A careful examination of Figure #4 will also show a slight movement of the cooling curve to the left and a lengthening of the vapor stage as the amount of water increases. Furthermore the water in the oil is not uniformly dispersed, and this non-uniform dispersion creates uneven cooling rates throughout the oil. To restore even cooling, it is recommended the water in the quench oil be reduced to below 200 PPM.
Fig. 4 Cooling curve change due to water contamination (ref. 4)
Types of water found in a quench oil
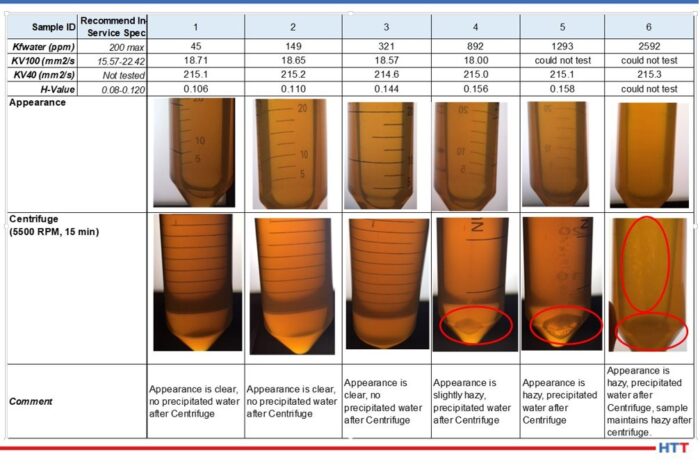
In simplistic terms, water in a quench oil can be thought of as being dispersed in the quench oil due to agitation or as free water having exceeded the saturation point of the oil. As a general rule of thumb in the industry, the saturation point is considered to be 0.1% or 1,000 PPM. However, the saturation point will vary according to the temperature of the oil and the additives within the quench oil. Daphne Hi Temp A-U is a good example of a clear amber quench oil. Figure #5 shows a picture array of the appearance of the oil as the amount of water approaches and then exceeds the 1000 PPM industry standard.
Fig. 5 Daphne Hi Temp A-U appearance as the amount of water dispersed within the oil nears and exceeds the saturation point of the oil. (Used with permission Idemitsu Lubricants America)
Notice in the data above that as the amount of water increases in the Daphne Hi Temp A-U, so does the viscosity as measured at 100°C. In addition to the viscosity rising as the amount of dispersed water increases, so also does the quench severity as measured by the Grossman H value. Furthermore, the appearance of the quench oil changes as the amount of water increases as well. (See Fig. 5 for the Daphne Hi Temp A-U.) With small amounts of dispersed water—45 PPM—the quench oil is clear and there is no water that is precipitated out after centrifuging for 15 minutes at 5500 RPM. However, as the amount of water begins to approach the 1000 PPM level, the appearance of the quench oil begins to become hazy. As the saturation point is exceeded, the appearance remains hazy and water precipitates out after centrifuging for 15 minutes at 5500 RPM.
Testing for oil in a quench oil
There are two basic types of testing methods for determining if there is water dispersed in a quench oil. One of the methods is subjective and the other is quantitative. The crackle test involves heating a metal coupon to approximately 400°F and placing a few drops of the quench oil on the surface. If there is a sufficient amount of water in the oil visible bubbling within the oil and audible crackling will occur. Unfortunately, this is typically above the saturation point of the quench oil. At which point it is often too late. Figure #6 shows examples of crackle testing.
Fig. 6 Crackle test results for Daphne Hi Temp A-U
The second and preferred testing method is through ASTM D-6304 Standard Test Method for Determination of Water in Petroleum Products, Lubricating Oils and Additives by Coulometric Karl Fisher Titration6. The Karl Fisher test uses the Bunsen electrochemical reaction to calculate the amount of water in a used oil and is accurate in used oil from 1 PPM to 50,000 PPM.
Removing water from a quench oil
Removing excessive water from a quench oil can be achieved economically through several methods. Table #1 is a brief trouble shooting guide to the safe removal of water from a quench oil.
Table 1 Trouble shooting guide for removal of water from a quench oil
Conclusion
Finding small amounts of water, less than 50 PPM is very common in a used quench oil sample. This small amount could simply be condensation within the bottle and quench tank. However,when the amount of water begins to reach levels above 200 PPM, troubles can begin. At levels above 200 PPM of water, the following may occur:
Uneven cooling due to non-uniform dispersing of the water within the quench oil
Increase in viscosity
Increase in Grossman H Value
Lengthening of the vapor blanket stage
Increase in the severity of the quench
Like most materials, water expands as it changes from a liquid into a vapor. With a thermal expansion rate of 1600%, a gallon of water turns into considerable more steam. Therefore excessive water transitioning into steam in a quench oil creates safety concerns when the steam forces the quench oil from the tank. Examples of these safety concerns are:
Risk of harm and injury to plant personnel
Damage to furnaces and related equipment
Damage to the heat treat facility the surrounding plant and nearby buildings
Severe cases can result in a quench oil fire or a building fire
The importance of a “Gemba" walk should not be overlooked. Water can enter into quench oil systems through normal heat treating operations such as a leak in a water-cooled piece of equipment, others can be from preventable sources such as a building leak or other human error. No matter what the source is, if water is suspected in a quench oil, the quench tank should be sampled and tested before it is used.
References:
Handbook of Chemistry and Physics. 60th edition CRC Press, p. E-18.
ASTM International, “Standard Test Method for Standard Time of Heat Treating Fluids (Magnetic Quenchometer Method),” American Society for Standards and Materials.
M. A. Grossman and M. Asimov, “Hardenability and Quenching,” 1940, Iron Age Vol. 107 no.17, p. 25-29.
ASTM International, "ASTM D-6304 Standard Test Method for Determination of Water in Petroleum Products, Lubricating Oils and Additives Coulometric Karl Fischer Titration," West Conshohocken, ASTM International, 2016.
B. Lisic and G.E. Totten, "From GM Quenchometer Via Cooling Curve Analysis to Temperature Gradient Method," ASM Proceedings: Heat Treating, 18th Conference, 1998.
About the Authors:
Greg Steiger is the senior key account manager of Idemitsu Lubricants America for quench products. Previous to this position, Steiger served in a variety of technical service, research and development, and sales marketing roles for Chemtool, Inc., Witco Chemical Company, Inc., D.A. Stuart Company, and Safety-Kleen, Inc. He obtained a BSc in Chemistry from the University of Illinois at Chicago and is currently pursuing a Master’s Degree in Materials Engineering at Auburn University. He is also a member of ASM International.
Michelle Bennett is the quality assurance senior coordinator at Idemitsu Lubricants America, supervising the company's I-LAS used oil analysis program. Over the past 9 years, she has worked in the quality control lab and the research and development department. Her bachelor’s degree is in Chemistry from Indiana University.
Jim Grann, Technical Director, Ipsen (photo source: www.ipsenharold.com)
We all like to make savvy commercial decisions, in fact, Heat Treat Today’s 101 Heat Treat Tips on page 20 of this digital magazine is a great example of tips that can save you time and money. But will it pay off to use your conventional vacuum furnace for aluminum brazing?
Questions involving safety, effectiveness, and quality might come to mind with this proposal. Before implementing such a strategy, head over to Heat Treat Today’s best of the web Technical Tuesday article by Jim Grann, technical director at Ipsen. He tackles the components of aluminum brazing versus the capabilities of conventional vacuum furnace as well as detailing some of risks that can happen if you do try to use your conventional vacuum furnace for aluminum brazing.
An excerpt: “By nature, vapor pressure aids in the depletion of magnesium and parent aluminum alloys in high vacuum, depositing magnesium onto the hot zone and into the shielding… Proper vacuum aluminum brazing requires special components that standard vacuum furnaces generally do not have, including…”
Dr. Steve Offley, Product Market Manager, PhoenixTM
Knowing the precise temperature from within your continuous heat treat process is now possible. In this Heat Treat Today Technical Tuesday article, Steve Offley, “Dr. O,” Product Marketing Manager at PhoenixTM identifies how this innovative temperature profiling system can help you with your continuous aluminum brazing or other processes.
This article appeared in the edition June 2020 edition of Heat Treat Today’sAutomotive Heat Treating magazine.
In the automotive industry, aluminium brazing is key to many of the manufacturing processes used to produce radiators, condensers, evaporators, etc. The quality of the brazing process is important to the performance and product life for its intended function. A critical requirement of the brazing process is the optimization and control of the product temperatures during the complete brazing process. A valuable tool to achieve such requirements is the use of ‘Thru-process’ temperature profiling as a direct alternative to the traditional trailing thermocouples as discussed in the following article. Obtaining the product temperature profile through the brazing furnace gives you a picture of the product/process DNA.
The Basic Brazing Principle and its Temperature Dependence
Aluminium brazing employs the principle of joining aluminium metal parts by means of a thinly clad soldering ‘filler’ alloy, whose melting point is lower than the base/parent metal.
As part of the brazing process, control of the product temperature is critical to achieve selective melting of the filler alloy 1076°F-1148°F (580°C -620°C) to allow it to flow and fill the joints between the parent metal substrate without risk of melting the substrate itself. Often the difference between the melting points of the two materials is small, so accurate temperature monitoring through the entire furnace is critical to the success of the brazing process.
[spacer color="3366ff" icon="fa-lightbulb-o"]
PhoenixTM works with major automotive radiator manufacturer customizing a brazing barrier solution to meet their specific application needs.
PhoenixTM was approached by a major automotive radiator manufacturer in the USA. The manufacturer had a specific need for a reliable CAB brazing monitoring system that would withstand heavy use, approximately 45 runs per week. The two companies collaborated to design a unique barrier solution which was adopted for standard profiling use.
“The new barrier is great; the operators love them. All those design iterations paid off.”
It is estimated that barriers supplied back in 2014, which have seen routine use over five years and are still operational, have accumulated in excess of 2,500 successful profile runs without damage or any wear problems. Over the same period, many conventionally designed barriers have been scrapped due to HF acid damage of cloth and microporous insulation. The customer for this reason has now standardized the TS08 design for all their CAB profiling activity.
[spacer color="3366FF" icon="Select a Icon"]
Critical Challenges of the Brazing Process
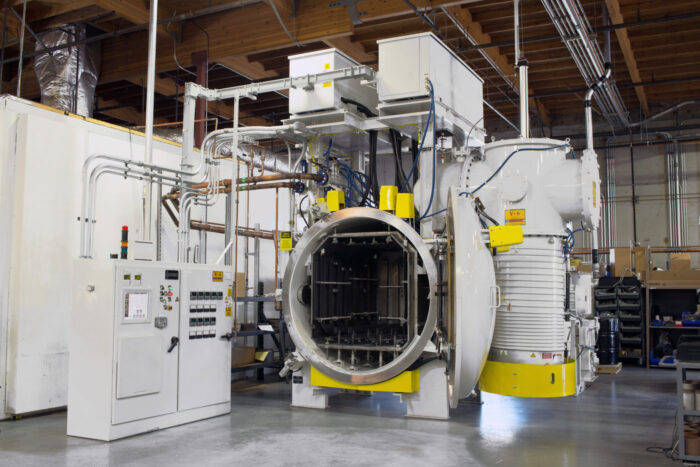
The system enters the continuous aluminum brazing furnace with product being monitored.
Prior to any brazing process, it is important that the substrate surface is prepared correctly to allow the brazing process to work correctly. Surface preparation before brazing may involve thermal degreasing where the substrate temperature is elevated to drive off lubricants. A second more important procedure is the removal of any surface oxide layer to allow wetting, and therefore flow of the brazing filler alloy over the parent substrate. Unfortunately, aluminium is easily oxidized and the resulting aluminium oxide (Al2O3) prevents such wetting processes. Therefore, prior to brazing, the oxide layer needs to be eliminated. In most cases, cleaning of the substrate layer is achieved by the application of a corrosive flux, which in a molten state, dissolves the oxide layer.
A data logger with 10 thermocouple channels.
The type of flux used must be matched to the application substrate and filler alloy composition. A common brazing process used today is that of the Nocolok Process® in which the flux is potassium fluoroaluminate K 1-3 AlF4-6, a white powder deposit.
For the reasons discussed above, elimination of oxygen - and especially water - from the brazing process is a critical requirement, so the furnace is generally run under a nitrogen atmosphere (Controlled Atmosphere Brazing ‘CAB’ Oxygen < 100 ppm, Humidity < -40°F /-40°C). The design and construction of monitoring systems needs to be carefully considered, as discussed later, to ensure that the furnace atmosphere is not contaminated (by oxygen and water), in any way.
Design Principles and Challenges of a "thru-process" Brazing Furnace Monitoring System
The ‘thru-process’ profiling system concept is based on the principle of sending a data logger through the brazing furnace which is protected from the heat and harsh brazing environment by a thermal barrier. Multiple thermocouples connected to the product test piece (radiator), which are connected directly to the data logger, measure the product temperature (and furnace) as it travels through the furnace storing the information in the data logger memory. The resulting temperature profile can be reviewed, analyzed, and a validation report generated. As the system is compact and travels with the product, there is no need to use the cumbersome and potentially hazardous challenge of feeding (and retrieving) long thermocouples through the furnace, as required in the use of traditional trailing thermocouples.
Innovative Thermal Barrier Design
The thermal barrier has the job of providing thermal protection to the data logger. Although this is the case for aluminium brazing, the barrier also needs to be designed in such a way as to avoid damage to itself from potentially hostile corrosive chemicals generated in the furnace, and prevent contamination of the CAB atmosphere from barrier outgassing materials.
Traditionally, thermal barriers are manufactured employing micro-porous block insulation wrapped in high-temperature glass cloth. During use, moisture trapped in the insulation block is released within the barrier cavity where it can form hydrofluoric (HF) acid in combination with chemicals in the brazing flux. Over only a short period of time, the highly corrosive HF acid can cause significant damage to both the barrier cloth and insulation. This compromises the integrity of the barrier, reduces its thermal performance, and potentially creates a dust contamination risk to the process.
Air trapped in the micro-porous insulation block and within the barrier cavity during heating can expand and escape from the barrier into the furnace. Obviously, being made up of 21% Oxygen (O2 (g)), the air will contaminate the CAB environment, and potentially create a risk of aluminium oxide formation resulting in wetting/brazing problems.
To eliminate the damage to barriers, extend operational life expectancy, and minimize outgassing of air (O2(g)) or moisture, PhoenixTM developed a unique new TS08 specifically for the demands of CAB brazing.
As shown in figure 1, the logger draw loading mechanism significantly reduces the amount of insulation cloth that is exposed to the aggressive flux. Prior to supply, the insulation block is preheated in a high vacuum and back flushed with nitrogen (N2(g)) to drive out any air trapped in the porous insulation structure. For processes where any air outgassing is a significant contamination risk, it is possible, with specific barrier configurations, for customers to purge the small barrier cavity of any remaining air with a supply of low-pressure Nitrogen (N2(g)).
Figure 1: The brazing barrier is designed to give low height thermal protection to the data logger. Designed with front loading logger tray and metal construction to limit exposure of insulation and cloth materials to corrosive HF. Available with nitrogen purge facility option to remove any risk of O2 (g) outgassing into the furnace.
PhoenixTM Datalogger with 6, 10 or 20 Channels
Front loading logger tray with encapsulated thermal insulation protecting from HF
Thermal breaks reduce heat conduction to logger
Heat sinks provide additional thermal protection employing phase change technology
Mineral Insulated Thermocouple inserted into radiator fins
Rear barrier optional Nitrogen feed nozzle for pre-run purging of insulation and barrier cavity of air (02(g))
Unveiling the Mystery of your Brazing Furnace with a ‘thru-process’ Temperature Profile Trace
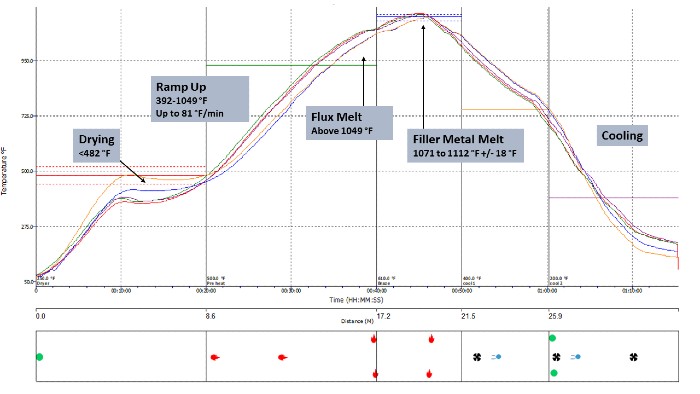
The key temperature transitions/phase of the brazing process are clearly shown on a typical temperature profile as in figure 2.
Figure 2. Thru-process temperature profile of a typical CAB brazing furnace showing critical temperature transitions.
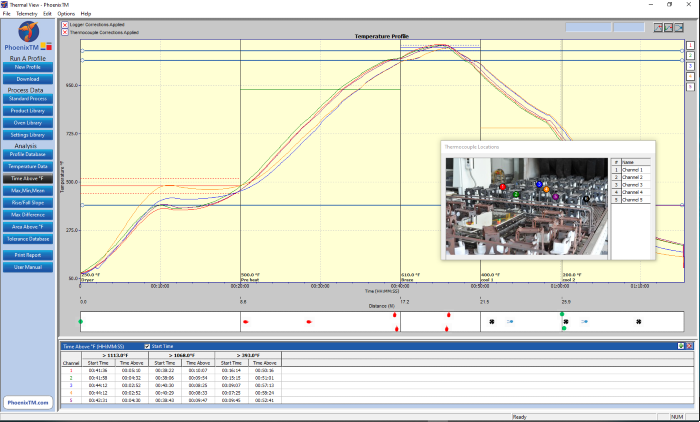
Thermal profile graph displayed in the Thermal View Plus software package.
The brazing system is supplied with Thermal View Plus software, which is designed to provide full analysis and reporting tools for monitoring the brazing process against the monitoring requirements detailed in Table 1.
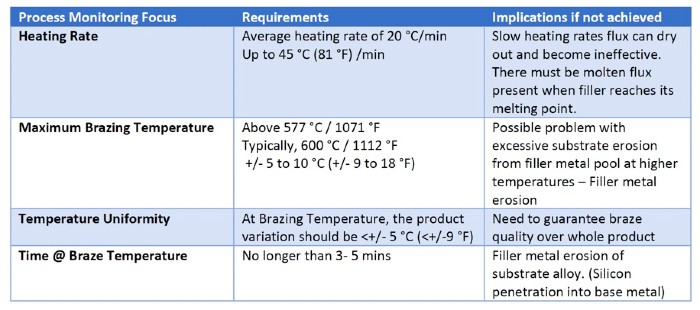
Below in Table 1 is a summary of the target temperature transitions in the CAB brazing process, the impact on process, and possibly, the quality of the brazed final product.
The PhoenixTM brazing system is supplied with Thermal View Plus software, which is designed to provide full analysis and reporting tools for monitoring the brazing process against the monitoring requirements detailed in Table 1.
Table 1. Critical monitoring requirements for the CAB brazing process.
Overview
The PhoenixTM ‘Thru-process’ brazing system provides a rugged, reliable, and clean solution for performing product temperature profiling of Automotive CAB brazing furnaces. Providing the means to Understand, Control, Optimize and Certify the brazing heat treat process.
About the author: Steve Offley, “Dr. O,” the product marketing manager at Phoenix TM, is an experienced global marketing manager with a demonstrated history of working in the industrial temperature monitoring industry over the last 25 years.
In this article by Lee Gearhart, Principal Engineer, Materials and Processes, Moog, Inc., and Chair, Aerospace Metals Engineering Committee, read about a “real time” heat treat inquiry regarding the interpretation of changed oil quenching effectiveness testing in AMS 2759, and Lee’s desire to ensure that the heat treater’s system maintains its effectiveness.
This articlearticle first appeared in the latest edition (June 2020) of Heat Treat Today’s Automotive Heat Treatmagazine.
* Please see the bottom of the article to view the AMS2759 sections to which Lee refers.
The Query:
Lee Gearhart, Principal Engineer, Materials and Processes, Moog, Inc., Chair, Aerospace Metals Engineering Committee
A gentleman, to whom I’ll refer as Mr. XXXX, sent the following query to SAE, the publisher of Aerospace Materials Specifications. The subject line was as follows: “Clarification of AMS 2759G for Committee ‘E’.”
The letter read:
I would like to get some clarification about AMS 2759, Revision G, paragraphs 3.10.3 through 3.10.3.1.5.5. My issue, as an independent testing lab, is the terminology used in 3.10.3.1.5.1 and 3.10.3.1.5.3., and how
I am to determine the acceptance criteria for the hardness in the center diameter of the quench effectiveness samples supplied to us by heat treating companies. Let me walk through the steps that lead up to the determination of minimum hardness at the center of the diameter of the coupon prepared.
Paragraph 3.10.3.1.2 states specific size test bars to use for the quench effectiveness testing, based on the alloy, in sub-paragraphs a., b., c., and d. For 4130 (a.), use 1.5” long, 0.50” diameter bar and for 4330V (c.), use 7.5” long, 2.5” diameter bar. Then, we cut the test coupon from this specimen todetermine hardness at the center diameter, per 10.3.1.4.
Next, we have to determine whether this hardness result, taken at the center diameter, conforms to the spec, and here is where my issue is. Paragraphs 10.3.1.5.1 and 10.3.1.5.3 both state, “…shall not be less than the hardness on the end-quench hardenability curve corresponding to the diameter of the specimen…” So, if I am to use the diameter of the specimen as my guide from paragraph 3.10.3.1.2, a.and c., then the end-quench result on the mill cert corresponding to 8/16 would represent the 0.50”diameter, and 40/16 would represent the 2.5” diameter. ASTM A255 has you stop taking readings on the Jominy bar at 32/16 (2.0”), so there would not be a result on the Mill Cert for the 40/16 requirement.
I don’t believe this is the correct depth. I believe the end-quench result corresponding to one-half the diameter would be the appropriate depth to use as a minimum requirement, since we are taking the hardness reading at one-half the diameter; in the center of the diameter. So, the end-quench result on the mill cert corresponding to 4/16 would represent the 0.50” diameter and 20/16 would represent the 2.5” diameter bar. These requirements are more stringent and would better represent the effectiveness of the quench media to properly quench the specimens and correlate this back to the certified values of the material based on the mill cert reading for the corresponding J values.
Please review this and consult with the Committee to see if this would better represent the intent of these paragraphs for acceptance of quench effectiveness.
The Response:
Because of my position as chairperson of the Aerospace Metals Engineering Committee, the question eventually made its way to my desk. Here is my response:
When reading your question, it suddenly struck me – you’re missing the secret decoder ring! In other words, you cannot directly compare an oil quenched sample to a water quenched (Jominy) test coupon.
Allow me to give you a long-winded explanation that I wrote for Committee E on Steel for the Aerospace Materials Division, the committee that has jurisdiction of AMS2759 on Heat Treating of Steel. The committee had been asked for an explanation of what the 3.10.3 Quench System Monitoring is supposed to do; after the text in italics, I’ll directly answer you.
Let me start by noting the whole purpose of 3.10.3.1, which was to provide a means for a heat treater to demonstrate that their oil quenching system continues to work well. If they do the steps outlined in 3.10.3.1, they do not need to seek approval from their customers for this method. If they choose a different method for monitoring the quench system, they need approval by the cognizant engineering organization (CEO). Since a heat treat firm will probably have many customers with different CEO’s, it makes sense to have one test procedure on which all can agree.
The method starts with the heat treat quality function choosing one of the suggested alloys and bar size configurations noted in 3.10.3.1.2. The constraints of the choice are that the hardenability of the sample has to be enough that they will get full hardening in the center, but not so much that a bar 1.25 times the diameter chosen would get full hardening. (That prevents me from using an air hardening steel, which will not show any difference when my quench system degrades.) If the three choices in 3.10.3.1.2 (a-c) will not work, then (d) offers an out, using other materials and dimensions, established in pre-production testing.
Prior to initial production, and quarterly afterward, the heat treater runs one of the test bars in a typical or simulated production load. They then section out a half-inch slice from the middle of the length of the bar and test the hardness. If in the quarterly testing it remains above the acceptance criterion established by the pre-production testing, their quench system passes.
Figure 1. Cert 4130
Accept/reject criteria is that the hardness in the center meets the hardness of the end-quench hardenability curve done by the original mill, or someone else, per ASTM A255, on the material used for the test. AMEC wanted this because using the generic curves in ASTM A304 is too general, and the curves are routinely done by the steel mills. I’ve attached an example cert (Figure 1) for some 4130 we bought not long ago, and at the bottom of the page are the Jominy numbers! They range from 51 to 24; so, which should I use?
To find the correct accept/reject hardness, I go to a curve that shows what Jominy distance in sixteenthsof an inch reflects the cooling at the center of the size of test bar I use. If I’m using 4130 steel from my certified lot of material, the specimen is half inch in diameter, and the attached Timken curves say that the center of a half inch bar cooled with an H of 5 (good agitation) corresponds to a Jominy distance of 3/16, so the hardness required is 49 HRC. If I use a different curve, like the other one attached from an old Copperweld brochure (Figure 2), I get a Jominy distance of 31⁄2, so my acceptance number is somewhere between 49 and 46, so I’ll use 48 HRC. This difference is small, and unimportant, since I’m only using it to show if there is degradation in the oil quench performance.
This “compare it with the Jominy curve done by the mill” is only for the 4130 and 4330V specimens noted in 3.10.3.1.5.1 and 3.10.3.1.5.3. For specimens made of 4140, we call out HRC 44 in the center and HRC 50 in the 3⁄4 radius position of the 11⁄2 inch diameter specimen.
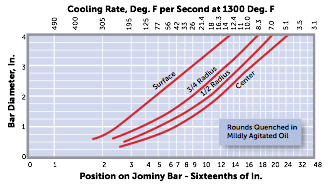
So, the 8/16 position on the Jominy curve doesn’t mean it’s appropriate for a half inch diameter specimen – it’s just pointing to the spot on the Jominy bar that’s 8/16 inch from the end that gets sprayed with water. The “secret decoder ring” I mentioned are the “Jominy cooling rates” or the “Pages from Timkin” attachment (Figures 3). These translate the speed of quenching at any sixteenth- inch position of a Jominy bar to the equivalent rate of quenching of surface, mid-radius, and center of bars of different size quenched in various coolants. I tend to use the “Jominy cooling rates” attachment, which I got from an old Copperweld Steel brochure, but since the Timkin Practical Data Handbook for Metallurgists is on the web for free, it’s probably a more universal reference.
Hence for 0.50” diameter 4130 bar, the center hardness should be that corresponding to between 3 and 4 sixteenths of an inch. For the 2.5” diameter bar, quenched in mildly agitated oil, the cooling rate at the center would be represented by the 14/16” position on the Jominy bar. Maybe 15/16” – it’s kind of hard to read. Hence you read the data from the mill cert FOR THE STEEL FROM WHICH THE PIECES WERE MADE and use those numbers as accept/reject. HTT
About the author: Lee Gearhart, P.E., has worked for Moog, Inc. since 1982 and is currently Principal Engineer, Materials and Process Engineering. In addition to being a worldwide resource for the company, Lee is the current chair of the Aerospace Metals Engineering Committee, where much of the discussion on heat treating specifications occurs.
*Section 3.10.3 from AMS2759 Heat Treatment of Steel Parts(This section is one of the big changes to AMS2759 revision F, April 2018, which was then tweaked to revision G in August 2019)
The sections to which the article discusses is 3.10.3.1, 3.10.3.1.2 (a-d), 3.10.3.1.5.1 and 3.10.3.1.5.3
3.10.3 Quench System Monitoring
The quench system includes the quench volume, type of fluid, recirculation velocity and uniformity, and heat exchange capacity. The consistency of the quench system shall be monitored quarterly, by processing test parts, as outlined below, which are capable of detecting changes in the cooling characteristics of the system. Testing of water quench systems is not required. Quench system monitoring test procedures other than those described in 3.10.3.1 shall be approved by the cognizant engineering authority. When destructive mechanical property testing is required for part acceptance, quench system monitoring is not required.
3.10.3.1 Test Specimen Requirements
3.10.3.1.1 Test Specimen Alloy/Configuration
3.10.3.1.1.1Round specimens of carbon or low alloy steel, of appropriate hardenability and dimensions shall be used. Selection of the specimen dimensions/hardenability combination shall be aimed at achieving full hardening (e.g., 95% martensite) at the center of the specimen. The specific combination of alloy/dimensions chosen shall be such that the specimen would not be capable of achieving full hardening at 1.25 times the diameter chosen for the test specimen. The length of the test specimen shall be at least three times the diameter.
3.10.3.1.1.2The test specimens used for the initial and subsequent evaluation of a particular quenchant shall be from the same alloy and preferably the same chemistry heat of material to eliminate material chemistry and hardenability differences from the alloy selection. Hardenability results shall not be lower than that represented by requirements in 3.10.3.1.5.
3.10.3.1.2Test specimen alloy/dimensions shall be one of the following:
4130 round bar, minimum 1.50 inches (3.81 cm) long, 0.50 inch (1.27 cm) nominal diameter.
Other material and dimensional requirements established in pre-production testing or as specified by the cognizant engineering organization. See 8.5 for shape equivalent guidelines.
3.10.3.1.3Test Specimen Processing
Quarterly quench system monitoring tests shall be run with a typical or simulated production load. Heat treat loads shall be processed in accordance with the appropriate AMS2759 slash specification requirements.
3.10.3.1.4Specimen Testing Requirements
After quenching the test specimen, a 0.5-inch-thick specimen shall be cut from the center of the test specimen length and prepared for hardness testing in the untempered condition. Specimen shall be prepared to ensure it is free from overheating. The minimum hardness at the center of the diameter shall meet the hardness requirements of the approved procedure in 3.10.3.
3.10.3.1.5Test Specimen Hardenability
3.10.3.1.5.1Round Bar Specimen 4130
After quenching, the center of the diameter shall not be less than the hardness on the end-quench hardenability curve corresponding to the diameter of the specimen when tested in accordance with ASTM E18. The end-quench hardenability curve shall be the actual hardenability curve determined in accordance with ASTM A255 on the material used for the test specimen.
3.10.3.1.5.2Round Bar Specimen 4140
The hardness in the center of the diameter shall not be less than HRC 44 and the 3/4 radius shall not be less than HRC 50 when tested in accordance with ASTM E18.
3.10.3.1.5.3Round Bar Specimen 4330V
The hardness in the center of the diameter shall not be less than the hardness on the end-quench hardenability curve corresponding to the diameter of the specimen when tested in accordance with ASTM E18. The end-quench hardenability curve shall be the actual hardenability curve determined in accordance with ASTM A255 on the material used for the test specimen.
3.10.3.1.5.4If other combinations are established, the accept/reject criteria shall be as specified in the ordering information.
3.10.3.1.5.5It is the responsibility of the heat treater to provide the material and hardenability data specified above.
3.10.3.2 Any failures shall be documented by the heat treater’s corrective action system.
3.10.3.2.1As a minimum, if the test specified in 3.10.3 fails, the quench medium shall be analyzed as specified in 3.10.3.3.
3.10.3.3 Quench Media Control
3.10.3.3.1Each new shipment of quenchant from a vendor shall meet the requirements for the particular quenchant listed in 3.10.3.3.1.1 through 3.10.3.3.1.3 as applicable. The vendor shall furnish a certificate of conformance stating that the quenchant meets the requirements including, in addition to the vendor designation, the cooling curve, the cooling rate curve, the maximum cooling rate, and:
3.10.3.3.1.1For mineral oil based quenchants, the certificate shall also include the viscosity, flash point, temperature at the maximum cooling rate.
3.10.3.3.1.2For vegetable or ester-based oil quenchants, the certificate shall also include the viscosity, flash point, temperature at the maximum cooling rate.
3.10.3.3.1.3For polymer quenchants, the certificate shall also include the undiluted pH and viscosity. The pH, viscosity, maximum cooling rate and the temperature at the maximum cooling rate shall be provided at 20% concentration by weight.
3.10.3.3.2Cooling curve tests shall be performed semi-annually, or when required by corrective action (3.10.3.2), in accordance with ASTM D6200, ISO 9950 or JIS K 2242, ASTM D6482, or ASTM D6549, as applicable to the specific quench medium. If no alternative limits have been established by pre-production tests or specified by the cognizant engineering authority, exceeding the following limits compared to the initial shipment of quenchant shall be cause for corrective action:
For mineral oils: Temperature of the Maximum Cooling Rate: (±68 °F) (37.8 °C) Maximum Cooling Rate: (±25 °F/s) (13.9 °C/s)
For vegetable or ester-based oils: Maximum Cooling Rate: (±25 °F/s) (13.9 °C/s) Temperature of the Maximum Cooling Rate: (±68 °F) (37.8 °C)
For polymer quenchants: Maximum Cooling Rate: ±15% Temperature of the Maximum Cooling Rate: ±15%
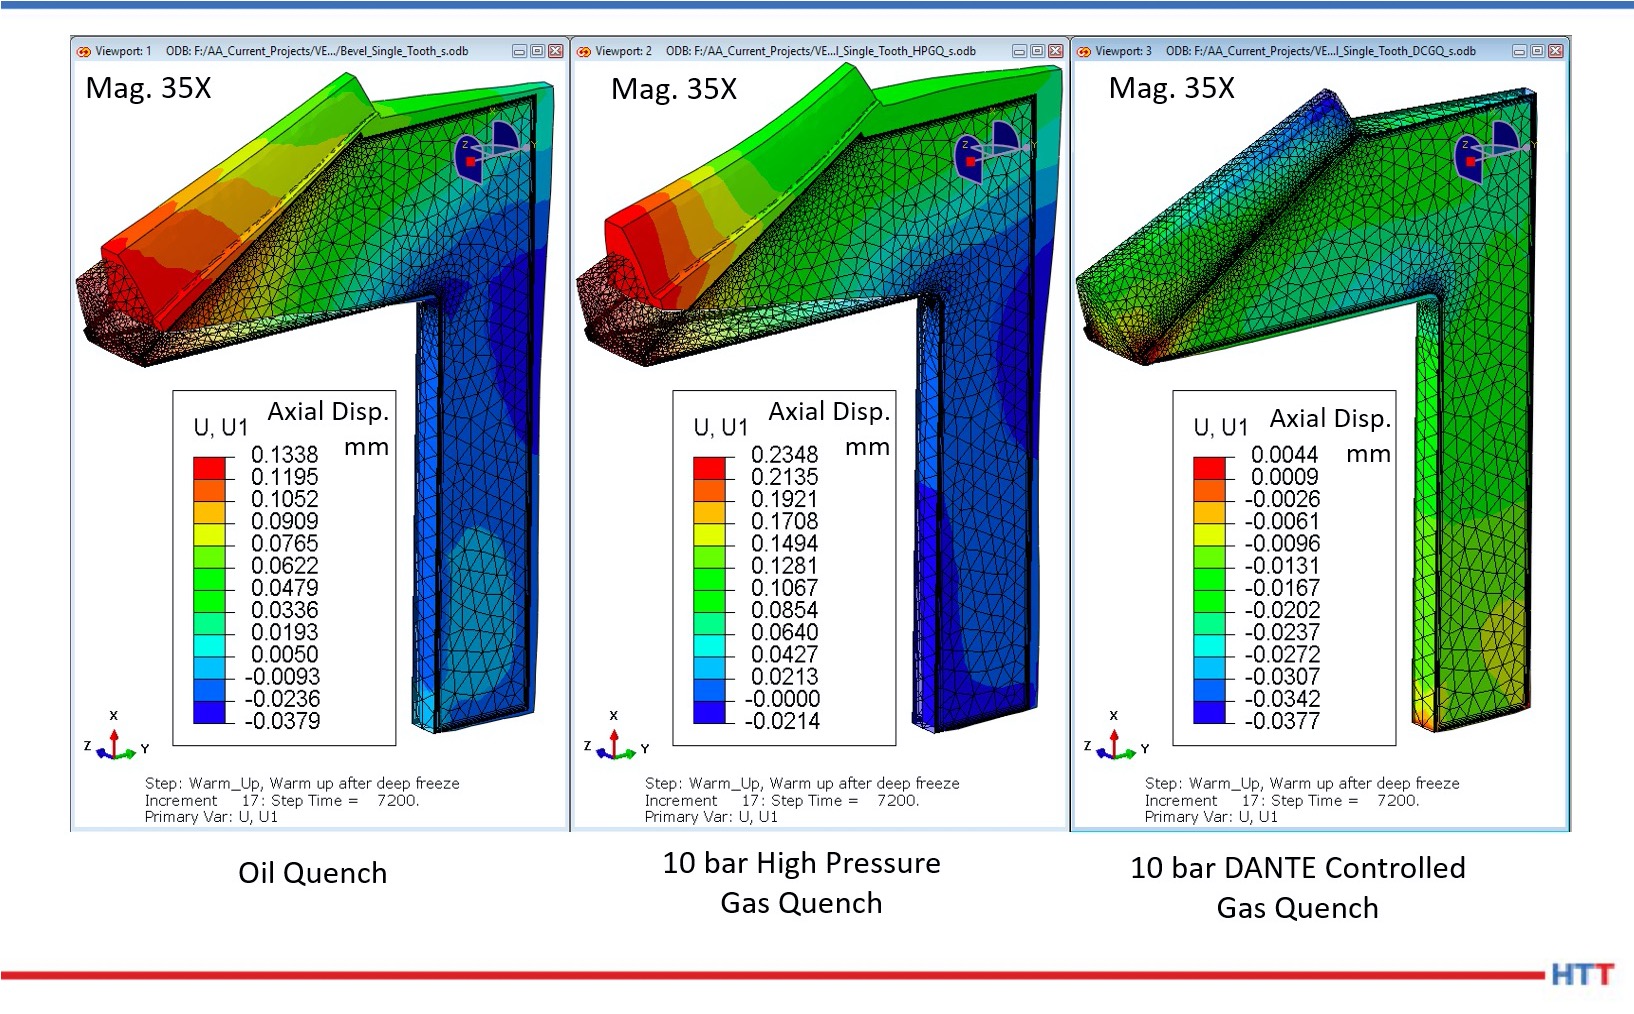
“High-pressure gas quenching (HPGQ) attempts to reduce temperature nonuniformities by reducing the cooling rate; however, this is generally not sufficient to eliminate shape change. Shape change can be predicted by heat treatment simulation software, but it is difficult to reproduce the exact same cooling conditions in the vessel for each batch. Therefore, the distortion of the components will not be consistent from batch to batch.”
Read the case study to see one response to this issue in this original content from Heat Treat Today by Justin Sims, lead engineer at DANTE Solutions.
This article first appeared in the latest edition (March 2020) of Heat Treat Today’s Aerospace Heat Treating magazine.
Distortion is generally described by a size change and a shape change. In heat treatment of steels, size change is unavoidable and is mainly due to the volumetric difference between the starting microstructural phase and the final microstructural phase. Shape change of steel parts from heat treatment is due to nonuniform thermal and nonuniform microstructural strains as a result of nonuniform cooling or heating, alloy segregation, poor support of the component while at high temperature, thermal expansion or contraction restrictions, or residual stresses from prior forming operations. Nonuniform cooling or heating can be as fundamental as the temperature gradient from the part surface to its core, or as complex as the flow of fluid around a component feature. Both can result in nonuniform strains, resulting in a shape change. If the stresses causing these strains exceed the yield strength of the material, then permanent shape change will occur. Size change can be anticipated and is predictable, while shape change, or distortion, is usually unanticipated and more difficult to predict.[1-2]
Justin Sims, Lead Engineer, DANTE Solutions
Most thermal processes try to control these nonuniformities using methods of low complexity such as part orientation and rack design. Quenching systems, for example, are generally designed to remove as much thermal energy from the work pieces as possible and to do this as quickly as possible. High-pressure gas quenching (HPGQ) attempts to reduce temperature nonuniformities by reducing the cooling rate; however, this is generally not sufficient to eliminate shape change. Shape change can be predicted by heat treatment simulation software, but it is difficult to reproduce the exact same cooling conditions in the vessel for each batch. Therefore, the distortion of the components will not be consistent from batch to batch.
In response to this issue, a prototype gas quenching unit capable of controlling the temperature of the quench gas entering the quench chamber was devised. With the DANTE Controlled Gas Quench (DCGQ) unit, it is possible to have control of the thermal and transformation gradients in the component by controlling the temperature of the incoming quench gas, thereby significantly reducing, or eliminating entirely, the shape change caused by quenching. In doing so, the size change can easily be predicted by heat treatment simulation software, and post-hardening finishing operations can be reduced or eliminated. This process is ideal for thin parts or components with significant cross-sectional changes. Atmosphere Engineering (now part of United Process Controls) in Milwaukee, Wisconsin constructed the unit and provided the logic to control it. All experiments with the unit were conducted at Akron Steel Treating Company in Akron, Ohio. The project was funded by the U.S. Army Defense Directorate (ADD).
Figure 1 (left) shows the front of the unit, while Figure 1 (middle) shows the back of the unit. The back of the unit contains the human machine interface (HMI), shown in Figure 1 (right), where process parameters can be modified and DCGQ recipes entered. The prototype unit has a working zone of nine cubic ft. and is capable of quenching loads up to 100 lbs. at one atmosphere of pressure.
Figure 2. Comparison of quench gas temperature entering the quench chamber versus the recipe setpoint temperature for two different DCGQ process recipes
The ability of the unit to maintain continuity between the recipe setpoint temperature and the actual temperature entering the quench chamber is absolutely paramount. Figure 2 shows two schedules, one aggressive and one conservative, comparing the recipe setpoint (Chamber Inlet SP) to the actual quench gas temperature (Chamber Inlet PV). Figure 2 also shows that the prototype unit has good control of the quench gas temperature between 752°F (400°C) and room temperature, the martensite transformation range for most high hardenable steel alloys. There is some deviation between the two temperatures below 392°F (200°C) for the aggressive schedule as the setpoint reaches its set temperature, due to the relatively small temperature difference between the quench gas and the shop air. This small temperature difference makes it slightly difficult for the air-to-air heat exchanger used in the design to keep up with the rapid drop in temperature, but overall there is very good control of the quench gas temperature.
Figure 3. Micrograph of DCGQ (left) and HPGQ (right) processed coupons, mag. 1000X There is a copper layer on the surface of the DCGQ processed coupon.
Microstructural examination was conducted on Ferrium C64 coupons processed using the DCGQ process and coupons processedusing a 2-bar HPGQ. C64 was chosen for this study due to its extremely high hardenability and its high tempering temperature. Figure 3 compares the microstructures of the two processes at a magnification of 1000X, and no significant difference is detected. The DCGQ coupons required two hours to complete the transformation, whereas the HPGQ coupons transformed in a few minutes. There is no indication that the slow rate of transformation damaged the microstructure or mechanical properties in any way. Tensile and Charpy properties were equivalent between the two processes.
Distortion coupons, thick disks with eccentric bores, were designed and manufactured with the goal of evaluating the distortion response when subjected to a DCGQ process, and then compared to coupons subjected to a standard 2-bar HPGQ operation. All coupons were manufactured from the same Ferrium C64 bar stock. All coupons were cryogenically treated and tempered at 595°C for eight hours after quenching.
Figure 4. Nomenclature and locations used for out-of-round measurements on the distortion coupon
Figure 4 shows a distortion coupon with the nomenclature and locations used for measuring the out-of-round distortion of the eccentric bore. Due to the uneven mass distribution, the north-south direction will generally be larger than the east-west direction. Five measurements were then made along the axis of the coupon using a Fowler Bore Gauge.
Table 1. Out-of-round distortion measurements of the distortion coupon for a DCGQ and HPGQ process
Table 1 shows the results from four coupons; two hardened using the DCGQ process and two processed using the standard 2 bar HPGQ for C64. The individual measurements (EW1, NS5, etc.) are relative and are dependent on the reference value used for the bore gauge. The individual measurements give an indication of the variation in distortion in the axial direction. The out-of-round measurements are actual values, as they are the difference between the actual measurements. The DCGQ process gave significantly less distortion than the HPGQ process.
While the values reported show a 50% reduction in out-of-round distortion for the DCGQ process, a larger gain could have been realized if two other conditions were addressed. First, the coupon for DCGQ was placed directly into a 1832°F (1000°C) preheated furnace since the prototype unit does not have austenitizing capabilities. Controlled heating, just like controlled cooling, should be utilized to realize the full potential of this process. Second, the DCGQ schedule was designed for another coupon geometry that was processed together with these distortion coupons. Therefore, the schedule was not optimum for this coupon geometry.
Table 2. DANTE simulation results comparing HPGQ and DCGQ using the experimental conditions and a DCGQ with optimized heating and cooling schedulesMARCH 2020
Table 2 compares the DCGQ simulation results in which the two processes executed on the experimental coupons were compared to an optimized process, including controlled heating and cooling schedules designed for this coupon. The optimized schedule predicts an order of magnitude reduction in out-of-round distortion. Comparison of the measurements from the HPGQ and DCGQ experiments in Table 1 to the model predictions in Table 2 shows that the model predictions agree closely with the experimental results.
Simulating the application of the DCGQ process to a gear geometry, the predicted warpage of a bevel gear was examined. The simulation looked at the differences between an oil quench, 10 bar HPGQ, and a 10 bar DCGQ process. From Figure 5, it is clear that the HPGQ process is predicted to produce the most distortion. Even though the 10 bar gas quench has a slower cooling rate than the oil quench, less distortion is not guaranteed since a slower rate does not guarantee a more uniform phase transformation.[3] In this case, both heating and cooling were controlled for the DCGQ simulation.
Figure 5. Comparison of oil quench, HPGQ, and DCGQ processes for a bevel gear
In summary, a prototype gas quenching unit has been constructed with the ability to accurately control the temperature of the quench gas entering the quench chamber. Experimental results have shown that mechanical properties and microstructure are equivalent between the DCGQ process and a 2-bar HPGQ process for Ferrium C64. Thick disks with eccentric bores were machined and then heat treated using DCGQ and HPGQ. It was shown that the DCGQ process reduced distortion in these disks by 50%. Simulation using DANTE then showed that the distortion could be reduced further if controlled heating and cooling are used. Finally, a comparison was made between an oil quench, HPGQ, and DCGQ processes for a bevel gear. This comparison showed that the HPGQ process was predicted to cause the most distortion. HTT
References
[1] Prabhudev, K.H., Handbook of Heat Treatment of Steels, Tata McGraw-Hill Publishing, 1988, p.111-114
[3] Sims, Justin, Li Zhichao (Charlie), Ferguson B. Lynn, Causes of Distortion during High Pressure Gas Quenching Process of Steel Parts, Proceedings of the 30th ASM Heat Treating Society Conference, ASM International, 2019, p.228-236
About the Author: As an analyst of steel heat treat processes and an expert modeler of quench hardening processes, Justin Sims was the lead engineer for designing and building the DANTE Controlled Gas Quenching (DCGQ) prototype unit. This system was developed to minimize distortion of quenched parts made of high hardenability steels, while still achieving the required properties and performance.