John Niggle, Business Development Manager, Pelican Wire
Edward Valykeo, Thermocouple Specialist, Pelican Wire
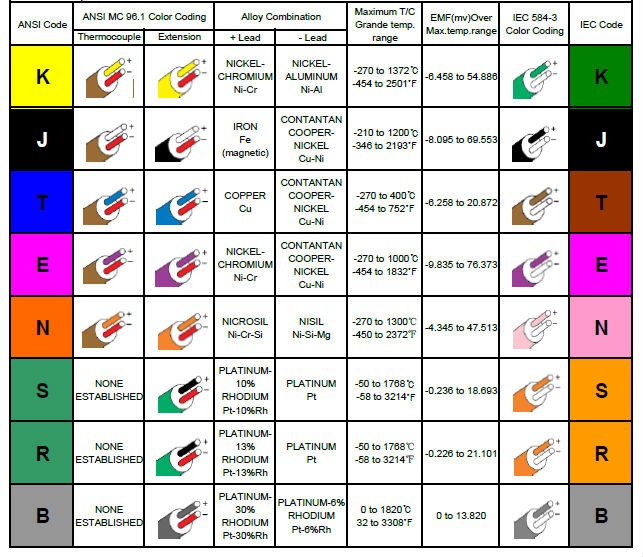
In June 2020, Heat Treat Today published a noteworthy technical article on the basics of thermocouples by John Niggle, Business Development Manager, and Ed Valykeo, Thermocouple Specialist, at Pelican Wire, Naples, FL. The article covers the different types of thermocouples, questions to consider when deciding which type of thermocouple to use, as well as a fascinating discussion on thermocouple wire and wire insulations. One feature of significant recognition is the chart included by Niggle and Valykeo:
Thermocouple Color Code Chart (photo source: "Thermocouples 101")
One of Heat Treat Today's editorial contributors and readers, Martin Reeves of Unitherm Furnace, LLC, saw this article and provided valuable information to the subject:
Martin Reeves, Owner, Fontec-global, LLC
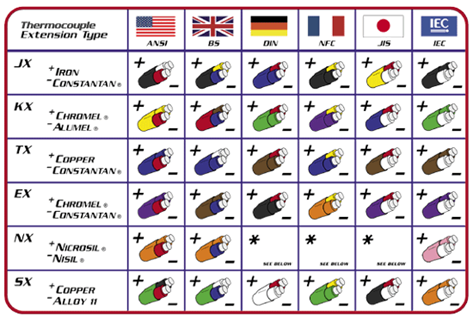
"Excellent article and a great base for understanding T/C's. Only one thing missing and that is the differences between US and international lead colours. These are very different and when equipment is sold overseas or imported this becomes important for T/C's to be wired correctly."
International Thermocouple Lead Colors (photo source: Martin Reeves)
We welcome your inquiries to and feedback on Heat Treat Today articles. Submit your questions/comments to editor@heattreattoday.com.
While salt baths and gas nitriding are time-tested methods for hardening, what about the stringent body depth, surface hardness and composite layer thickness requirements for gears, guides, and drilling tools?
(photo source: https://ansion005.wordpress.com/)
In this Heat TreatTodayBest of the Web feature, Advanced Nitriding Solutions shares the advantages of the surface hardening process of ion nitriding with plasma ions. While this surface hardening process is typically applied on steel, the process is both informative and relevant to other materials in the heat treating processes.
An excerpt: "...the fatigue strength is improved five to ten times from its typical “raw” life, depending on the material and the construction of the part. Thus the fatigue strength is improved without distortion compared to other surface treatment methods, thus saving customers money."
In this article by Lee Gearhart, Principal Engineer, Materials and Processes, Moog, Inc., and Chair, Aerospace Metals Engineering Committee, read about a “real time” heat treat inquiry regarding the interpretation of changed oil quenching effectiveness testing in AMS 2759, and Lee’s desire to ensure that the heat treater’s system maintains its effectiveness.
This articlearticle first appeared in the latest edition (June 2020) of Heat Treat Today’s Automotive Heat Treatmagazine.
* Please see the bottom of the article to view the AMS2759 sections to which Lee refers.
The Query:
Lee Gearhart, Principal Engineer, Materials and Processes, Moog, Inc., Chair, Aerospace Metals Engineering Committee
A gentleman, to whom I’ll refer as Mr. XXXX, sent the following query to SAE, the publisher of Aerospace Materials Specifications. The subject line was as follows: “Clarification of AMS 2759G for Committee ‘E’.”
The letter read:
I would like to get some clarification about AMS 2759, Revision G, paragraphs 3.10.3 through 3.10.3.1.5.5. My issue, as an independent testing lab, is the terminology used in 3.10.3.1.5.1 and 3.10.3.1.5.3., and how
I am to determine the acceptance criteria for the hardness in the center diameter of the quench effectiveness samples supplied to us by heat treating companies. Let me walk through the steps that lead up to the determination of minimum hardness at the center of the diameter of the coupon prepared.
Paragraph 3.10.3.1.2 states specific size test bars to use for the quench effectiveness testing, based on the alloy, in sub-paragraphs a., b., c., and d. For 4130 (a.), use 1.5” long, 0.50” diameter bar and for 4330V (c.), use 7.5” long, 2.5” diameter bar. Then, we cut the test coupon from this specimen todetermine hardness at the center diameter, per 10.3.1.4.
Next, we have to determine whether this hardness result, taken at the center diameter, conforms to the spec, and here is where my issue is. Paragraphs 10.3.1.5.1 and 10.3.1.5.3 both state, “…shall not be less than the hardness on the end-quench hardenability curve corresponding to the diameter of the specimen…” So, if I am to use the diameter of the specimen as my guide from paragraph 3.10.3.1.2, a.and c., then the end-quench result on the mill cert corresponding to 8/16 would represent the 0.50”diameter, and 40/16 would represent the 2.5” diameter. ASTM A255 has you stop taking readings on the Jominy bar at 32/16 (2.0”), so there would not be a result on the Mill Cert for the 40/16 requirement.
I don’t believe this is the correct depth. I believe the end-quench result corresponding to one-half the diameter would be the appropriate depth to use as a minimum requirement, since we are taking the hardness reading at one-half the diameter; in the center of the diameter. So, the end-quench result on the mill cert corresponding to 4/16 would represent the 0.50” diameter and 20/16 would represent the 2.5” diameter bar. These requirements are more stringent and would better represent the effectiveness of the quench media to properly quench the specimens and correlate this back to the certified values of the material based on the mill cert reading for the corresponding J values.
Please review this and consult with the Committee to see if this would better represent the intent of these paragraphs for acceptance of quench effectiveness.
The Response:
Because of my position as chairperson of the Aerospace Metals Engineering Committee, the question eventually made its way to my desk. Here is my response:
When reading your question, it suddenly struck me – you’re missing the secret decoder ring! In other words, you cannot directly compare an oil quenched sample to a water quenched (Jominy) test coupon.
Allow me to give you a long-winded explanation that I wrote for Committee E on Steel for the Aerospace Materials Division, the committee that has jurisdiction of AMS2759 on Heat Treating of Steel. The committee had been asked for an explanation of what the 3.10.3 Quench System Monitoring is supposed to do; after the text in italics, I’ll directly answer you.
Let me start by noting the whole purpose of 3.10.3.1, which was to provide a means for a heat treater to demonstrate that their oil quenching system continues to work well. If they do the steps outlined in 3.10.3.1, they do not need to seek approval from their customers for this method. If they choose a different method for monitoring the quench system, they need approval by the cognizant engineering organization (CEO). Since a heat treat firm will probably have many customers with different CEO’s, it makes sense to have one test procedure on which all can agree.
The method starts with the heat treat quality function choosing one of the suggested alloys and bar size configurations noted in 3.10.3.1.2. The constraints of the choice are that the hardenability of the sample has to be enough that they will get full hardening in the center, but not so much that a bar 1.25 times the diameter chosen would get full hardening. (That prevents me from using an air hardening steel, which will not show any difference when my quench system degrades.) If the three choices in 3.10.3.1.2 (a-c) will not work, then (d) offers an out, using other materials and dimensions, established in pre-production testing.
Prior to initial production, and quarterly afterward, the heat treater runs one of the test bars in a typical or simulated production load. They then section out a half-inch slice from the middle of the length of the bar and test the hardness. If in the quarterly testing it remains above the acceptance criterion established by the pre-production testing, their quench system passes.
Figure 1. Cert 4130
Accept/reject criteria is that the hardness in the center meets the hardness of the end-quench hardenability curve done by the original mill, or someone else, per ASTM A255, on the material used for the test. AMEC wanted this because using the generic curves in ASTM A304 is too general, and the curves are routinely done by the steel mills. I’ve attached an example cert (Figure 1) for some 4130 we bought not long ago, and at the bottom of the page are the Jominy numbers! They range from 51 to 24; so, which should I use?
To find the correct accept/reject hardness, I go to a curve that shows what Jominy distance in sixteenthsof an inch reflects the cooling at the center of the size of test bar I use. If I’m using 4130 steel from my certified lot of material, the specimen is half inch in diameter, and the attached Timken curves say that the center of a half inch bar cooled with an H of 5 (good agitation) corresponds to a Jominy distance of 3/16, so the hardness required is 49 HRC. If I use a different curve, like the other one attached from an old Copperweld brochure (Figure 2), I get a Jominy distance of 31⁄2, so my acceptance number is somewhere between 49 and 46, so I’ll use 48 HRC. This difference is small, and unimportant, since I’m only using it to show if there is degradation in the oil quench performance.
This “compare it with the Jominy curve done by the mill” is only for the 4130 and 4330V specimens noted in 3.10.3.1.5.1 and 3.10.3.1.5.3. For specimens made of 4140, we call out HRC 44 in the center and HRC 50 in the 3⁄4 radius position of the 11⁄2 inch diameter specimen.
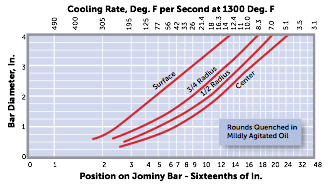
So, the 8/16 position on the Jominy curve doesn’t mean it’s appropriate for a half inch diameter specimen – it’s just pointing to the spot on the Jominy bar that’s 8/16 inch from the end that gets sprayed with water. The “secret decoder ring” I mentioned are the “Jominy cooling rates” or the “Pages from Timkin” attachment (Figures 3). These translate the speed of quenching at any sixteenth- inch position of a Jominy bar to the equivalent rate of quenching of surface, mid-radius, and center of bars of different size quenched in various coolants. I tend to use the “Jominy cooling rates” attachment, which I got from an old Copperweld Steel brochure, but since the Timkin Practical Data Handbook for Metallurgists is on the web for free, it’s probably a more universal reference.
Hence for 0.50” diameter 4130 bar, the center hardness should be that corresponding to between 3 and 4 sixteenths of an inch. For the 2.5” diameter bar, quenched in mildly agitated oil, the cooling rate at the center would be represented by the 14/16” position on the Jominy bar. Maybe 15/16” – it’s kind of hard to read. Hence you read the data from the mill cert FOR THE STEEL FROM WHICH THE PIECES WERE MADE and use those numbers as accept/reject. HTT
About the author: Lee Gearhart, P.E., has worked for Moog, Inc. since 1982 and is currently Principal Engineer, Materials and Process Engineering. In addition to being a worldwide resource for the company, Lee is the current chair of the Aerospace Metals Engineering Committee, where much of the discussion on heat treating specifications occurs.
*Section 3.10.3 from AMS2759 Heat Treatment of Steel Parts(This section is one of the big changes to AMS2759 revision F, April 2018, which was then tweaked to revision G in August 2019)
The sections to which the article discusses is 3.10.3.1, 3.10.3.1.2 (a-d), 3.10.3.1.5.1 and 3.10.3.1.5.3
3.10.3 Quench System Monitoring
The quench system includes the quench volume, type of fluid, recirculation velocity and uniformity, and heat exchange capacity. The consistency of the quench system shall be monitored quarterly, by processing test parts, as outlined below, which are capable of detecting changes in the cooling characteristics of the system. Testing of water quench systems is not required. Quench system monitoring test procedures other than those described in 3.10.3.1 shall be approved by the cognizant engineering authority. When destructive mechanical property testing is required for part acceptance, quench system monitoring is not required.
3.10.3.1 Test Specimen Requirements
3.10.3.1.1 Test Specimen Alloy/Configuration
3.10.3.1.1.1Round specimens of carbon or low alloy steel, of appropriate hardenability and dimensions shall be used. Selection of the specimen dimensions/hardenability combination shall be aimed at achieving full hardening (e.g., 95% martensite) at the center of the specimen. The specific combination of alloy/dimensions chosen shall be such that the specimen would not be capable of achieving full hardening at 1.25 times the diameter chosen for the test specimen. The length of the test specimen shall be at least three times the diameter.
3.10.3.1.1.2The test specimens used for the initial and subsequent evaluation of a particular quenchant shall be from the same alloy and preferably the same chemistry heat of material to eliminate material chemistry and hardenability differences from the alloy selection. Hardenability results shall not be lower than that represented by requirements in 3.10.3.1.5.
3.10.3.1.2Test specimen alloy/dimensions shall be one of the following:
4130 round bar, minimum 1.50 inches (3.81 cm) long, 0.50 inch (1.27 cm) nominal diameter.
Other material and dimensional requirements established in pre-production testing or as specified by the cognizant engineering organization. See 8.5 for shape equivalent guidelines.
3.10.3.1.3Test Specimen Processing
Quarterly quench system monitoring tests shall be run with a typical or simulated production load. Heat treat loads shall be processed in accordance with the appropriate AMS2759 slash specification requirements.
3.10.3.1.4Specimen Testing Requirements
After quenching the test specimen, a 0.5-inch-thick specimen shall be cut from the center of the test specimen length and prepared for hardness testing in the untempered condition. Specimen shall be prepared to ensure it is free from overheating. The minimum hardness at the center of the diameter shall meet the hardness requirements of the approved procedure in 3.10.3.
3.10.3.1.5Test Specimen Hardenability
3.10.3.1.5.1Round Bar Specimen 4130
After quenching, the center of the diameter shall not be less than the hardness on the end-quench hardenability curve corresponding to the diameter of the specimen when tested in accordance with ASTM E18. The end-quench hardenability curve shall be the actual hardenability curve determined in accordance with ASTM A255 on the material used for the test specimen.
3.10.3.1.5.2Round Bar Specimen 4140
The hardness in the center of the diameter shall not be less than HRC 44 and the 3/4 radius shall not be less than HRC 50 when tested in accordance with ASTM E18.
3.10.3.1.5.3Round Bar Specimen 4330V
The hardness in the center of the diameter shall not be less than the hardness on the end-quench hardenability curve corresponding to the diameter of the specimen when tested in accordance with ASTM E18. The end-quench hardenability curve shall be the actual hardenability curve determined in accordance with ASTM A255 on the material used for the test specimen.
3.10.3.1.5.4If other combinations are established, the accept/reject criteria shall be as specified in the ordering information.
3.10.3.1.5.5It is the responsibility of the heat treater to provide the material and hardenability data specified above.
3.10.3.2 Any failures shall be documented by the heat treater’s corrective action system.
3.10.3.2.1As a minimum, if the test specified in 3.10.3 fails, the quench medium shall be analyzed as specified in 3.10.3.3.
3.10.3.3 Quench Media Control
3.10.3.3.1Each new shipment of quenchant from a vendor shall meet the requirements for the particular quenchant listed in 3.10.3.3.1.1 through 3.10.3.3.1.3 as applicable. The vendor shall furnish a certificate of conformance stating that the quenchant meets the requirements including, in addition to the vendor designation, the cooling curve, the cooling rate curve, the maximum cooling rate, and:
3.10.3.3.1.1For mineral oil based quenchants, the certificate shall also include the viscosity, flash point, temperature at the maximum cooling rate.
3.10.3.3.1.2For vegetable or ester-based oil quenchants, the certificate shall also include the viscosity, flash point, temperature at the maximum cooling rate.
3.10.3.3.1.3For polymer quenchants, the certificate shall also include the undiluted pH and viscosity. The pH, viscosity, maximum cooling rate and the temperature at the maximum cooling rate shall be provided at 20% concentration by weight.
3.10.3.3.2Cooling curve tests shall be performed semi-annually, or when required by corrective action (3.10.3.2), in accordance with ASTM D6200, ISO 9950 or JIS K 2242, ASTM D6482, or ASTM D6549, as applicable to the specific quench medium. If no alternative limits have been established by pre-production tests or specified by the cognizant engineering authority, exceeding the following limits compared to the initial shipment of quenchant shall be cause for corrective action:
For mineral oils: Temperature of the Maximum Cooling Rate: (±68 °F) (37.8 °C) Maximum Cooling Rate: (±25 °F/s) (13.9 °C/s)
For vegetable or ester-based oils: Maximum Cooling Rate: (±25 °F/s) (13.9 °C/s) Temperature of the Maximum Cooling Rate: (±68 °F) (37.8 °C)
For polymer quenchants: Maximum Cooling Rate: ±15% Temperature of the Maximum Cooling Rate: ±15%
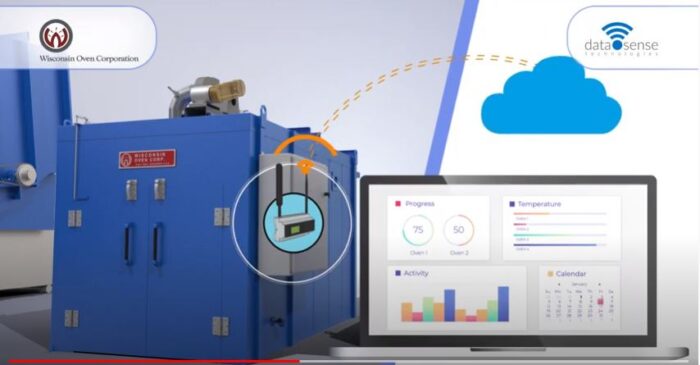
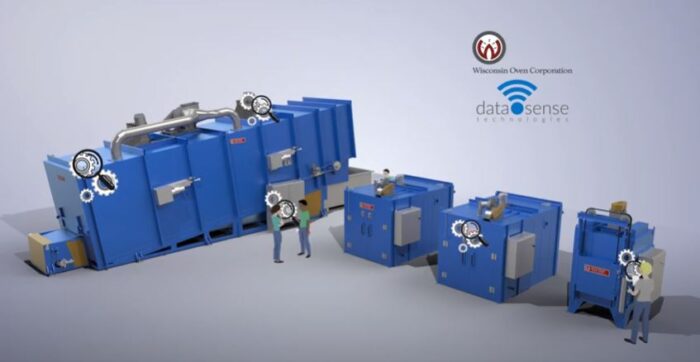
Wisconsin Oven Corporation announced a new IoT (Internet of things) predictive maintenance technology available on their industrial ovens. The new system is capable of monitoring the performance and health of components on the ovens. Some of the conditions that the sensors track are vibration, temperature, current, and pressure.
The system will be supplied by DataSense Technologies. Their Performance Monitoring System utilizes sensors to monitor the condition of components on a customer’s industrial oven, featuring a gateway that collects performance data from sensors on critical oven components.
This system will enable customers to minimize unscheduled downtime and increase their profitability because the Performance Monitoring system can be used to identify performance and component issues. Automatic alarm thresholds can be implemented to satisfy the specific needs of heat treating customers.
Learn more about the DataSense Technologies with a video here.
Heat TreatTodayoffers News Chatter, a feature highlighting representative moves, transactions, and kudos from around the industry.
Personnel Chatter
Al Behr has been promoted to be Executive Vice President at Nucor Corp. as Ladd Hall retires.
Christian Schrade assumed the responsibilities of former Managing Director of Tenova LOI Thermprocess GmbH as Erik Míček retired from the company.
Janet Nanni, PHR, SHRM-CP, was recently announced the new Director of Human Resources at Ipsen, after the May 6 retirement of longtime Ipsen HR Director Nancy Kolar.
Joe Conyers joins the sales team at Graphite Metallizing Corp.
Lilia Jasso is announced the new President of the ASM Mexico Chapter.
Michael D'Ambrose is named Executive Vice President of Human Resources at Boeing, succeeding Wendy Livingston, effective July 6, 2020.
Solar Atmospheres of Western PA (SAWPA) announced the addition of Melissa Gruszka to our team as Quality Manager.
Al Behr, Executive Vice President, Nucor Corp.
Christian Schrade, Managing Director, with Torsten Koepchen, CFO, of Tenova LOI Thermprocess
Janet Nanni, Director of Human Resources, Ipsen
Joe Conyers, sales, Graphite Metallizing Corp.
Lilia Jasso, President, ASM Mexico Chapter
Michael D'Ambrose, Executive Vice President of Human Resources, Boeing
Melissa Gruszka, Quality Manager, Solar Manufacturing
Company Chatter
Aerospace Testing & Pyrometry (ATP) is acquiring the assets and clients of AKA Calibrations starting June of 2020.
McLaughlin Furnace Group is continuing to build their new building, upgrading both for doubled capacity and product expansion.
MetalPro Resources, consisting of Jim Senne, Steve Maus and Bill Andreski, will assume the role of Sales Representative for the states of Ohio, Indiana and Kentucky on behalf of Solar Manufacturing.
Thermal Vac in California is building up its new location in Arizona, USA.
Jim Senne, Steve Maus and Bill Andreski at MetalPro
Kudos Chatter
Bombardier officially closed the sale of the CRJ program to Mitsubishi Heavy Industries, Ltd (“MHI”). This marks a turning point for Bombardier as it completes their exit from the Commercial Aviation market.
Magnetic Specialties (MSI) announced the launch of their redesigned website, www.magspecinc.com.
MSI launches updated website
Special Mention
On Tuesday, April 28th, 2020, Thermcraft Inc. lost its president and CEO, Mr. Thomas Morris Crafton, at 67. Tom was a dedicated and diligent leader and friend in his personal life and to those in the company.
In 1978, Tom and his wife, Nancy, moved to Winston-Salem where he joined his parents, Mr. Morris L. Crafton and his wife, Clara, at Thermcraft, founded by the couple in 1971. Tom was a successful businessman and was greatly admired by his colleagues, continually developing lasting bonds with those around him.
Tom became President & CEO of Thermcraft, Inc. and expanded the company internationally. In his time at Thermcraft, he has given presentations about small businesses in Washington DC and has relationships with companies throughout the US, Europe and Asia.
He created meaningful connections with customers and his employees, having both a witty sense of humor and always being quick with a comeback. During his daily presence at Thermcraft, Tom mentored, counseled and advised his employees, many of whom he considered his friends. He will be missed by everyone who knew him.
Heat TreatToday offers its condolences to the family of Mr. Thomas M. Crafton and the team at Thermcraft Inc.
Heat TreatToday is pleased to join in the announcements of growth and achievement throughout the industry by highlighting them here on our News Chatter page. Please send any information you feel may be of interest to manufacturers with in-house heat treat departments especially in the aerospace, automotive, medical, and energy sectors to editor@heattreattoday.com
Heat TreatToday wants to wish you a Happy Independence Day Weekend! We hope in the midst of this warm summer, as the country fluctuates between “opened” and “closed,” we remember the ideals of freedom and honoring all our neighbors, whom we get to be so close to now. From the thankful hearts for this country here at Heat Treat Today, Happy 4th of July!
In today’s article, Heat Treat Today’s editorial staff has gathered noteworthy reflections of heat treaters who are looking to the past to offer hope to present circumstances. Read more to see that while the present seems paused with Covid-19, the past offers promise of growth and change through challenges.
Like many markets, the heat treating industry is seeking to make the best out of this summer of 2020, and even though the market is looking more positive by the day, there are many who still look for a sense of normalcy. However, with leaders looking at historical moments in heat treat, they remind us that while the present seems paused with Covid-19, the past offers promise of growth and change through the challenges of life.
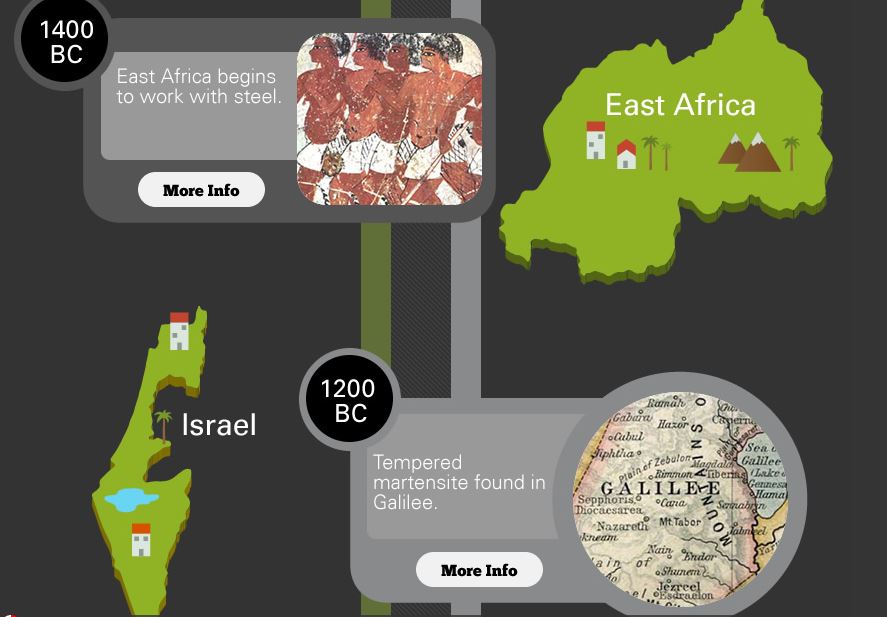
Sceenshot of Bodycote’s “An Interactive History of Metallurgy” (photo source: https://www.bodycote.com/history-of-metal/)
A major reach into the past is a throwback to the 90th century BC called “An Interactive History of Metallurgy.” In this historical timeline, Bodycote presents an engaging look at copper, bronze, iron, and tin through the centuries. The developments include detailed information, mostly funneled from Wikipedia, like the fact that bronze alloy in 12th century English candlesticks contained a degree of silver, antimony, and arsenic. And the modern, continuous development of steel is believed to have begun in the carbon furnaces of Sub-Saharan African communities.
(photo source: SECO/WARWICK)
On June 30, 2020, SECO/WARWICK released an “anniversary reflection” to commemorate the achievements of the Group in the first half of 2020. Among these is the 10th anniversary of their Chinese branch which has now become a recognized leader of CAB systems in heat treat, creating furnaces for aluminum brazing in controlled atmospheres. They conclude their message with a word from Sławomir Woźniak, President of the ManagementBoard, saying, “We wish that health, patience and faith – embracing the world at large – will return to normal.”
Sanderson’s Weir (photo source: Shane Higgins on LinkedIn)
Finally, a recent LinkedIn post from Shane Higgins, Field Sales from Special Quality AlloysLtd, shared a lunch-time crowd favorite: Sanderson’s Weir, built in the 1580s. With two iron forges on either side of the River Don in Sheffield, this low dam was built to provide power to the industrial work. Changes in the nature of industry has allowed a 20-year project along the River Don in Sheffield and Rotherham to permit a fish pass for salmon after 200 years without. It is impressive that the location that once produced iron still houses metalworking business.
The latest Industrial Heating Equipment Association’s (IHEA) Executive Economic Summary begins, “The lockdown recession has been with us for over three months now, and there are few that have not experienced the impact.” How true are those words. But, be encouraged, “By most accounts this will be the bottom, and future reports will start to show slow improvement . . . there have been consistent assertions that economic growth will rebound by the third and fourth quarter.” Some may doubt the optimism, however, “there are some indications that such a forecast may be realistic.”
The indices share a consistent theme in that all show a decline “that are nearly a straight line down.” Yet, there is one notable exception: the data for the Credit Managers’ Index reveals the same severe decline, but with an upward trend at the end. The summary explains, “The index is divided into favorable and unfavorable categories from the perspective of a credit manager. The favorables include categories such as ‘sales,’ ‘applications for credit,’ ‘dollar collections’ and ‘amount of credit extended’. The unfavorables include ‘rejections of credit applications,’ ‘accounts out for collection,’ ‘disputes,’ ‘slow pays’ and ‘bankruptcies’.”
The decline that was evident in March and April was due “almost entirely to the collapse in the favorable data.” But in May, they improved substantially. Interestingly and optimistically, “Credit managers tend to think in the future as they are most concerned with what shape a debtor will be in when they are due to pay. If a company has 90 or 120 or 180 days to pay the credit manager is not going to worry about them until that time. The fact that they are getting a bit more confident now indicates that they are starting to see some positive developments down the road and not all that far away.”
The upward trend in the Credit Movement shows positive progression down the road in the not too distant future.
The other indices share a woeful tale with record setting declines. The report explains, “There is no mystery at all as to why this is the case as the lockdown was universal and sudden. There was no time at all for business or the consumer to prepare, and there have been very few options available since the declaration.” However, the U.S. Labor Department released the latest job numbers and there were expectations that the unemployment number would hit 20%, but in reality the number was 13.4%.
So, where does the economy go from here? The summary cites three factors that will come into play: First, the attitude of the consumer — “If there is to be a real rebound the consumer will have to want to resume their old behaviors and soon.” Second, the action of the government — “[This] has varied from state to state. Some have been eager to reopen and others have put off this resumption until into 2021.” Third, the course of the viral infection — this will drive the first two factors.
Buckle up, folks, the wild adventure continues!
The report is available to IHEA member companies. For membership information, and a full copy of the 12-page report, contact Anne Goyer, Executive Director of the Industrial Heating Equipment Association (IHEA). Email Anne by clicking here.
“High-pressure gas quenching (HPGQ) attempts to reduce temperature nonuniformities by reducing the cooling rate; however, this is generally not sufficient to eliminate shape change. Shape change can be predicted by heat treatment simulation software, but it is difficult to reproduce the exact same cooling conditions in the vessel for each batch. Therefore, the distortion of the components will not be consistent from batch to batch.”
Read the case study to see one response to this issue in this original content from Heat Treat Today by Justin Sims, lead engineer at DANTE Solutions.
This article first appeared in the latest edition (March 2020) of Heat Treat Today’s Aerospace Heat Treating magazine.
Distortion is generally described by a size change and a shape change. In heat treatment of steels, size change is unavoidable and is mainly due to the volumetric difference between the starting microstructural phase and the final microstructural phase. Shape change of steel parts from heat treatment is due to nonuniform thermal and nonuniform microstructural strains as a result of nonuniform cooling or heating, alloy segregation, poor support of the component while at high temperature, thermal expansion or contraction restrictions, or residual stresses from prior forming operations. Nonuniform cooling or heating can be as fundamental as the temperature gradient from the part surface to its core, or as complex as the flow of fluid around a component feature. Both can result in nonuniform strains, resulting in a shape change. If the stresses causing these strains exceed the yield strength of the material, then permanent shape change will occur. Size change can be anticipated and is predictable, while shape change, or distortion, is usually unanticipated and more difficult to predict.[1-2]
Justin Sims, Lead Engineer, DANTE Solutions
Most thermal processes try to control these nonuniformities using methods of low complexity such as part orientation and rack design. Quenching systems, for example, are generally designed to remove as much thermal energy from the work pieces as possible and to do this as quickly as possible. High-pressure gas quenching (HPGQ) attempts to reduce temperature nonuniformities by reducing the cooling rate; however, this is generally not sufficient to eliminate shape change. Shape change can be predicted by heat treatment simulation software, but it is difficult to reproduce the exact same cooling conditions in the vessel for each batch. Therefore, the distortion of the components will not be consistent from batch to batch.
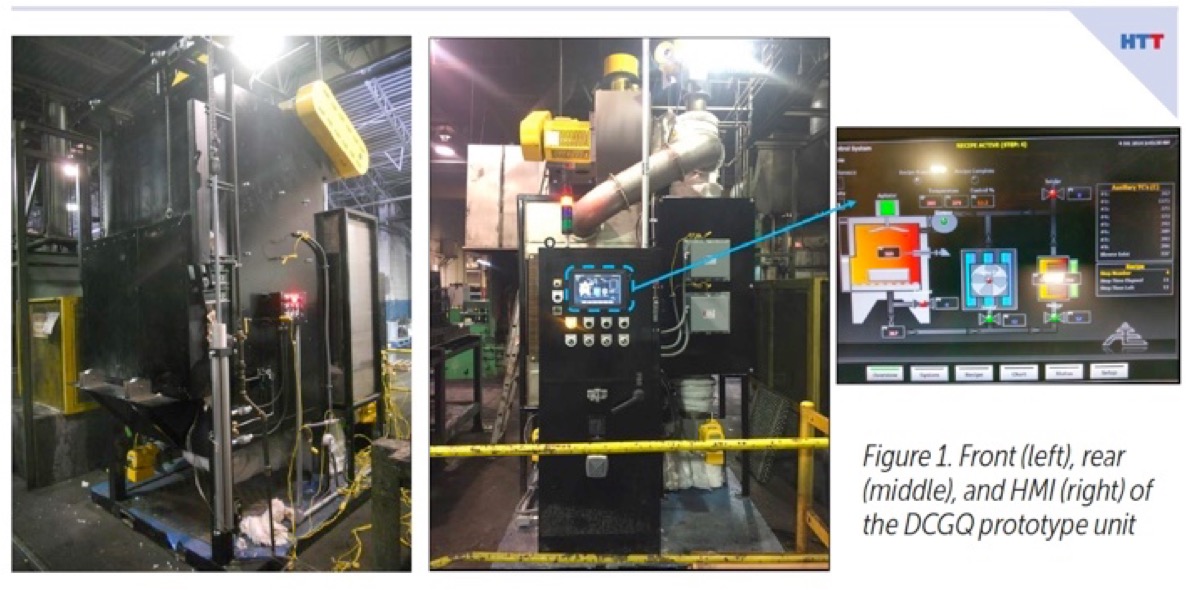
In response to this issue, a prototype gas quenching unit capable of controlling the temperature of the quench gas entering the quench chamber was devised. With the DANTE Controlled Gas Quench (DCGQ) unit, it is possible to have control of the thermal and transformation gradients in the component by controlling the temperature of the incoming quench gas, thereby significantly reducing, or eliminating entirely, the shape change caused by quenching. In doing so, the size change can easily be predicted by heat treatment simulation software, and post-hardening finishing operations can be reduced or eliminated. This process is ideal for thin parts or components with significant cross-sectional changes. Atmosphere Engineering (now part of United Process Controls) in Milwaukee, Wisconsin constructed the unit and provided the logic to control it. All experiments with the unit were conducted at Akron Steel Treating Company in Akron, Ohio. The project was funded by the U.S. Army Defense Directorate (ADD).
Figure 1 (left) shows the front of the unit, while Figure 1 (middle) shows the back of the unit. The back of the unit contains the human machine interface (HMI), shown in Figure 1 (right), where process parameters can be modified and DCGQ recipes entered. The prototype unit has a working zone of nine cubic ft. and is capable of quenching loads up to 100 lbs. at one atmosphere of pressure.
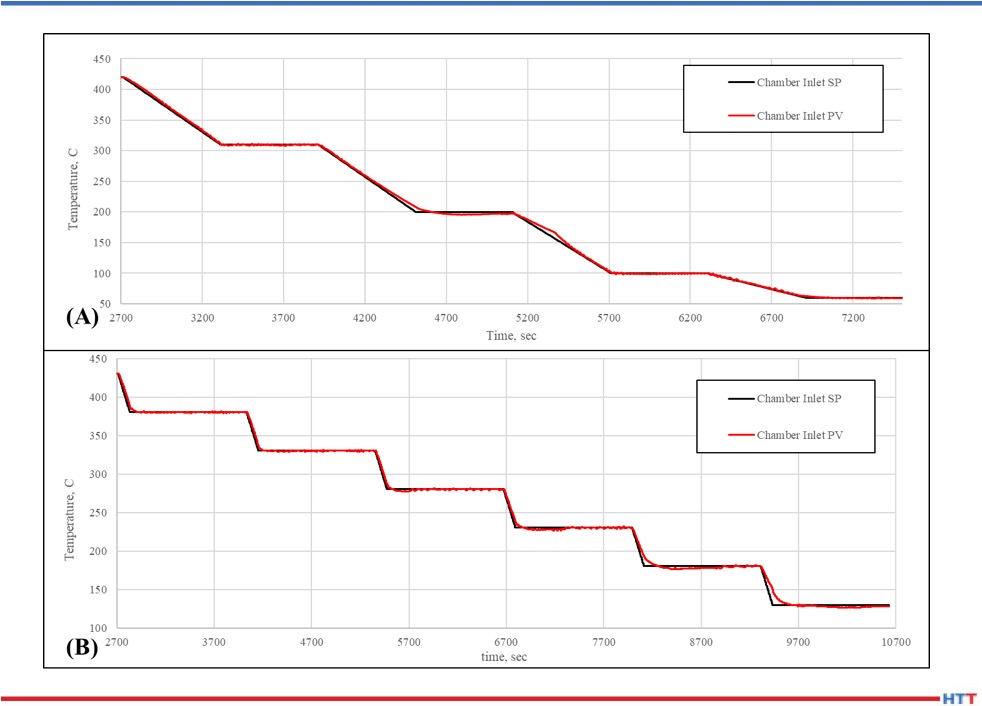
Figure 2. Comparison of quench gas temperature entering the quench chamber versus the recipe setpoint temperature for two different DCGQ process recipes
The ability of the unit to maintain continuity between the recipe setpoint temperature and the actual temperature entering the quench chamber is absolutely paramount. Figure 2 shows two schedules, one aggressive and one conservative, comparing the recipe setpoint (Chamber Inlet SP) to the actual quench gas temperature (Chamber Inlet PV). Figure 2 also shows that the prototype unit has good control of the quench gas temperature between 752°F (400°C) and room temperature, the martensite transformation range for most high hardenable steel alloys. There is some deviation between the two temperatures below 392°F (200°C) for the aggressive schedule as the setpoint reaches its set temperature, due to the relatively small temperature difference between the quench gas and the shop air. This small temperature difference makes it slightly difficult for the air-to-air heat exchanger used in the design to keep up with the rapid drop in temperature, but overall there is very good control of the quench gas temperature.
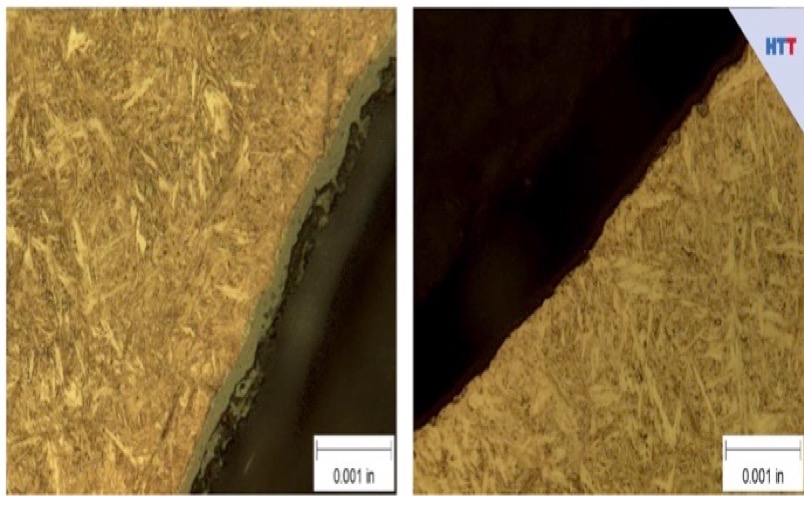
Figure 3. Micrograph of DCGQ (left) and HPGQ (right) processed coupons, mag. 1000X There is a copper layer on the surface of the DCGQ processed coupon.
Microstructural examination was conducted on Ferrium C64 coupons processed using the DCGQ process and coupons processedusing a 2-bar HPGQ. C64 was chosen for this study due to its extremely high hardenability and its high tempering temperature. Figure 3 compares the microstructures of the two processes at a magnification of 1000X, and no significant difference is detected. The DCGQ coupons required two hours to complete the transformation, whereas the HPGQ coupons transformed in a few minutes. There is no indication that the slow rate of transformation damaged the microstructure or mechanical properties in any way. Tensile and Charpy properties were equivalent between the two processes.
Distortion coupons, thick disks with eccentric bores, were designed and manufactured with the goal of evaluating the distortion response when subjected to a DCGQ process, and then compared to coupons subjected to a standard 2-bar HPGQ operation. All coupons were manufactured from the same Ferrium C64 bar stock. All coupons were cryogenically treated and tempered at 595°C for eight hours after quenching.
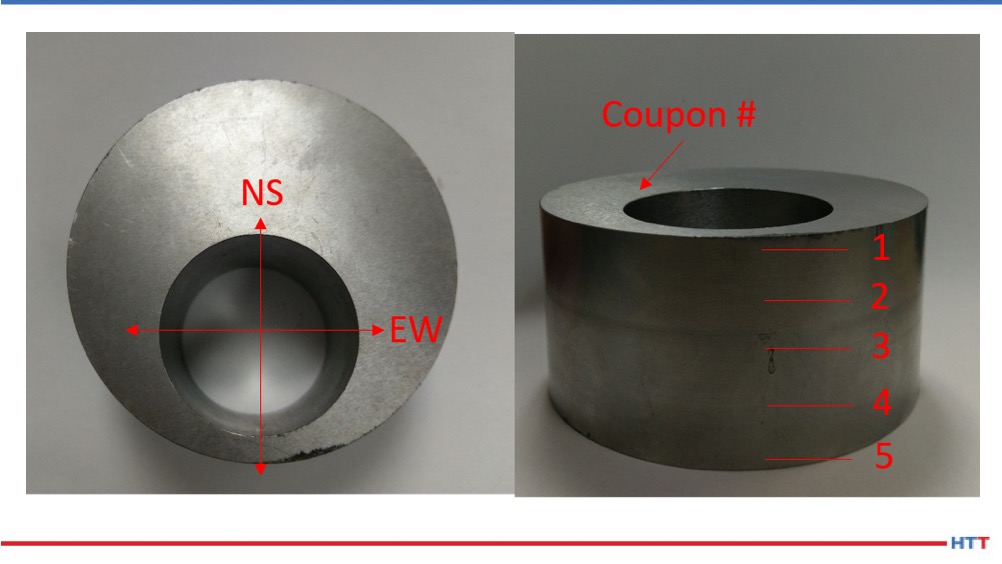
Figure 4. Nomenclature and locations used for out-of-round measurements on the distortion coupon
Figure 4 shows a distortion coupon with the nomenclature and locations used for measuring the out-of-round distortion of the eccentric bore. Due to the uneven mass distribution, the north-south direction will generally be larger than the east-west direction. Five measurements were then made along the axis of the coupon using a Fowler Bore Gauge.
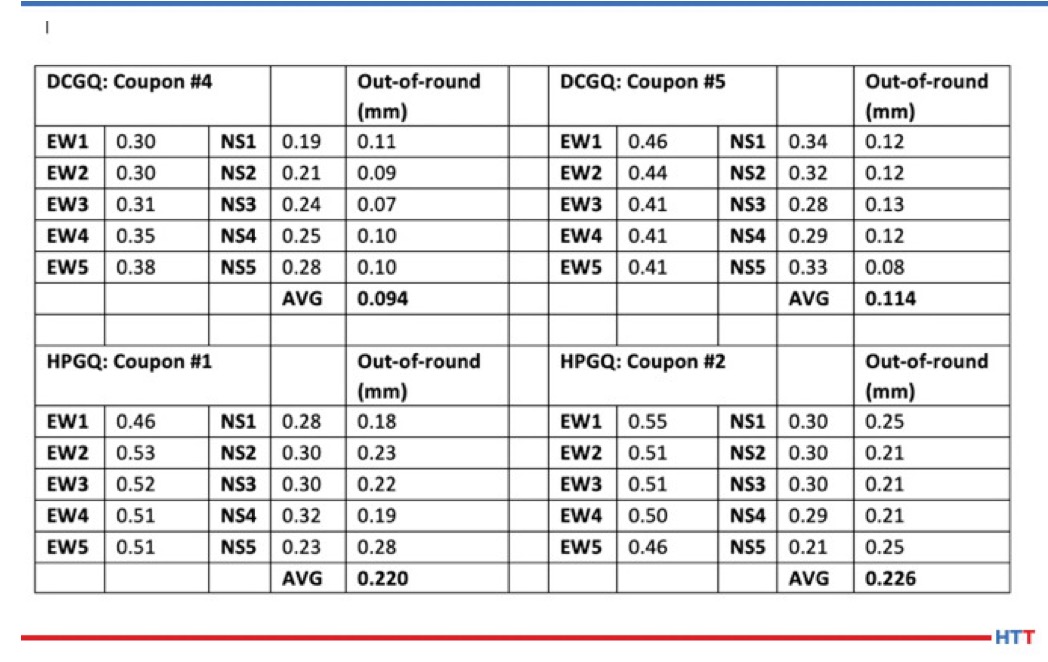
Table 1. Out-of-round distortion measurements of the distortion coupon for a DCGQ and HPGQ process
Table 1 shows the results from four coupons; two hardened using the DCGQ process and two processed using the standard 2 bar HPGQ for C64. The individual measurements (EW1, NS5, etc.) are relative and are dependent on the reference value used for the bore gauge. The individual measurements give an indication of the variation in distortion in the axial direction. The out-of-round measurements are actual values, as they are the difference between the actual measurements. The DCGQ process gave significantly less distortion than the HPGQ process.
While the values reported show a 50% reduction in out-of-round distortion for the DCGQ process, a larger gain could have been realized if two other conditions were addressed. First, the coupon for DCGQ was placed directly into a 1832°F (1000°C) preheated furnace since the prototype unit does not have austenitizing capabilities. Controlled heating, just like controlled cooling, should be utilized to realize the full potential of this process. Second, the DCGQ schedule was designed for another coupon geometry that was processed together with these distortion coupons. Therefore, the schedule was not optimum for this coupon geometry.
Table 2. DANTE simulation results comparing HPGQ and DCGQ using the experimental conditions and a DCGQ with optimized heating and cooling schedulesMARCH 2020
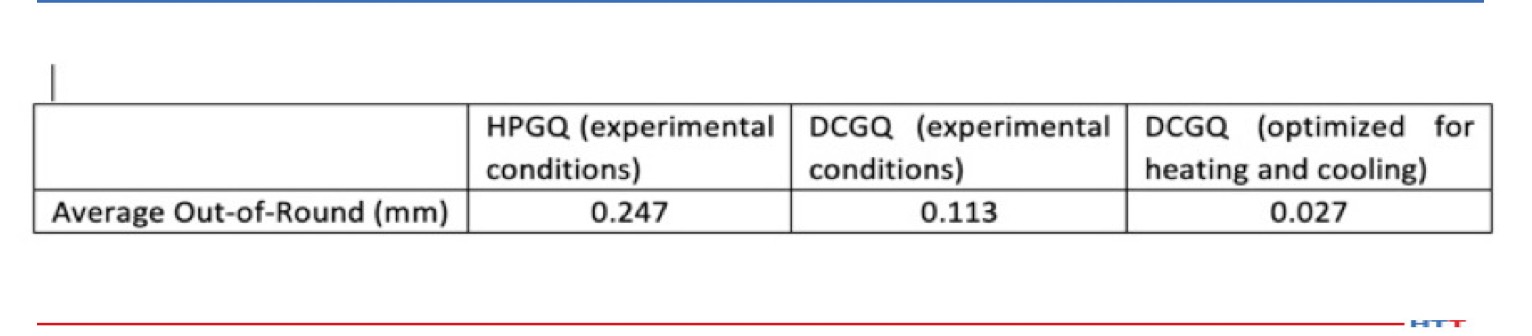
Table 2 compares the DCGQ simulation results in which the two processes executed on the experimental coupons were compared to an optimized process, including controlled heating and cooling schedules designed for this coupon. The optimized schedule predicts an order of magnitude reduction in out-of-round distortion. Comparison of the measurements from the HPGQ and DCGQ experiments in Table 1 to the model predictions in Table 2 shows that the model predictions agree closely with the experimental results.
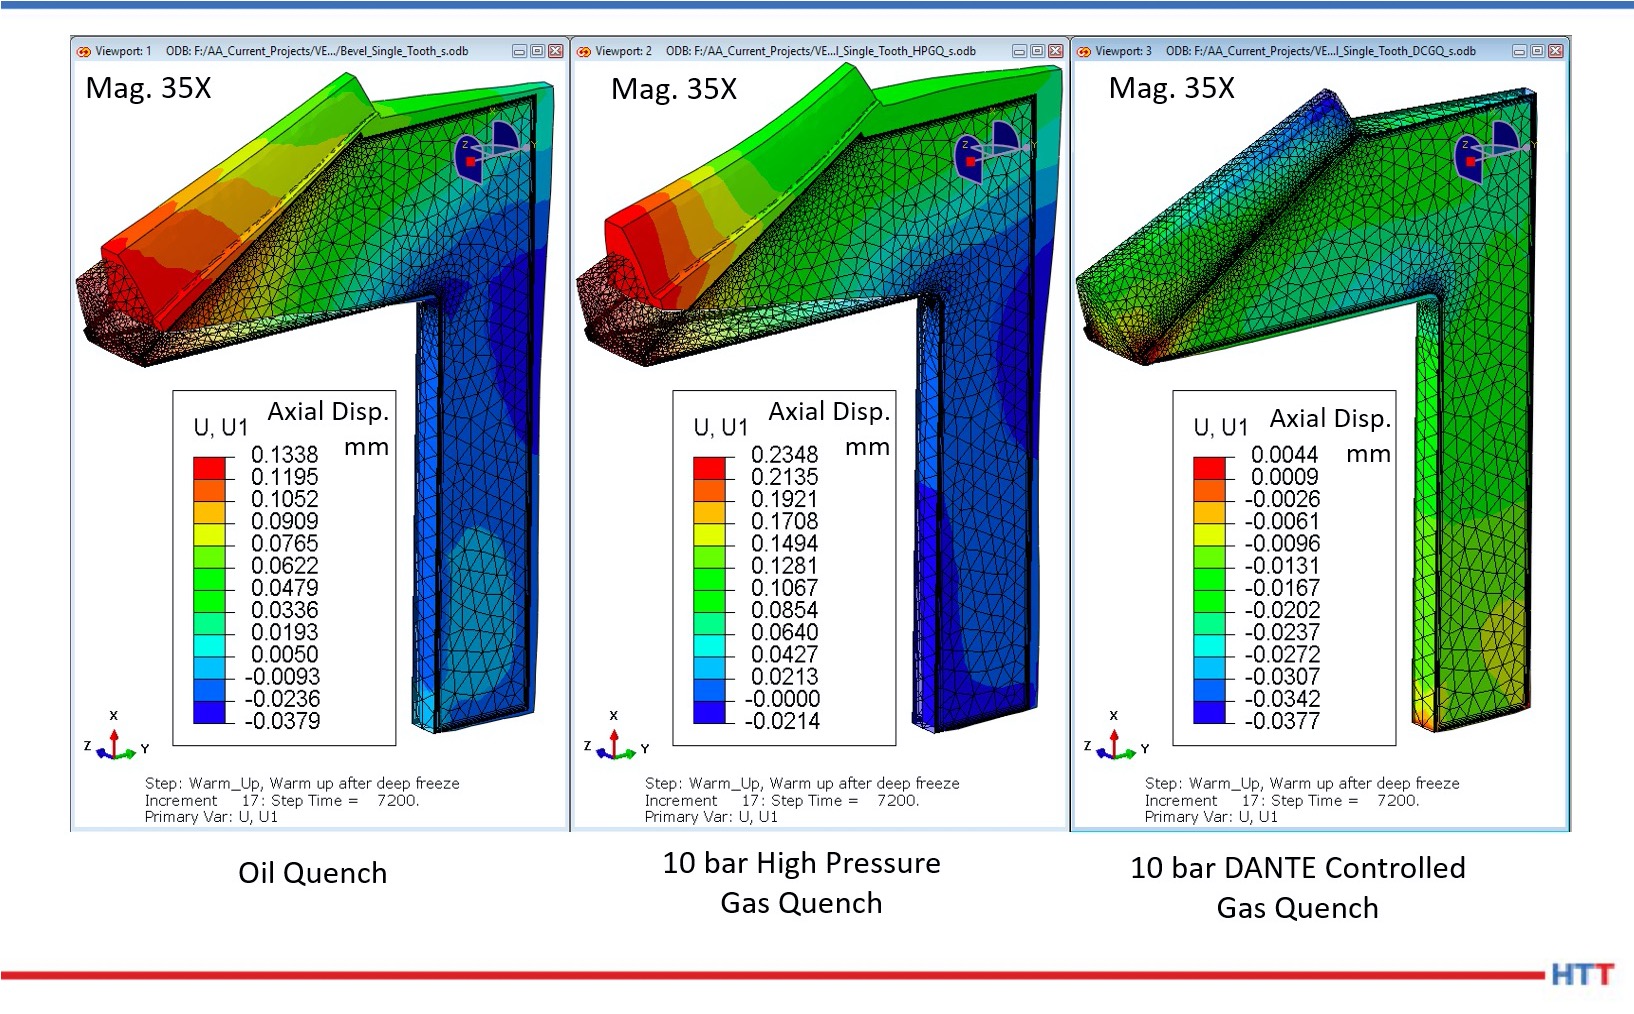
Simulating the application of the DCGQ process to a gear geometry, the predicted warpage of a bevel gear was examined. The simulation looked at the differences between an oil quench, 10 bar HPGQ, and a 10 bar DCGQ process. From Figure 5, it is clear that the HPGQ process is predicted to produce the most distortion. Even though the 10 bar gas quench has a slower cooling rate than the oil quench, less distortion is not guaranteed since a slower rate does not guarantee a more uniform phase transformation.[3] In this case, both heating and cooling were controlled for the DCGQ simulation.
Figure 5. Comparison of oil quench, HPGQ, and DCGQ processes for a bevel gear
In summary, a prototype gas quenching unit has been constructed with the ability to accurately control the temperature of the quench gas entering the quench chamber. Experimental results have shown that mechanical properties and microstructure are equivalent between the DCGQ process and a 2-bar HPGQ process for Ferrium C64. Thick disks with eccentric bores were machined and then heat treated using DCGQ and HPGQ. It was shown that the DCGQ process reduced distortion in these disks by 50%. Simulation using DANTE then showed that the distortion could be reduced further if controlled heating and cooling are used. Finally, a comparison was made between an oil quench, HPGQ, and DCGQ processes for a bevel gear. This comparison showed that the HPGQ process was predicted to cause the most distortion. HTT
References
[1] Prabhudev, K.H., Handbook of Heat Treatment of Steels, Tata McGraw-Hill Publishing, 1988, p.111-114
[3] Sims, Justin, Li Zhichao (Charlie), Ferguson B. Lynn, Causes of Distortion during High Pressure Gas Quenching Process of Steel Parts, Proceedings of the 30th ASM Heat Treating Society Conference, ASM International, 2019, p.228-236
About the Author: As an analyst of steel heat treat processes and an expert modeler of quench hardening processes, Justin Sims was the lead engineer for designing and building the DANTE Controlled Gas Quenching (DCGQ) prototype unit. This system was developed to minimize distortion of quenched parts made of high hardenability steels, while still achieving the required properties and performance.
Carl Nicolia, President of PSNERGY, LLC (photo source: Carl Nicolia)
“There was a time when the caveman’s torch was the top end of heat treating technology. We have since learned that all fire is not created equal. Heat treat technology has evolved from fire to combustion and from combustion to efficient combustion.”
Join Carl Nicolia, president of PSNERGY, LLC, as he challenges industry leaders to evolve with viable and proven solutions to achieve combustion and furnace efficiency in this original Heat Treat Today article.
This article appears in the June edition of Heat Treat Today’sAutomotive Heat Treating magazine.
As a technical professional, engineer, and self-proclaimed geek, in times of uncertainty I take comfort in going back to fundamentals. Going back to basic concepts defined by fundamental scientific principles of physics and heat transfer brings us to a point where we know what will happen, and this can give us all some comfort in these uncertain times. We can take comfort in knowing that when we combine the right mix of air and fuel with an ignition source, we will get fire! And as the caveman said, “Fire good!”
There was a time when the caveman’s torch was the top end of heat treating technology. We have since learned that all fire is not created equal. Heat treat technology has evolved from fire to combustion and from combustion to efficient combustion. We have learned how to optimize the delivery of energy produced by fire to achieve remarkable results. There is high-value technology available today (i.e. low cost with high impact) that can be quickly and easily implemented on existing furnaces, regardless of size or age.
Businesses are moving through some of the most challenging times in modern history. Even though a few months ago the economy was booming, we are now being pushed to respond in new and unique ways. Many businesses, though, have existed for generations and have overcome other challenging market conditions. How did they survive? They evolved!
Darwin was right; “It is not the strongest of the species that survives, not the most intelligent that survives. It is the one that is most adaptable to change. Intelligence is based on how EFFICIENT (my emphasis) a species became at doing the things they need to survive.”
Industries coming back online after extended down times and lost production days, are driving new customer demands for quality parts produced faster and cheaper. End customers are executing plans to ramp-up their plants to run at maximum efficiency. They are securing additional critical inventory and capacity from their supply chain. The productivity ante has been raised! Have your operations evolved to meet these demands?
Combustion efficiency and furnace efficiency are the heart of all gas-fired heat treating operations. Combustion and furnace efficiency can mean the difference between profit and loss, high quality and scrap, survival and extinction. Now more than ever, finding low-cost, easily-implemented technologies to increase efficiency is critical to your business’s evolution. Good news: Products and services enabled by revolutionary technology exist today and can improve the efficiency of your business. Because the technology is revolutionary, the implementation is simple.
Case Study
To understand the impact of this type of innovative technology, let’s look at an example from a contract heat treating company with a 9’ IQ box furnace. This batch annealing furnace is heated by four 5” ID x 65” U-tubes with bayonet recuperators. The company installed the latest technology of radiant tube inserts (RTI) into the exhaust legs of the radiant tubes. Once the RTI’s were installed, the combustion system was tuned, utilizing the latest sensing technology. The results are impressive:
Recovery cycle time reduced by 25%
Total gas consumption per load reduced by 5%
Furnace output increased by 10%
Total time to implement this solution was one day. Total cost to implement this solution was less than $10,000. Payback on this installation was less than three months!
Combustion Efficiency
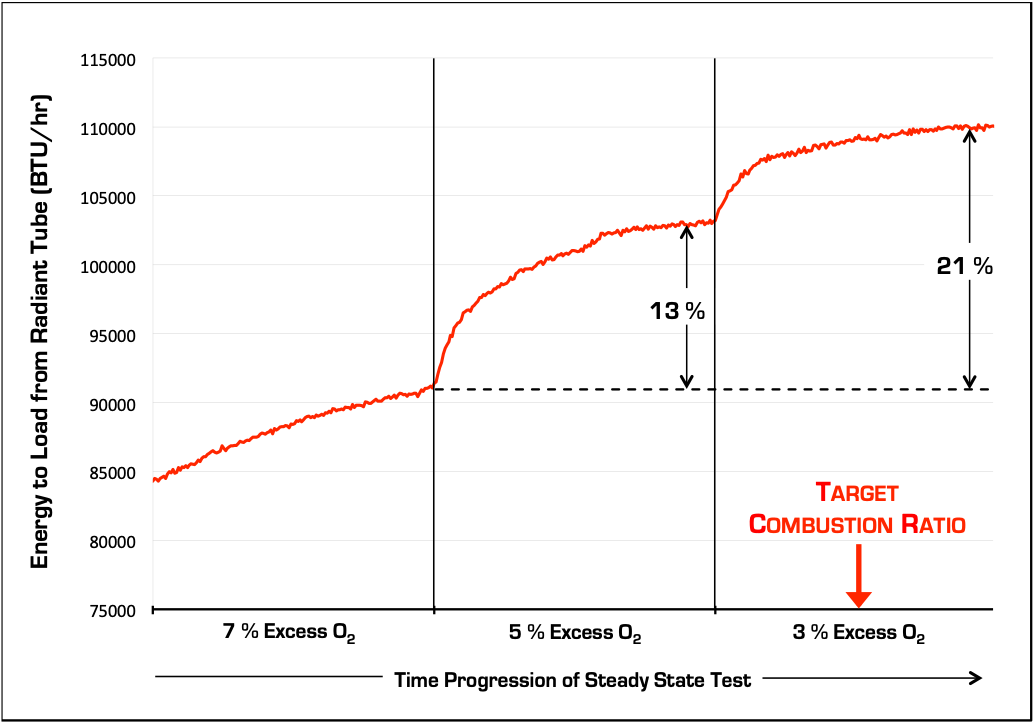
Combustion efficiency is getting the most energy out of the gas purchased and ensuring you continue getting that same level of performance. Most talk about the importance of proper tuning, yet how many recognize the likelihood they are not running optimally today and can quantify the impact? A furnace running just two points out of tune at 5% excess oxygen is delivering 8% less energy to the system. Jump that to 7% excess oxygen and you are throwing away over 20% of the energy. Keeping the combustion system in tune is critical (Figure 1).
Figure 1: Impact of proper combustion tuning. (photo source: Carl Nicolia)
Just like the caveman, gone are the days of running through the burners with a handheld meter once a year, making adjustments based on a single point in time. There are combustion engineering service teams utilizing the latest technology to achieve higher levels of system performance. It is no longer acceptable to take a burner view of combustion: It must be at the combustion system level. If your service team is still working with single handheld meters, it is time to evolve. At a minimum, service teams today should be equipped with the latest sensing technology that allows them to view combustion in entire zones, if not entire furnaces, record data over the range of operation, and store this data for trending and preventive maintenance.
Once the combustion system is tuned, it is necessary to ensure the system stays tuned. Technology that monitors combustion across the entire furnace multiple times per day is available. Utilizing the latest sensing equipment, along with leading edge controls and IIOT technology, these systems seamlessly collect, analyze, and store combustion data and provide simple actionable alerts that keep your combustion system operating at maximum efficiency. Utilizing this type of technology allows you to stay ahead of combustion efficiency in real time and prevent your operation from throwing away profits.
Furnace Efficiency
Getting and keeping maximum combustion efficiency is certainly the first step in your evolution; however, the only thing you get paid for is getting that energy to product. How well the energy provided through efficient combustion is transmitted to the product being processed is called furnace efficiency. Again, there is low-cost, high-value technology available to increase furnace efficiency.
Waste heat recovery technology continues to evolve. Recuperators have been a great first step that many in the industry have incorporated into their systems, but there is more that can be done.
Ceramic inserts are waste heat recovery devices that work alone, or in conjunction with recuperators, balancing the energy delivered across the entire length of the radiant tube, significantly improving furnace efficiency as well as increasing radiant tube life. Recent technological advancements in ceramic insert design and material have increased the effectiveness of ceramic inserts. Additionally, alternative radiant tube designs, such as bubble tubes and textured tubes, help deliver more energy to the product.
Don't let your radiant tube furnace be the caveman of your operations. Take comfort in understanding that all fire is not created equal, and many combustion technology advancements are based in fundamental scientific principles. Get more information on these low-cost and easily implemented technologies available to the heat treating industry today. Recognize that utilizing these revolutionary technologies is the key to evolving your business to measurably higher levels of responsiveness and performance and will allow your business to thrive in this environment.
Will you evolve?
About the Author: Carl Nicolia is president of PSNERGY, LLC, which provides modern solutions to combustion problems, improving equipment life, enhancing productivity, and reducing emissions through smart application of proprietary products, services, and technology.