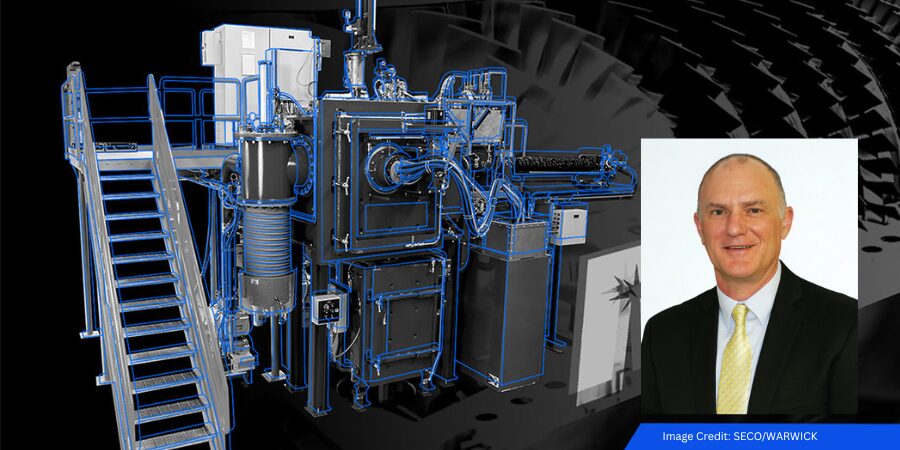
An aerospace manufacturer has ordered a vacuum furnace to support heat treatment of high-performance alloys used in aircraft components, including engine blades. The system is designed to provide controlled atmosphere processing and precise temperature uniformity required for materials such as titanium, nickel alloys, and high-temperature steels.
The vacuum furnace was supplied by SECO/WARWICK, a global manufacturer of thermal processing equipment with locations in North America, to a Thai aerospace manufacturer expanding its production capabilities. The order includes a single-chamber Vector® vacuum furnace intended for heat treatment and vacuum brazing applications.
The furnace features a working chamber measuring 900 mm x 900 mm x 1200 mm, enabling the heat treatment of larger components. It is designed to support high vacuum processes while maintaining charge purity, with solutions that limit sublimation of alloying elements and reduce contamination within the hot zone — factors that are important in aerospace component production.
“It consists of two Leybold mechanical pumps, a Roots pump, and a diffusion pump. The round heating chamber ensures excellent temperature distribution (±5°C/±9°F), and the cooling system enables rapid gas cooling to a pressure of 6 bar abs. Additionally, the furnace provides precise control of partial pressure of argon and nitrogen, which is crucial for the quality of vacuum and brazing processes,” commented Łukasz Chwiałkowski, sales manager at SECO/WARWICK.
This is the second collaboration between the two companies in Thailand. The client already owns an identical SECO/WARWICK vacuum furnace that supports the production of titanium, high-temperature steel and nickel alloy aircraft engine blades. The addition of a second vacuum is expected to increase production capacity and provide operational flexibility for the aerospace manufacturer’s thermal processing operations.
Press release is available in its original form here.
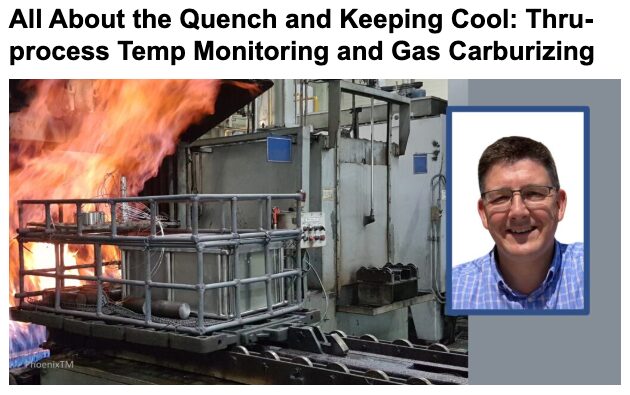
What does it really take to achieve accurate temperature measurement in the real heat treat production? In this episode ofHeat TreatRadio, host Heather Falcone sits down with Dr. Steve Offley, product marketing manager at PhoenixTM, to explore the science behind thru-process monitoring, thermal barriers, and data logger performance. From cold junction compensation to real-world shop floor challenges, they unpack why lab accuracy doesn’t always translate to production — and what heat treaters can do about it. Tune in to learn how to ensure your temperature data is as reliable as the parts you produce.
Below, you can watch the video, listen to the podcast by clicking on the audio play button, or read an edited transcript.
The following transcript has been edited for your reading enjoyment.
Introduction (00:04)
Heather Falcone: Today we are talking about a feature article coming up in this month’s magazine, Achieving Accurate Measurements in Real Heat Treat Production. Joining me today is author of this piece, Dr. Steve Offley from PhoenixTM, who is also our sponsor for today’s episode.
Steve is a product marketing manager at PhoenixTM with responsibility for both strategic product management and global marketing of the company’s thru-process temperature, optical profiling, and TUS system product range. Steve joined PhoenixTM in April of 2018 after 22 years of experience in the industrial temperature profiling market with another well-known company.
The Role of PhoenixTM (2:35)
Heather Falcone: Tell us about your role at PhoenixTM and the role of PhoenixTM, specifically how they provide solutions for the thermal processors out there.
Steve Offley: I am the product marketing manager or product manager for the range of temperature monitoring systems that we offer to the wider industrial space. We provide support for clients in a range of industries who are faced with the daily challenges of using thermal processing as part of their key manufacturing step. We offer unique solutions for those specific applications, because not every application is the same. Our goal is to allow the customer to monitor the temperature of their specific product in some form of heat treatment process.
For instance, we could be offering a solution for the coating market, where a client wants to monitor the thermal cure of a car body. They want to ensure that that car body, as it travels through the curing oven, is achieving the correct temperature, not just in the oven itself, but at the product level. So is each part of that car body achieving the right temperature for the right duration to cure the paint?
Another day we might be dealing with a food processor who, as you can imagine, when they’re dealing with food safety and HACCP requirements, they want to prove that the core of their product, which may be a chicken fillet in a deep fat fryer, is achieving the right temperature, to make sure that it’s safe and it’s an attractive product to eat. And of course, they want to be confident that the consumer is going to be healthy after consuming the product too.
In the buildings and ceramics industry, for instance, we can offer the same sort of solution for the manufacturers of bricks, building materials, tiles, etc., where the process may actually be up to three or four days long where they’re drying the products. But it’s still critical to know what the temperature is at the product level.
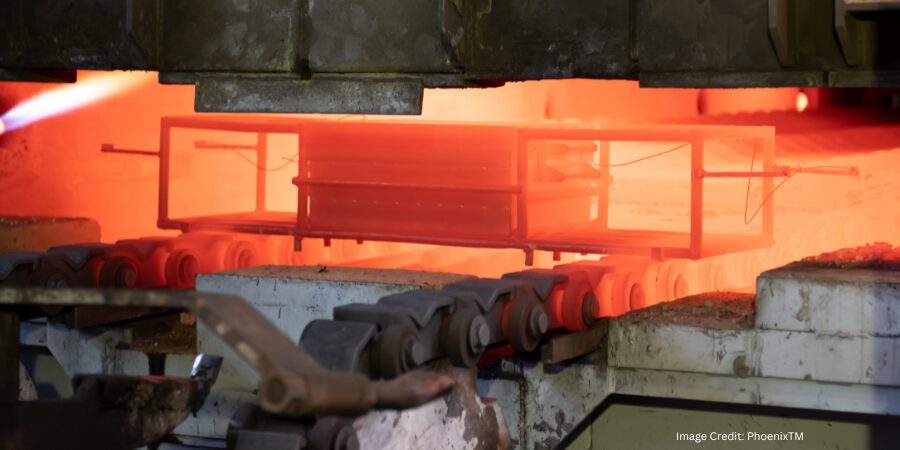
Much of our focus is on heat treatment of metals. We are trying to provide different solutions across the whole gamut of the heat treating industry — from primary production, such as slab heat treatment for steel and for aluminum, proving that the raw material has been processed correctly in the furnace, to the finished product.
We are talking about the formed metal product, making sure that that is achieving the right primary metallurgical properties. It needs to do the function it’s going to be used for, from a temperature profiling perspective and also possibly even a temperature uniformity survey (TUS), which is obviously critical in many of the automotive and aerospace sectors of the market where they’re trying to prove or validate the furnace performance.
What is Thru-Process Monitoring? (6:08)
Heather Falcone: Can you explain what thru-process is and how it influences the monitoring technology that you’re talking about?
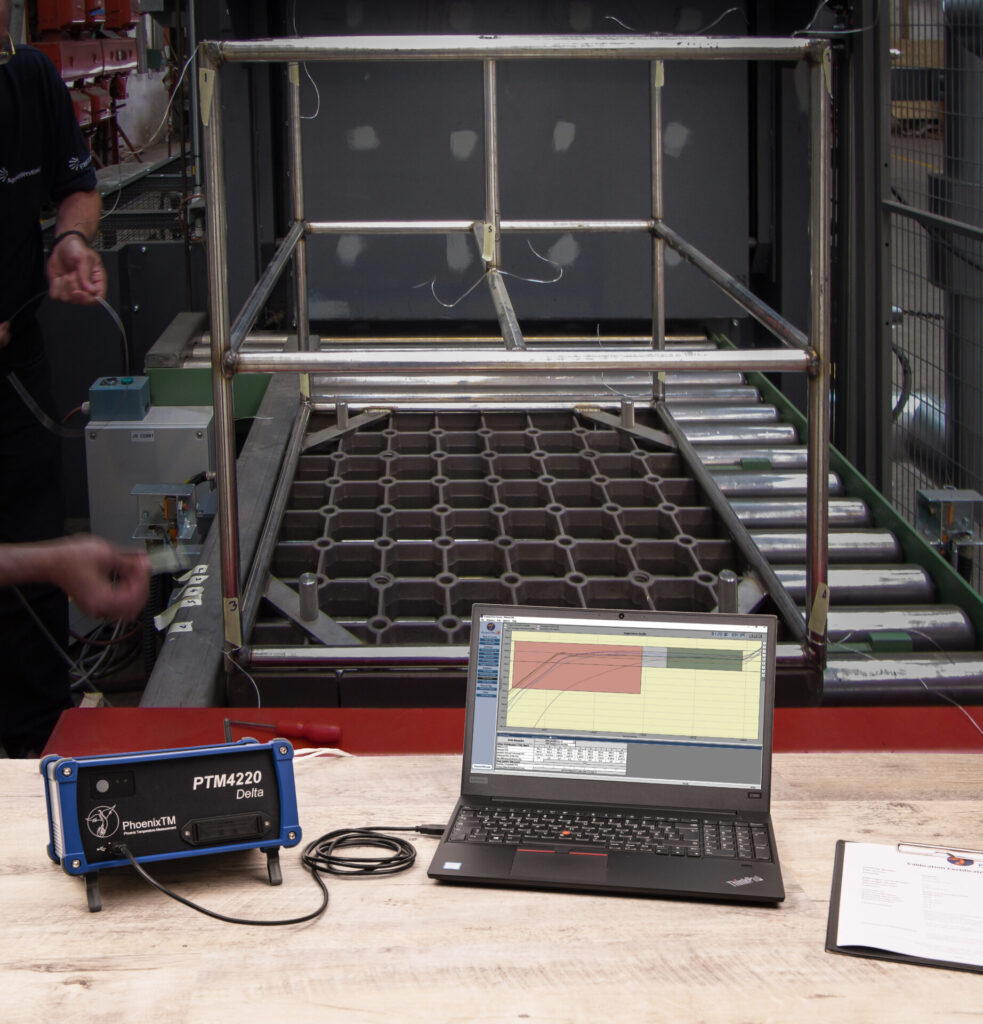
Click the image above for an introduction to the thru-process concept and data logger basics.
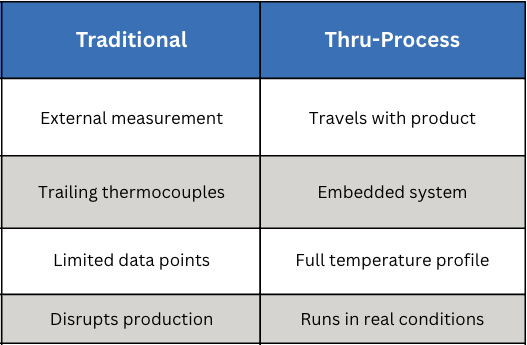
Steve Offley: “Thru-processes” is the term that is key to the type of solution we are trying to provide. When we’re talking about heat treatment, there are still many applications where the product may be heat treated in a static box furnace, in which case the traditional technology of using trained thermocouples is probably as easy as any other, whereby you have your field test instrument external to the furnace chamber. The thermocouples are then moved into — or traced into — the furnace, attached either to the product or, if you’re doing a thermal uniformity survey, to a test frame to locate the thermocouples at the desired coordinates within the working zone of the furnace. Then you are collecting the data externally.
I believe it was two episodes ago that you had Dennis from ECM talking about modular heat treatment. He was talking about the challenges of or the increased level of technology associated with moving batches of products around the heat treating cycle in a modular approach.
When you have that type of setup, and even in situations where you may be heat treating in a continuous furnace, the use of a trailing thermocouple becomes difficult at best, impractical and problematic in terms of safety at worst. For the modular approach, you have thermocouples going into different chambers and moving around. There are seals and automated doors in which the thermocouples will be trapped. As such, it’s very difficult to actually monitor the whole sequence of events that may be occurring in the heat treatment sequence.
Traditional vs. Thru-Process Monitoring
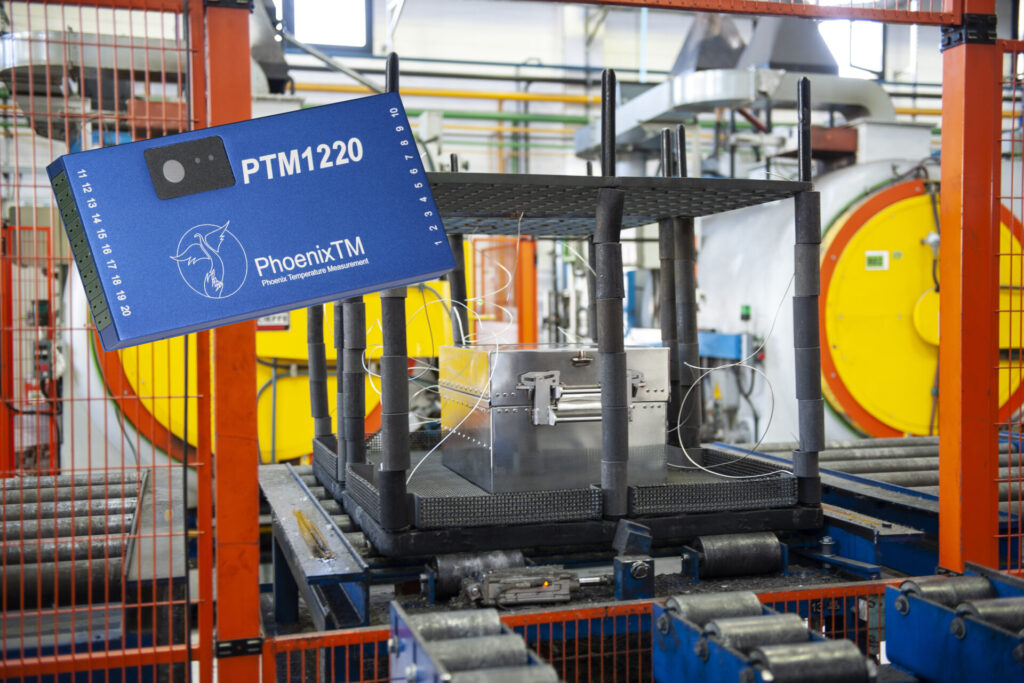
This brings us back to the thru-process methodology. At Phoenix, we offer a system that is designed to travel as if it was part of the product basket through the process. The field test instrument, the data logger, has to travel with the product through the furnace.
A data logger in its own right is not capable of going through a furnace if you are measuring at 800°F to 1000°F. One of the key aspects of our system solution is what we refer to as the thermal barrier. It is an enclosure that is used to protect the data logger to allow it to travel through the process. Essentially you encase the data logger inside the barrier and then place it on the conveyor or in the product basket with short thermocouples that are then rooted to the product or to the test frame that’s being moved with the whole monitoring system through the process.
The Importance of Thermal Barrier Design (9:38)
Heather Falcone: The thermal barrier design is really important then, because you’re going to see a variety of environments. How do you protect the data logger?
Steve Offley: That’s the crux of the technology that we’re trying to provide, in so much that there are many different forms of heat treatment or many different forms of thermal processing where we’re trying to provide the protection we need.
You may have, for instance, a low pressure carburizing process where you’re putting the system into a vacuum furnace, and then you may have a high pressure quench at the end. You have to protect the logger and not just from the temperature criteria inside the furnace, but certain things like pressure changes, which can distort the equipment. That is one design barrier, which would give additional protection to prevent any distortion or compressional damage to the barrier.
Click on the image above to find a real-world companion to Dr. Offley’s barrier design examples, covering oil and water quench protection in practice.
There may be some circumstances, like with a T6 aluminum process, where you have sent the system through the furnace, you then got a water quench, and now in the thru-process principle, the equipment has to go through all aspects of the process. You therefore have to have a design in which the system can tolerate both the heating process, but also the rapid cooling going into the water.
You may also have a situation where you have an Endothermic carburizing furnace with an integrated oil quench. The same approach applies. You are going from a hot environment and then rapid cooling. You are not only protecting the logger from the damage of the heat, but also the materials, like the oil or water in the water sequential and oil quench scenario, so as to not damage the fairly sophisticated electronics of the data log.
There is a lot of science and technology involved in designing unique solutions to meet the specific requirements of the applications. In most cases, we are working with the client from their working spec to develop unique solutions that will meet their unique requirements.
Protection and Accuracy (13:36)
Heather Falcone: When we’re talking about actually monitoring the surveys, what special measures are you required to design the data loggers with that provide accuracy?
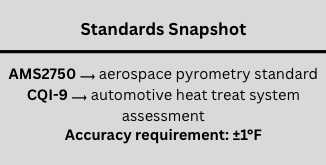
Steve Offley: By the very nature that we are sending the data logger through the furnace, we have to be careful that we are not only protecting the data logger from physical damage, which is possible if we do not get the thermal barrier design correct. But we also want, at the end of the day, to guarantee that we are achieving the accurate data that we need to make sense of the profile information that we are getting. Because at the end of the process, you either have the thermal fingerprint of your process or if you’re doing temperature uniformity survey, you have the readability of the data at the respective test levels. According to the standard CQI-9 and AMS2750, the accuracy of the reading or the field test instrument has to be within ±1°F.
The purpose of the barrier is to not only protect the data logger from damage, but keep the data logger at a working temperature that allows the accuracy of the reading that conforms to the standards that you are working to.
There are different designs of thermal barriers that we can offer. The basic design is what we refer to as the microporous insulation technology. This is basically a dry barrier whereby the insulation slows down the penetration of the heat to the core of the barrier where the data logger is. But at the center of that barrier, there will be a device that we refer to as a heat sink. There’s a eutectic salt inside the heat sink, which will transfer its physical state from a solid to a liquid at a nominal temperature. It’s 58°C where the transfer occurs and that will maintain the temperature at that working temperature.
For longer processes, you may want to use a thermal barrier that uses what we call a phased evaporation protection methodology. In simple terms, it involves the use of water, which is able to absorb very large amounts of energy and heat, and obviously will boil at 212°F (100°C). While it’s maintaining that boiling state, it will maintain the temperature of the thermal barrier and the data logger inside it. So we can actually offer a high temperature data logger that is capable of operating safely at 212°F for long periods time and still be protected.
Thermocouple Use (17:00)
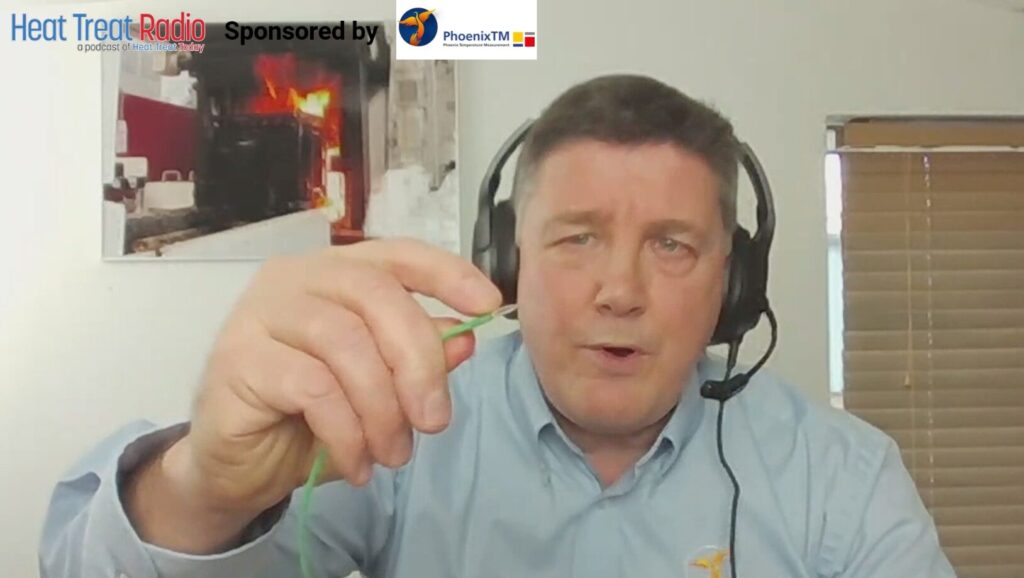
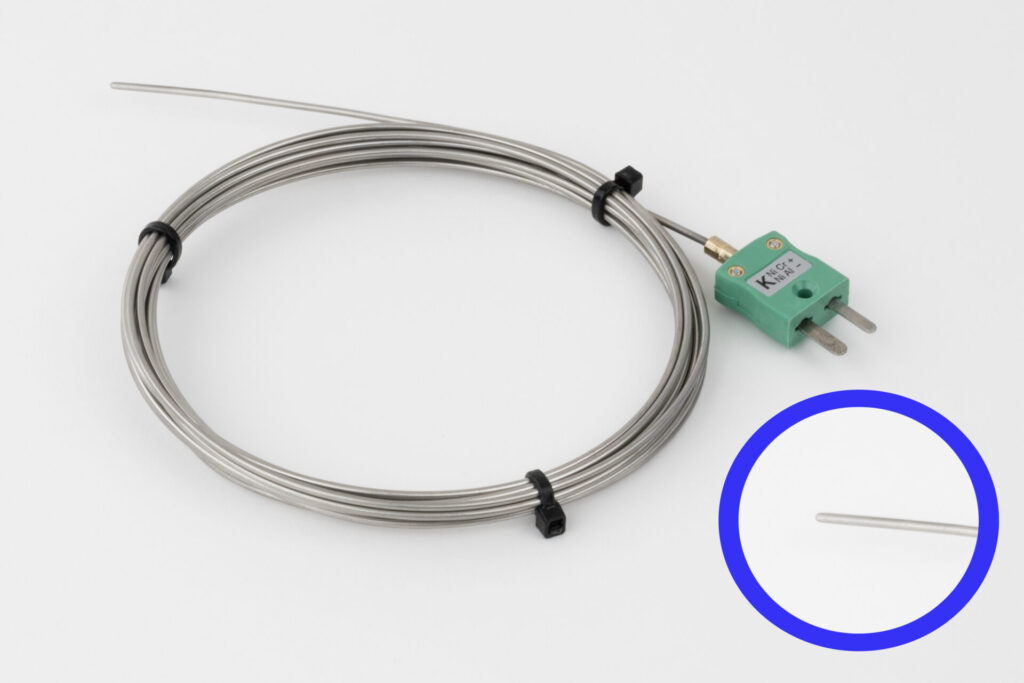
Steve Offley: As long as the barrier provides us with that thermal protection and the logger is working within its operating range, we are fairly safe. That being said, we have to be a little bit careful when we consider the technology of the thermocouple, because there’s some fairly serious restrictions on thermocouple use, which many people may or may not be aware of.
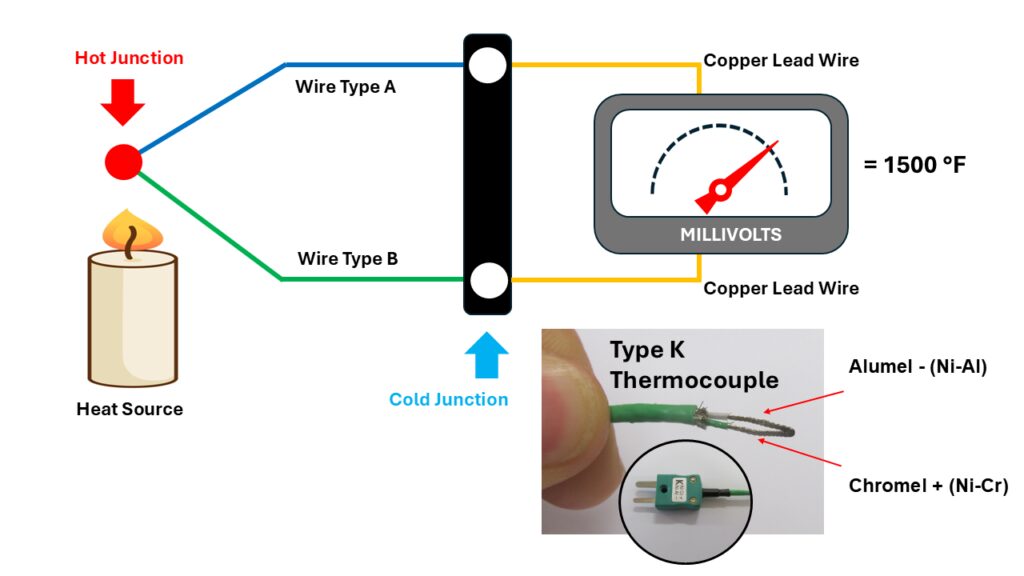
Many people know that the thermocouple technology was developed by Dr. Seebeck back in about 1821. He was a German physicist who discovered the fact that if you had two dissimilar metals connected at a junction or a point, at a particular temperature, those two dissimilar metals would create a millivolt reading, and that millivolt reading would be proportional to the actual temperature that those two dissimilar metals were experiencing. Hence the theory of the thermocouple.
Dr. Steve Offley showing the aluminal and the chromal leg of a type K thermocouple.
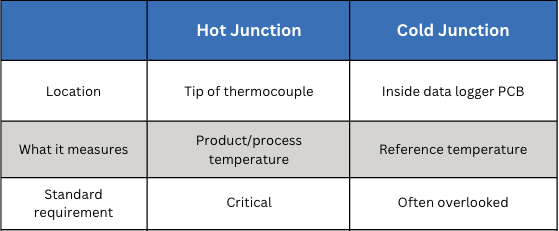
The way the thermocouple works then is that that millivolt can be cross-referenced to a calibration table or a voltage table to determine the temperature reading that the sensor. This is what we refer to as the hot junction, the very tip of the thermocouple. It’s critical that that point is where you want the measurement to be made.
What is often missed is the fact that with a thermocouple, although the hot junction is critical, there is another junction that is even possibly more critical and sometimes overlooked — the cold junction. The thermocouple does not actually record an absolute reading, it’s a ratio between the hot junction and the cold junction. The cold junction of a thermocouple is where the actual thermocouple materials, the two dissimilar metals, join what we refer to as the copper connection. This tends to be where, in the data logger or the field test instrument, the electronics make the physical measurement or process the actual reading from the thermocouple.
If you have a fixed data logger like we have at Phoenix, whereby you would designate the type of thermocouple you were plugging into the data logger — this is a data logger with 20 channels and it’s a type K — I would plug my thermocouple simply into that connector. The cold junction is not in this case at the point where I’m making the connection on the data logger. It is actually inside the logger because there is another wire that goes from the socket to the PCB board where the measurement is actually taken.
Inside the data logger, there is a connector block where the thermocouple wires from the thermocouple sockets will all join the PCB board where the measurement is taken. That’s the location where the cold junction measurement is taken. So, we have our hot junction at the end of the thermocouple, and we have our cold junction inside the data logger.
A side-by-side comparison of the two critical measurement points in any thermocouple circuit: hot junction vs. cold junction.
For some data loggers, that connector or that coal junction may actually be on the outside of the data logger, if it’s a universal connector. So it’s important that you understand where that cold junction is in-situ within your technology. The importance of the reading is the fact that you have a ratio between the hot junction where you are measuring the product and the cold junction where that physical measurement is being referenced inside the data logger.
You can imagine, therefore, if the data logger temperature changes, that change in data logger temperature can actually affect the reading you are taking inside your process. That is why it is important to either understand that and make changes so it’s prevented or do what we refer to as cold junction compensation.
Cold Junction Compensation (22:35)
Steve Offley: Inside the data logger, if you are going to compensate for that temperature difference, the data logger is protected up to a physical temperature. But the temperature is going to change. So that cold junction is going to change as it travels through the processing in the way that we do our measurements for thru-process monitoring. The logger will rise in temperature. Therefore, we have to compensate for that.
In the center of the data logger where the connection is made with the copper from the thermocouple cable to the copper-copper connection, we have a temperature sensor, a thermistor, which is accurate to 0.18°F. It measures the actual cold junction temperature of the logger, and it will then compensate automatically for that. Therefore, you can guarantee that even when your data logger temperature changes temperature, it’s compensating for that. There will be no drift in the measurement temperature that you are measuring at the hot junction at the product level.
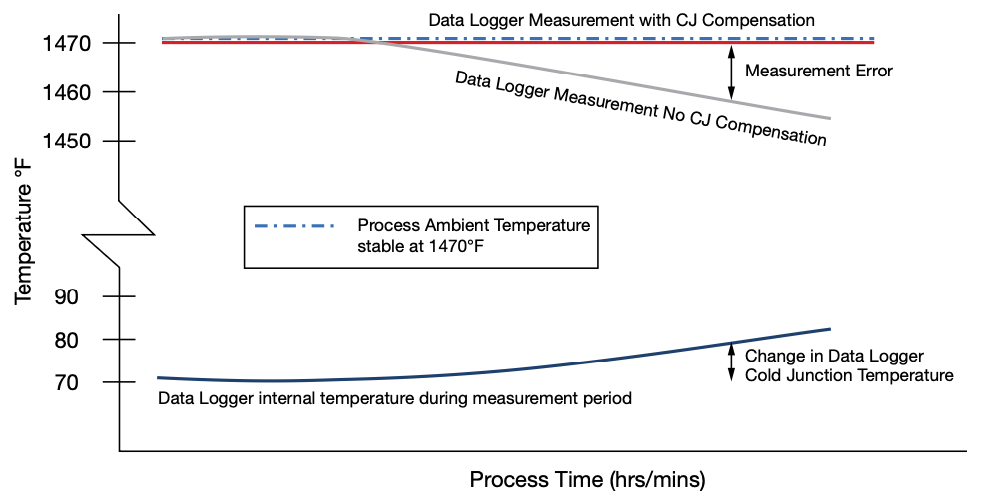
Data logger temperature change over process time, with and without cold junction compensation, measuring a stable process temperature of 1470°F | Image Credit: PhoenixTM, taken from Achieving Accurate Measurements in Real Heat Treat Production in the March print edition of Heat TreatToday.
Heather Falcone: That was the first time that I had read about the cold junction compensation and why it’s so critical, especially when we’re doing TUS activities.
Steve Offley: With TUS, the accuracy of both the data or the field testing instrument, or the data logger and the thermocouple, are critical to the quality of the test data that you are collecting and obviously trying to comply with the very stringent requirements of the AMS and the CQI-9 standards.
In our case, where we are going through the furnace, we have a worst-case scenario because the data logger is naturally going to change in temperature. But even if we take the scenario to the shop floor, and we are doing an external temperature uniformity survey, the data logger that is sitting outside the furnace, cold junction compensation is still critical for that because within a working day, the floor temperature is generally going to be changing.
Events on the shop floor, like opening the furnace activity on the shop floor, are going to change that temperature. I’ve been in many plants where seasonal changes can make a significant difference to the temperature into which you are taking the temperature. It won’t be the first time I’m sure that people have taken equipment out a car after having traveled for many miles in the early hours of the morning only to realize that the data logger temperature may not be at room temperature. You have to be very careful that you have a stable piece of equipment and that the cold junction is working correctly.
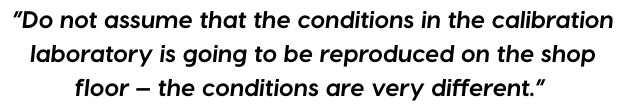
It’s important to read the user manual because there’s often a very critical step to make sure that you are either calibrating the equipment in a real-life environment where the temperature change may be, or ensuring sure that your system has got cold junction compensation. Otherwise, what you believe is a true measurement and accurate, may be the calibration laboratory accuracy where the temperature is controlled very, very strictly. In a real life situation, you may not be seeing exactly the same results.
Heather Falcone: It is really important to consider because there are specific accuracy considerations for AMS2750 and CQI-9.
Steve Offley: I often make an analogy to racing. The Formula One racing cars are tuned up to perform highly on a racetrack environment. They can do 200 miles an hour, having been finely tuned, and they work well. If you take that same racing car off the road into the countryside, it is not going to be working quite as effectively.
The same can be said for data logger technology. A data logger that works well in a calibration laboratory and under fairly safe conditions may or may not be working as effectively on the shop floor, particularly when you consider the variation and the challenges that that environment will bring to a measuring system like this.
Linear Interpolation Correction Factor Method (27:22)
Heather Falcone: Can you explain how you use the linear interpolation correction factor method, because that’s one of the only that is allowed by AMS2750, and why it is beneficial to your data quality?
Steve Offley: We discussed the nominal requirements for the data log accuracy for its measurement, but for AMS2750, logger correction factors and also thermocouple correction factors can be applied to the test data that you are collecting with your monitoring system.
Firstly, for the data logger, we can create a data logger correction factor file, which basically shows the correction factors that need to be applied to each of the separate channels of the data logger for the data that you are collecting. Inside the data logger, we store the calibration information that was gleaned in the calibration laboratory. That can then generate an automatic calibration template, which can be automatically applied to each one of the channels on the data logger automatically as part of the test routine.
The last thing we want to do is to make some error by transferring raw data manually from a spreadsheet into a piece of software. So, the nice thing about that is that it’s automatically applying the pre-programmed offsets from the calibration routine in the laboratory itself.
Secondly, with the thermocouple, we can take a calibrated thermocouple where there will be a nominal reading at two ends of the thermocouple, and you then get the average correction factor. In some circumstances, people will apply a thermocouple correction factor of one nominal temperature below the test level that they are applying. At Phoenix, we calibrate the thermocouples across the complete temperature range of the data logger. Then, we apply what we call the linear interpretation method. What that means is that between each calibration point, we can calculate, using a linear regression line, the true correction factor at any temperature over the measurement range of the device itself.
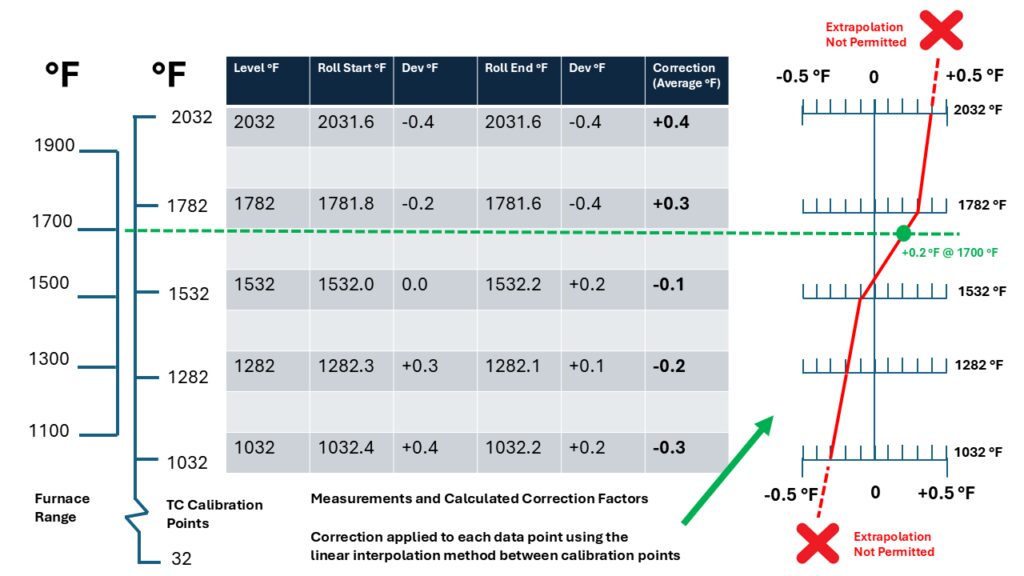
The linear interpolation schematic showing thermocouple correction factors across the full calibration range | Image credit: PhoenixTM, taken from Achieving Accurate Measurements in Real Heat Treat Production in the March print edition of Heat TreatToday.
It cannot go beyond the bounds of the upper and lower limit, as extrapolation is not allowed as it says in the standard. But within the upper and lower bounds, we can interpolate linearly between each data point. There is a tight 140° between each point that we can then ensure that we are correcting for or playing the correct correction factor at each temperature from start to finish, not a nominal value over the whole range. In our view, that gives a far more accurate interpretation of the corrected data over the complete working range of the system as opposed to a single nominal value.
Final Thoughts (31:09)
Heather Falcone: We have talked about a variety of topics: thru-processing monitoring, thermal protection at the data logger, the benefits of making sure that you apply cold junction correction, and the specific accuracy considerations that we have to make sure we bundle in all together. What is the big takeaway you want to leave us with?
Steve Offley: Be careful you do not assume that the condition of operation in the calibration of laboratory is going to be reproduced on the shop floor because the conditions are very different. This comes back to the argument for the importance of cold junction compensation. If you are using technology or a data logger, check with the manual for what cold junction compensation should be applied and if there are any steps you need to make to ensure that that is applied correctly on the shop floor. If you do not, there is a high risk that what you think is accurate data may or may not be if you have a situation where your data logger temperature is varying with time, either in process or even on the shop floor with changing environmental conditions.
Heather Falcone: In the end, we want to make sure that we’re making good parts, and this sounds like a great system to make sure that you’re getting as accurate as possible.
Steve Offley: Quality data at the end of the day is essential for you to understand what your process is doing. It’s no good relying on data you cannot trust. Take that extra time to investigate and put steps in place to make sure that you are measuring what you think you are measuring at the hot junction and that the cold junction is being considered as part of that measurement process.
About the Guest
Dr. Steve Offley Product Marketing Manager PhoenixTM Ltd.
Dr. Steve Offley, aka “Dr.O” is a product marketing manager with PhoenixTM Ltd. with 30 years of experience of temperature monitoring in the industrial thermal processing market.
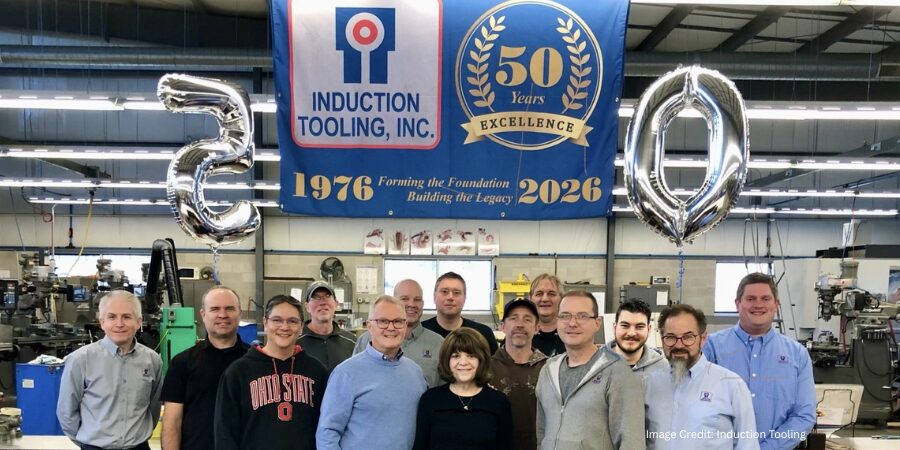
In 1976, what began as a small operation in a 400-square-foot garage grew into one of the most respected names in induction tooling. Today, Induction Tooling, Inc. (ITI), headquartered in North Royalton, Ohio, celebrates 50 years of designing and manufacturing specialized tooling that helps in-house and commercial heat treaters solve complex induction heating challenges across a range of industries, including automotive, aerospace, agriculture, medical, and mining.
Founded by William “Bill” Stuehr, the company was born from a simple observation. While working as a process design engineer at a heat treating company in the mid-1970s, Bill saw clients asking for induction heating that required specialized tooling.
Recognizing the opportunity, he set out on his own. By April 1976, he had delivered his first custom-designed tooling, marking the beginning of a business that would steadily expand over the decades.
Growth came quickly. The company expanded from his home garage to a few different facilities over the decades. In 2005, they finally settled into a 30,000-square-foot facility where they currently house their engineering, manufacturing, and laboratory testing capabilities.
Engineering Solutions for Induction Heat Treating
Induction hardening requires precision, and Induction Tooling has built its expertise around delivering that precision consistently. The company specializes in selective hardening quick-change inductors and related tooling, such as bus bars, adapters, and fixtures used in induction heat treating systems.
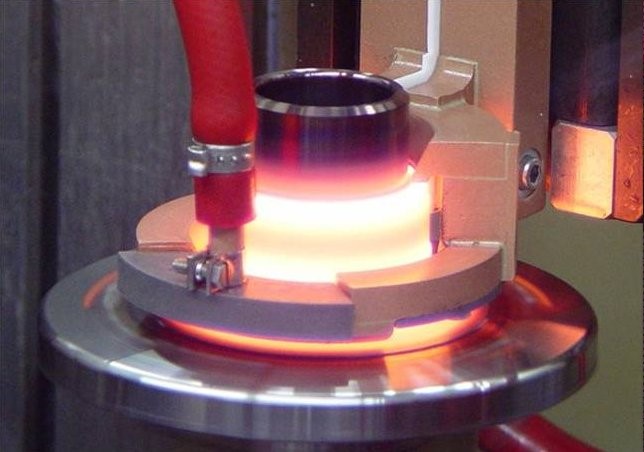
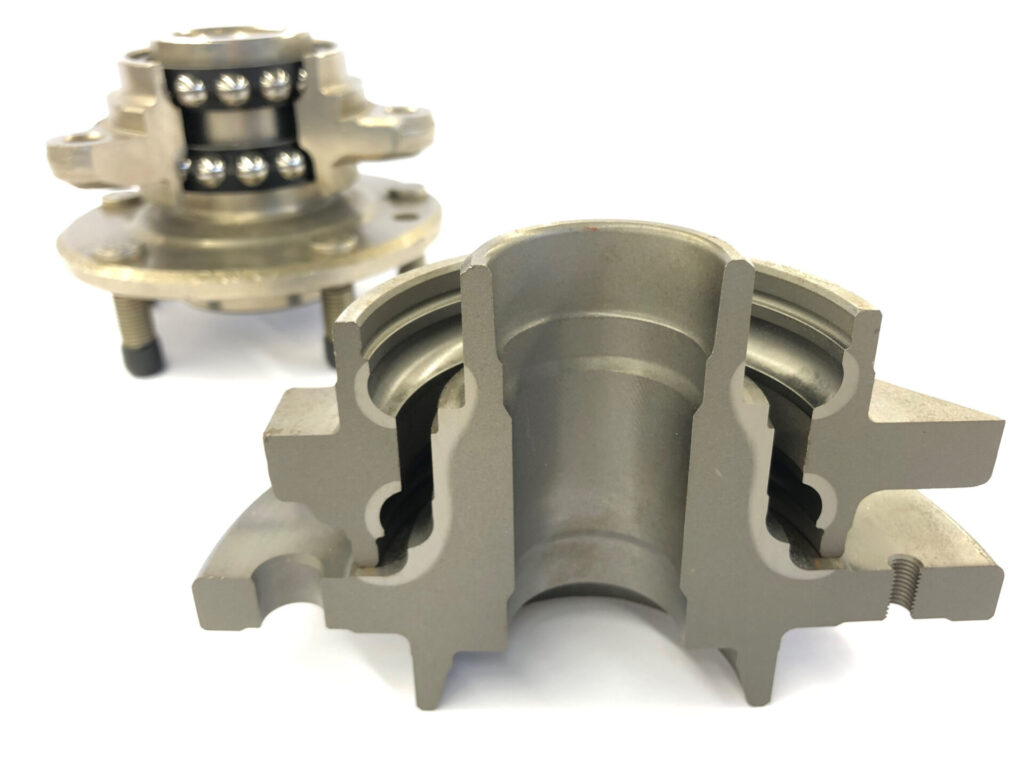
Wheel spindle heating in the laboratory | Image Credit: Induction ToolingWheel hub and spindle, etched pattern | Image Credit: Induction Tooling
By combining advanced design tools with decades of practical experience, the team develops custom solutions tailored to each client’s application. From hardening gears to heating complex shaft and hub components, the team’s engineers work closely with heat treaters to ensure performance, repeatability, and reliability in demanding manufacturing environments. Bringing that stewardship to records, all induction tooling designs have been meticulously maintained since the company’s inception; if ever that custom solution needed to be consulted, the team can and has immediate access to it.
Central to its capabilities is a comprehensive development process that moves from design, machining, and assembly to laboratory testing and metallurgical evaluation. This integrated approach allows the team to test and refine tooling and process parameters before implementation, helping improve quality and meet development timelines. The metallurgical lab also provides a key training experience, allowing designers, engineers, and production workers to see and test the result of their innovation and labor in real-time.
Wheel spindle being selectively hardened and quenched in Induction Tooling’s 3,000 sq ft testing and development laboratory.
A Culture Built on Teambuilding
While innovation plays a major role in their success, the company emphasizes the people behind the work more than anything. Skilled machinists and engineers with decades of experience collaborate across design, machining, and assembly to produce tooling that meets client specifications. This emphasis on teamwork and continual improvement is reflected in the company’s philosophy, which encourages learning, cooperation, and accountability throughout the organization.
The Next 50 Years
As Induction Tooling marks its 50th anniversary, the company continues to pursue the same mission that sparked its founding: inventing and engineering unique tooling solutions that improve induction heat treating processes. Recognizing the integration of automation happening within the industry, the team continues to research ways to further integrate robotics and automation into their processes, including experimenting with additive manufacturing.
For this company, the milestone is not just a look back at half a century of growth; it’s a reminder that innovation often begins with a simple idea and the determination to build something better.
Main image shows Induction Tooling, Inc. celebrating 50 years of innovation and design. If you have any comments or queries on this article, let us know at editor@heattreattoday.com.
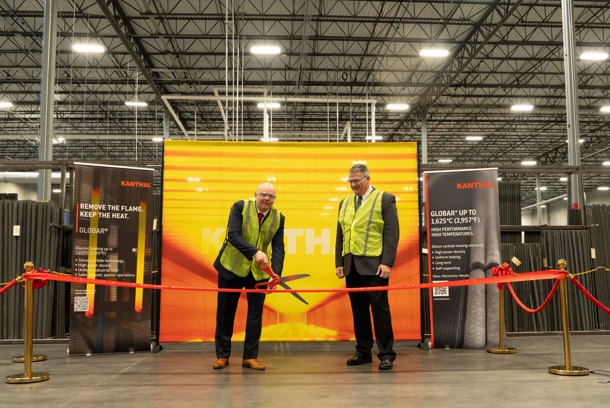
A new service center in Concord, North Carolina, is now fully operational. Kanthal, an Alleima company, added U.S.-based production and service capabilities for silicon carbide (SiC) heating elements used in high-temperature applications across industries such as electronics, glass, and steel manufacturing.
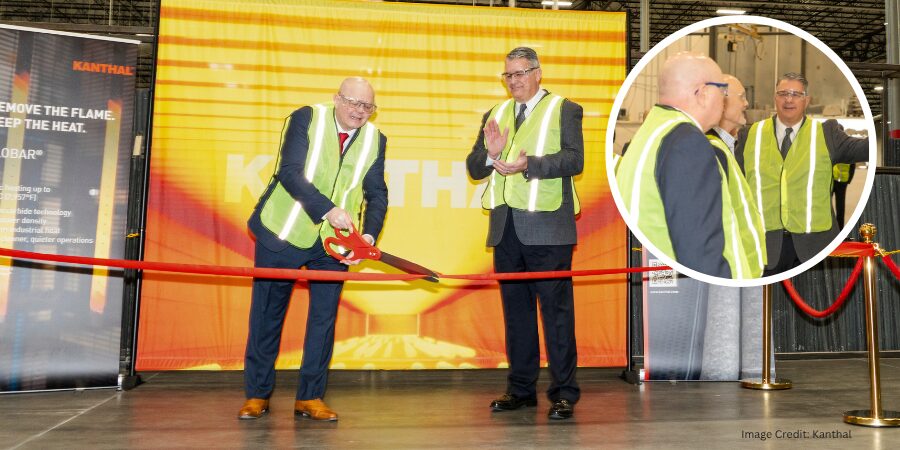
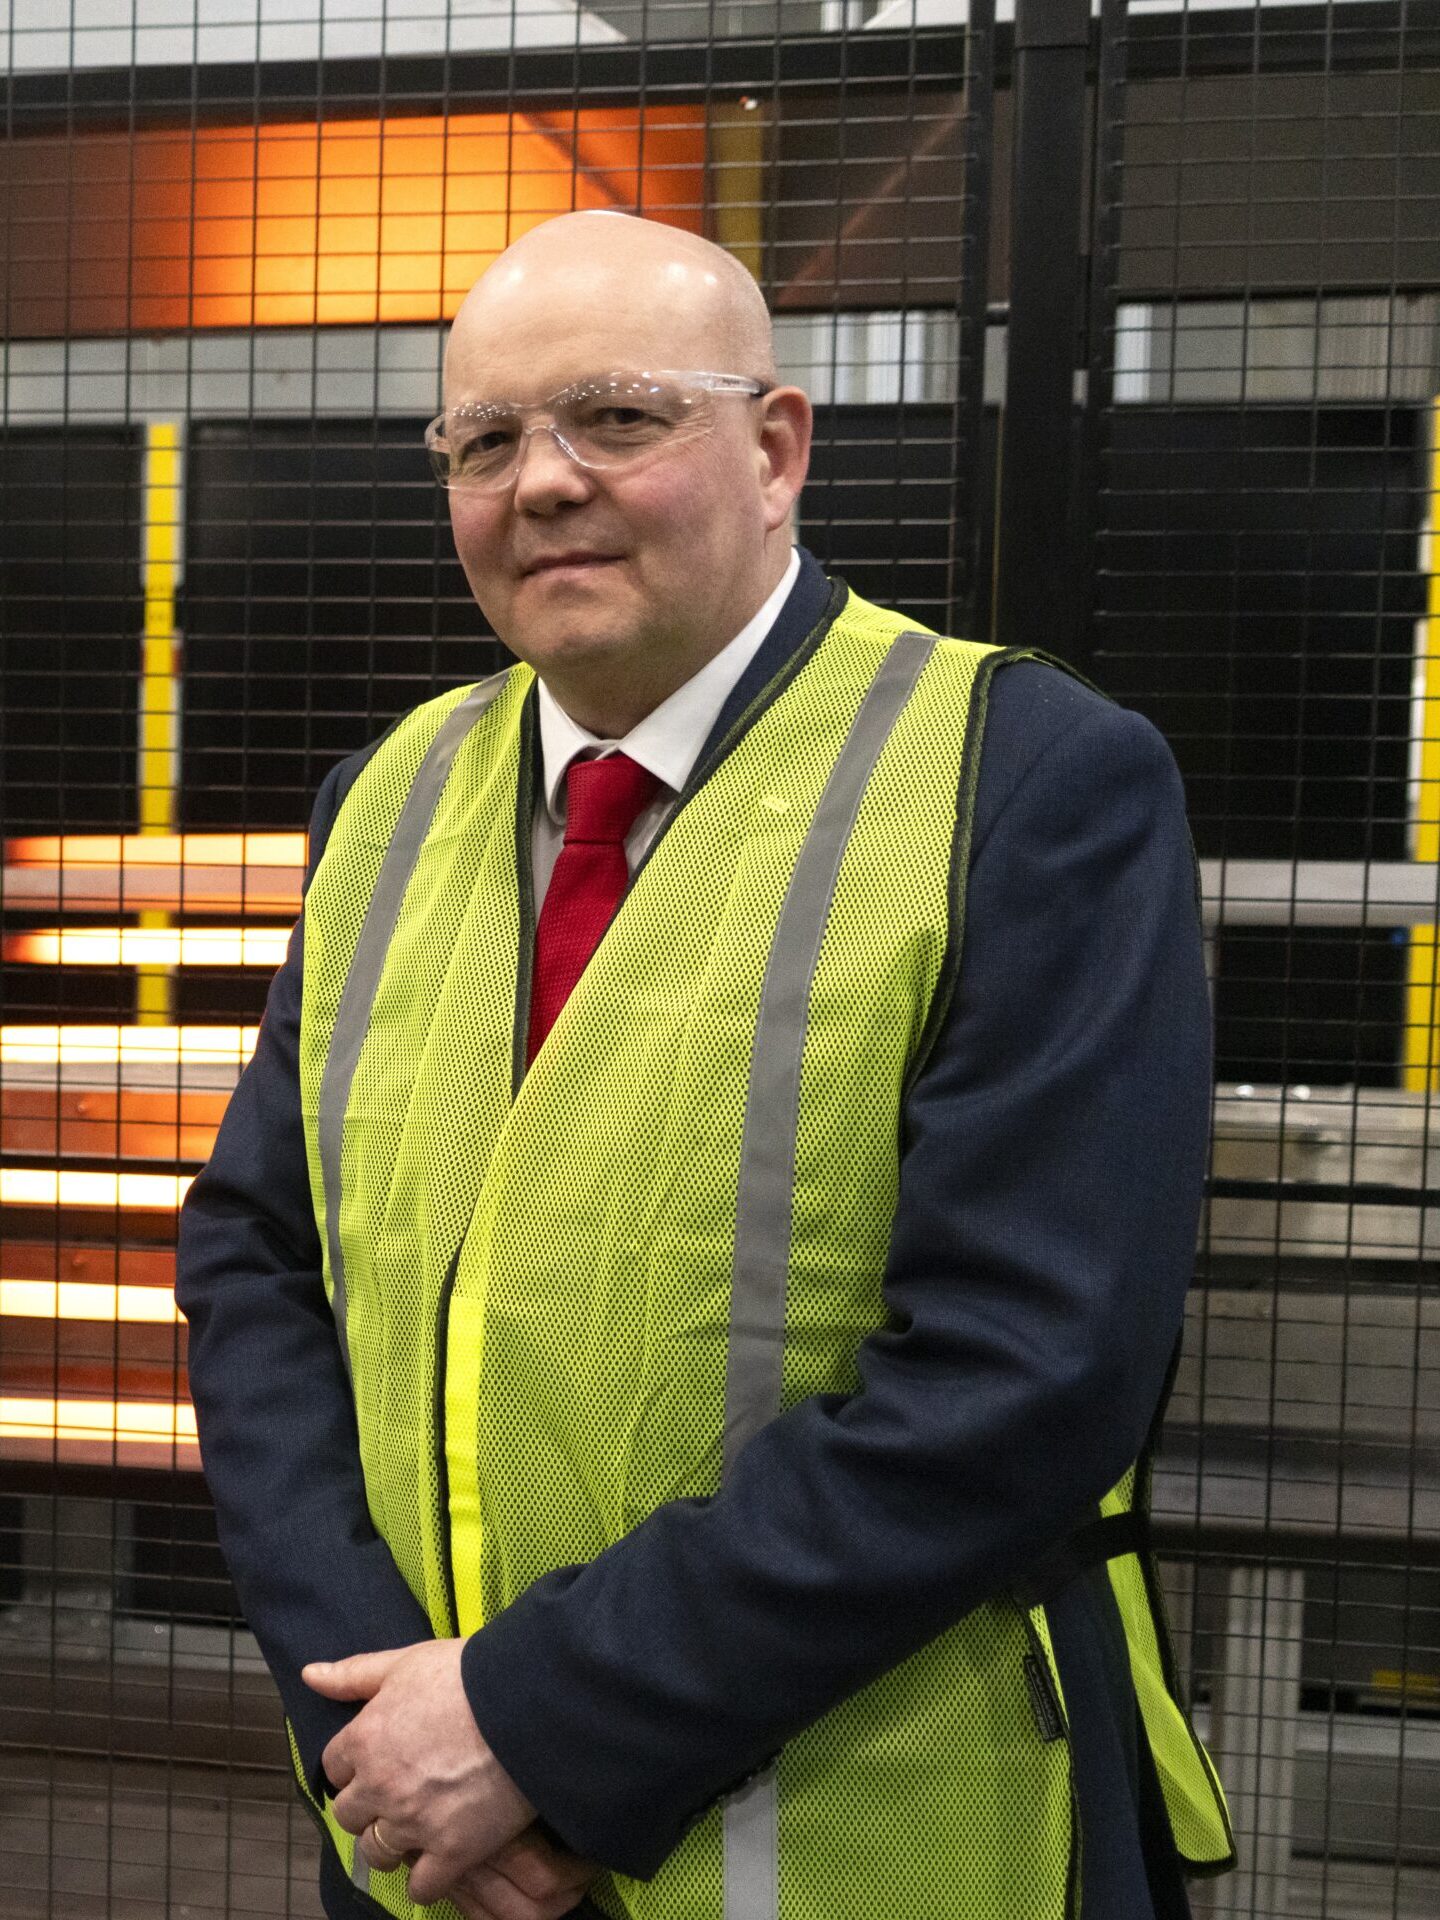
Kanthal leadership celebrating the official inauguration of its new service center located in Concord, North Carolina | Image Credit: KanthalSimon Lile President, Business Unit Heating Systems Kanthal
“This is not just a new service center. We have implemented improvements in Concord that allow us to adapt product configurations based on customer furnace setups and order cycles. The result is a more responsive operation, faster to quote, faster to ship, and better aligned with U.S. [client] needs,” says Simon Lile, president of Business Unit Heating Systems at Kanthal.
Heat TreatToday publisher Doug Glenn attended the ribbon-cutting and open house event to better understand how electrification is shaping high-temperature thermal processing. During the event, attendees toured the Concord facility and discussed how electric heating technologies are being evaluated as alternatives to traditional fuel-based systems. Conversations reflected growing interest in approaches that support improved process control and reduced emissions in industrial applications. “This kind of investment signals a broader shift in how manufacturers are approaching high-temperature processing,” Glenn said. “It’s not just about replacing a heat source — it’s about rethinking how these systems operate in the long term.”
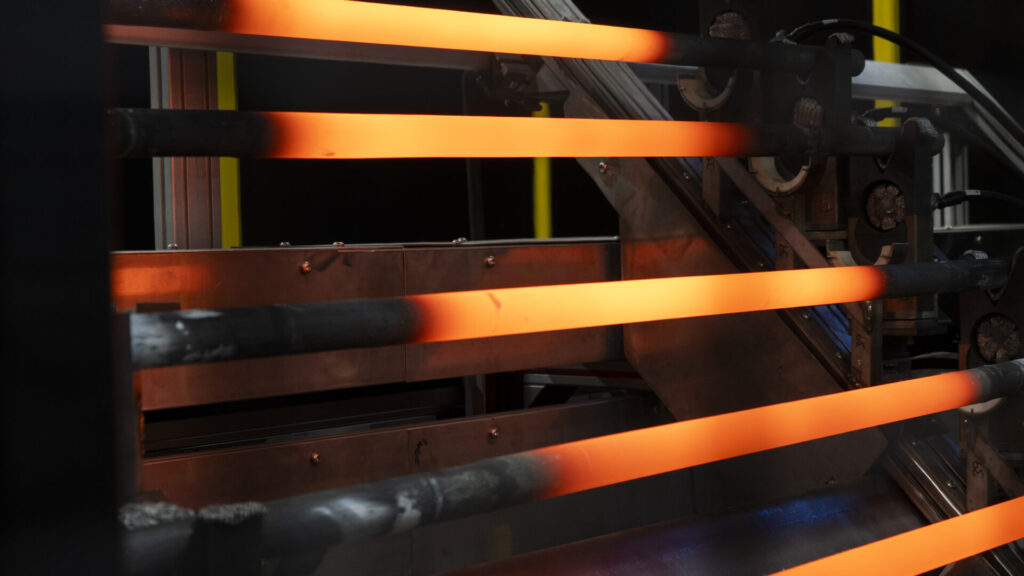
The site includes expanded capacity for Globar® silicon carbide heating elements, which enable electrification of heating processes up to 2950°F and offer an alternative to fossil fuel-based systems. These heating elements can support improved energy efficiency, cleaner operations, and enhanced process control while contributing to reduced CO2 emissions.
Globar® silicon carbide (SiC) heating elements | Image Credit: Kanthal
The Concord service center is part of an approximately $11 million investment that also includes updates to the company’s production site in Perth, Scotland. Together, these developments are expected to increase production capacity by about 40%, while improving lead times and service for clients in the U.S. market.
In 2022, operations from multiple locations were consolidated into the Concord facility, creating a centralized manufacturing and distribution center. The latest investment builds on that foundation to support current client demand.
Press release is available in its original form here. Main image shows the ribbon-cutting ceremony, along with a photo inset of Heat TreatToday Publisher Doug Glenn with President of Business Unit Heating Systems for Kanthal Simon Lile and Production Unit Manager for Kanthal Bruce Dionne.
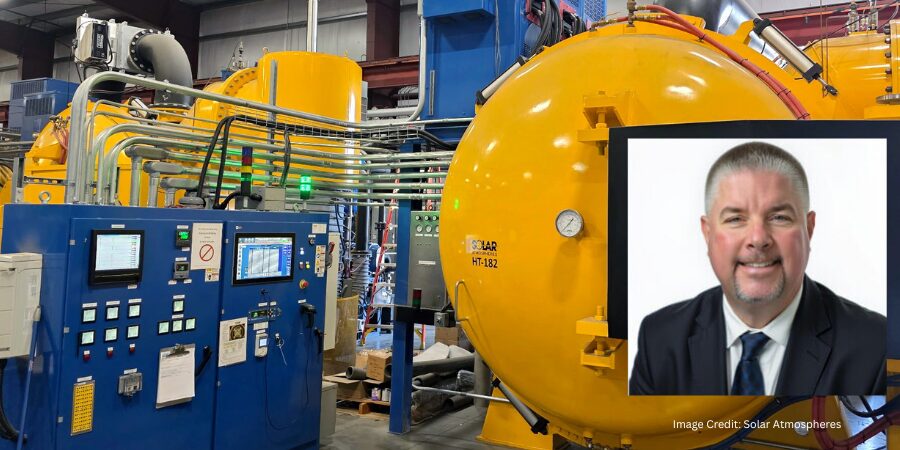
Solar Atmospheres has announced the installation and full commissioning of a new 10-bar vacuum furnace at its Fontana, California, further expanding the company’s high-pressure vacuum heat treating capacity in the western United States. The system enables vacuum heat treating and high-pressure quenching of large components essential to high-performance applications across aerospace and other critical industries.
The furnace, manufactured by sister company Solar Manufacturing, is a horizontal vacuum system with a 48″ wide x 48″ high x 96″ deep hot zone and a maximum load capacity of 12,000 pounds. Equipped with a vacuum pumping package capable of reaching an ultimate vacuum level of 1×10⁻⁶ Torr, the furnace is designed for processing titanium and other high-performance alloys that require tightly controlled, low-contamination environments.
Derek Dennis President Solar Atmospheres California
“This investment gives our [clients] another regional solution for high-pressure quenching of large components and heavy workloads,” said Derek Dennis, president of Solar Atmospheres California. It also allows the company to increase capacity and improve efficiency as demand continues to grow, he adds.
The move supports vacuum heat treating needs across aerospace, defense, medical, and power generation markets, with capacity aimed at maintaining consistent turnaround and performance.
Press release is available in its original form here.
Following tight standards might not mean your heat treat process is truly accurate…if your instrumentation does not see the full picture. In this Technical Tuesday installment, Dr. Steve Offley, product marketing manager with PhoenixTM Ltd., discusses how combining accurate data loggers, high-quality thermocouples, and linear interpolation of correction factors ensures consistent compliance with AMS2750H and delivers trustworthy survey results. The article further explores how thermocouple behavior and real-world processing conditions necessitate carefulattention to each thermocouple junction.
This informative piece was first released in Heat Treat Today’sMarch 2026 Annual Aerospace Heat Treating print edition.
Introduction
In the world of heat treatment, temperature measurement accuracy is critical, whether performing process monitoring or temperature uniformity surveys (TUS) as part of AMS2750. Measurement accuracy is defined as the degree to which the result of a measurement, calculation, or specification conforms to the correct value or standard. Without confidence in the accuracy of your measurement, you are working in the dark and could be deceiving yourself and possibly others.
The requirement of ±0.1°F readability first referenced in the F revision of AMS2750 pyrometry standard has garnered much debate and critical discussions throughout the years. Although helpful in resolving confusion in what option to record and removing discrepancies in recording temperatures in metric versus Imperial units, this solution does not necessarily guarantee instrumentation accuracy working in a real-world heat treat operation settings.
The following article introduces important considerations to be made when performing the temperature monitoring operation with reference to measurement accuracy in a real-world test environment — on a shop floor, not just a stable controlled calibration laboratory.
Monitoring & TUS Methodology
Traditionally, TUS are performed using a field test instrument, which in most situations will be a temperature data logger. For static batch ovens, a static data logger is positioned externally to the furnace. Long thermocouples are trailed into the furnace heating chamber connected directly to the TUS frame.
Figure 1. Typical TUS setup for a static batch furnace. Twenty channel external data loggers connected directly to a nine-point TUS frame used to measure the temperature uniformity over the volumetric working volume of the furnace. | Image Credit: PhoenixTMFigure 2. Thru-process TUS monitoring system. The data logger shown is located inside the thermal barrier, which travels with the TUS frame through the furnace. | Image Credit: PhoenixTM
For continuous or semi-continuous modular processes, this trailing thermocouple method is difficult if not impossible. For these furnaces, the preferred method of temperature monitoring is “thru-process”: the data logger is connected to a TUS frame, traveling with the load through the furnace. To protect the data logger from the hostile process conditions (including heat, pressure, steam, water, salt, or oil) the data logger is encased in a thermal barrier designed for the process in hand (Figure 2).
Calibration Accuracy Requirements
In either static or continuous processing conditions, the accuracy of the temperature monitoring system is dependent upon the combined accuracy of the field test instrument (data logger) and the temperature sensor thermocouples.
Both aspects of the monitoring system must be strictly controlled for AMS2750H compliance. The field test instrument data logger needs to have a calibration accuracy of ±1.0°F or ±0.1% of temperature reading, whichever is greater (Table 7 in AMS2750H), and a readability of ±0.1°F. The most common base metal thermocouples (K and N) used will themselves need to have a calibration accuracy of ±2.0°F or ±0.4% (percent of reading or correction factor °F, whichever is greater) as defined in Table 1 of the AMS2750H specification.
Field Measurement Accuracy
For process monitoring, thermocouples are generally the preferred temperature sensor when considering accuracy, robust operation, cost, and availability. It is important to fully understand the working limitations of the sensor technology from measurement accuracy attainable on the heat treat shop floor to ensure they are compensated for.
The theory of the thermocouple is traced back to a German Physicist, Thomas Seebeck in 1821. The “Seebeck effect” describes the generation of electrical voltage when a temperature difference exists between two dissimilar electrical conductors (metals). The resulting milivoltage (mV) is defined by actual temperature experienced at the measurement junction. For any given thermocouple, the measured mV can be converted to a temperature using standardized Seebeck voltage curves, commonly documented in thermocouple reference tables.
Figure 3. Basic thermocouple measurement circuit showing critical hot and cold junctions. Image Credit: PhoenixTM
Using the Seebeck principle, the thermocouple consists of two wires of dissimilar metals joined at the measurement point, known as the hot junction. The output voltage from the sensor is proportional to the temperature difference between the hot junction and the point of voltage measurement, known as the cold junction. It is important to recognize that a thermocouple measures temperature difference, not an absolute temperature. The basic principle of how a thermocouple measurement circuit operates is shown in Figure 3.
Critical Cold Junction Measurement
A common misconception is that thermocouple accuracy only needs to be accounted for at the hot junction. As previously mentioned, the thermocouple measurement is reliant on the temperature reading at the hot junction offset against the temperature of the cold junction. From an electronics level, the cold junction is where the thermocouple wires connect to the copper/copper connection on the electronic circuit. The cold junction therefore may be inside the data logger or on the outside of the data logger, if universal thermocouple connectors are used (Cu sockets).
Therefore, to get a consistent accurate reading from the hot junction, it is important to consistently and accurately monitor the cold junction temperature so the measurement can be corrected using a method known as “cold junction compensation.” It is critical that the cold junction temperature sensor is located correctly to ensure that the true cold junction temperature is measured and applied.
Essential Accuracy in Real World
While the accuracy of many data loggers may appear to be acceptable on paper, this may not reflect the real world situation. Data logger temperature may not be stable, which can compromise temperature accuracy when proper cold junction compensation is not implemented. The calibration accuracy in a stable temperature-controlled laboratory, or while performing an in-situ calibration, is one thing, but is the field test instrument able to work accurately on the production floor with significant swings in temperature over the survey period? Do you know what temperature changes the data logger may be experiencing on your process floor (e.g., climatic variation during day/furnace heat up, loading and unloading actions)?
Remember, only a few degree change in the cold junction temperature may compromise the measurement accuracy enough to fail the TUS level being tested, if no compensation is undertaken or if the compensation temperature used does not accurately reflect the live cold junction temperature.
Cold Junction Compensation Logger Data
Data loggers designed with an essential accurate cold junction compensation technology, like those created by PhoenixTM, maintain measurement accuracy in every changing industrial environments. This design allows the data logger accuracy to be quoted at ±0.5°F (K and N) over the full operating temperature range of the PhoenixTM data logger family. For standard data loggers used in conventional thermal barriers (phase change heat sink), the accuracy is maintained over the operating range of 32°F to 176°F. For high temperature data loggers used in phased evaporation thermal barriers (water tank protection), the accuracy is provided over the operating range of 32°F to 230°F. As designed, the data logger will operate at 212°F (boiling water), so cold junction compensation is critical with the data logger ambient temperature changing from 70°F to 212°F during normal operation.
Take for example an external data logger with cold compensation technology with an operating temperature range of 32°F to 131°F (see PTM4220 in Figure 1). On a production floor, users can safely operate, relying on the cold junction compensation to address temperature fluctuations in the processing environment.
Figure 4. Effect of changing physical data logger temperature on the thermocouple measurement with and without cold junction compensation measure a stable process temperature of 1470°F. Image Credit: PhoenixTM
Additionally, the thermocouple socket in the data logger case is connected directly to the measurement board of the data logger using thermocouple wire of the designated type (e.g., type K). A thermistor temperature sensor accurately monitors the connector temperature (±0.18°F) providing an accurate record of the cold junction. The connector is located inside the data logger cavity, protected from rapid environmental temperature changes, and is compact and isothermal. As such, the thermistor temperature accurately reflects the cold junction of each unique thermocouple connection. This temperature provides an accurate cold junction temperature compensation to maintain measurement accuracy with any internal data logger temperature variation (Figure 4).
Thermocouple Accuracy
Figure 5. Nonexpendable mineral insulated thermocouple type K (0.06 inch) or N (0.08 inch). UHT alloy sheathed insulated hot junction, terminating in miniature plug. Maximum temperature 2192°F ANSI MC96.1 Special Limits (±2.0 °F or ± 0.4%, whichever is highest). Image Credit: PhoenixTM
To maximize measurement accuracy, it is important that thermocouples are selected with the highest accuracy and manufactured to resist damage from thermal cycling at elevated temperatures.
For thru-process monitoring, short thermocouple lengths are required to connect the data logger within the thermal barrier and the TUS frame. As such, nonexpendable (see AMS2750H 2.2.36, Table 3) thermocouples can be employed with ease. Robust mineral insulated thermocouples (MIMS) (Figure 5), typically type K or N, can be permanently fixed to the TUS frame. This both reduces setup time and guarantees that thermocouple positions are consistent for periodic TUS work as defined (see AMS2750H 3.1.7, Table 5).
Barring physical damage, the mineral insulated thermocouples can be used unrestricted for up to three months (type K) and three months or longer (type N) if recalibration is successful at the three-month check.
Data Logger and Thermocouple Correction Factors
The PhoenixTM system allows both data logger and thermocouple correction factors to be applied automatically to the raw survey temperature data, maximizing measurement accuracy. The data logger correction factors can be read directly from the onboard digital data logger calibration file. Thermocouples are available with comprehensive calibration certificates providing corrections factors at multiple set temperatures across the required measurement range.
Figure 6. Schematic of the linear interpolation method (AMS2750 accepted) of calculating thermocouple correction factors over the entire calibration range of the thermocouple. Every TUS measurement in therefore corrected accurately against matching calibration offset data. Image Credit: PhoenixTM
For both data logger and thermocouples, correction factors are interpolated across the complete calibration range using the linear method as permitted by AMS2750H 3.1.4.8 (Figure 6). This approach means that the accuracy of the entire TUS dataset is guaranteed compared to applying a single correction factor calculated at a single nominated temperature, which may not truly reflect the complete temperature range.
Summary
To guarantee the accuracy of both temperature profile and TUS data, it is important that the field test instrument data logger not only provides the desired calibration accuracy but is able to work accurately in a production environment. For thermocouple systems, accurate cold junction compensation offers critical peace of mind to correct for changes in the operating temperature characteristics of the data logger during use.
Data logger and thermocouple correction factors should be implemented to maximize measurement accuracy. As discussed, the use of linear interpolation method ensures that correction factors calculated over the entire measurement range are implemented providing full data accuracy.
About The Author:
Dr. Steve Offley Product Marketing Manager PhoenixTM Ltd.
Dr. Steve Offley, “aka Dr O” is a product marketing manager with PhoenixTM Ltd. with 30 years of experience of temperature monitoring in the industrial thermal processing market.
Carbon emissions reporting is no longer optional for heat treaters — it’s becoming a competitive and regulatory necessity. In this Sustainability Insights installment, Heat TreatToday examines research from Professor Fu Zhao and PhD candidate Lakshmi Srinivasan of Purdue University’s Heat Treating Consortium, detailing a new python-based carbon calculator built specifically for heat treat operations, how it models Scope 1, 2, and 3 emissions from furnace geometry and process parameters, and how in-house heat treaters can use it to meet growing transparency demands with minimal manual effort.
This informative piece was first released in Heat Treat Today’sFebruary 2026 Annual Air & Atmosphere Heat Treating print edition.
Emissions reporting has become an essential step. Navigating the requirements in an influx political environment only adds to the challenge. How can heat treaters remain in compliance? A tool designed through Purdue University’s Heat Treating Consortium (PHTC) may be the answer.
The consortium has funded research across heat treat projects ranging from the efficacy of novel quenchants to improving materials hardness. Roughly two years ago, the PHTC member companies requested research to develop a tool that would make carbon estimation possible.
Lakshmi Srinivasan, PhD Candidate in the School of Mechanical Engineering at Purdue UniversityProfessor Fu Zhao, Faculty Member at the School of Mechanical Engineering and the School of Sustainability Engineering and Environmental Engineering at Purdue University
Professor Fu Zhao, faculty member at the School of Mechanical Engineering and the School of Sustainability Engineering and Environmental Engineering at Purdue, decided to take on this research request. He brought on PhD candidate Lakshmi Srinivasan, an astute researcher of energy systems modeling and life cycle assessment in the School of Mechanical Engineering, to research and develop the tool. “This project aims to model furnace energy requirements based on furnace geometry and heat treating input parameters,” Srinivasan explained. “From these modeling energy flows and furnace build inputs, we calculate Scope 1, Scope 2 and Scope 3 carbon emission associated with operating the furnace.”
Scope 1: Direct carbon emissions from energy consumption within the plan (e.g. combustion of natural gas or other fuels)
Scope 2: Indirect emissions from purchased electricity, steam, heat, or cooling
Scope 3: All other indirect emissions across the supply chain (e.g., suppliers, transportation, product use)
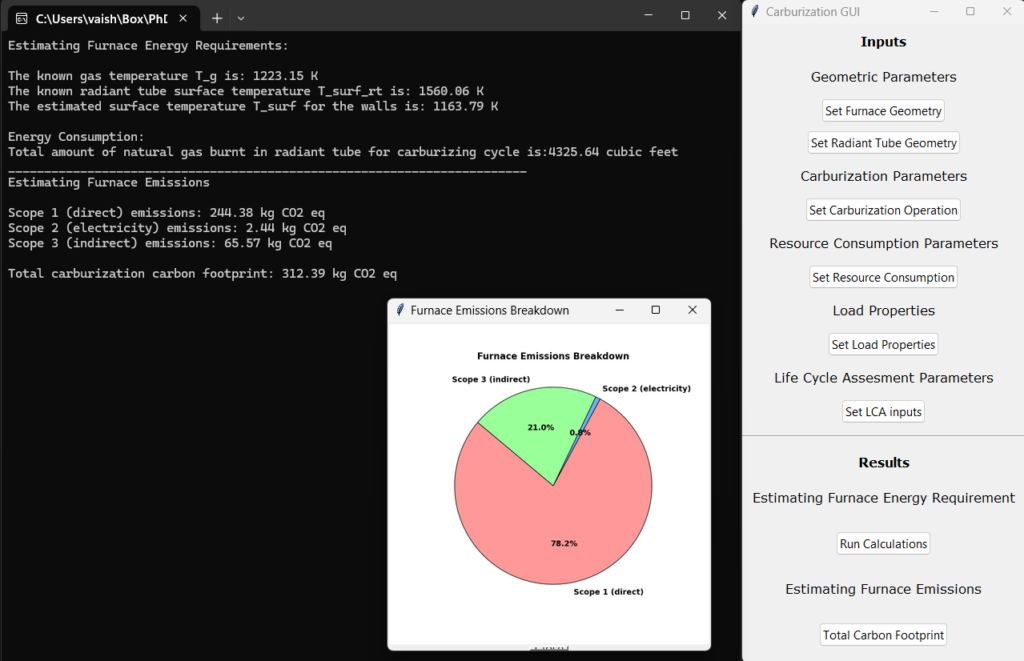
The tool is a python-based desktop application with scalability in mind. Since development targets the carburizing process for both market and regulatory reasons, it is highly focused on industry needs. Additionally, Zhao and Srinivasan built the tool for users to integrate additional features and data sets to align with new requirements or emerging technologies. They also underscored that the tool’s architecture is designed for growth as a web-based application.
Image of the digital carburization tracking tool | Image Credit: Srinivasan and Zhao
Ease of use is central. Zhao and Srinivasan have refined the tool to limit how much unique user input is required to generate an accurate output. The team explained this as particularly challenging, having examined alternatives to simplify the interface without oversimplify the “underlying physics.” They described how the final form of the tool will work, saying that once key parameters are entered (furnace type, processing temperatures, time, part geometry), the tool will automatically calculate energy usage and emissions with minimal manual intervention.
PHTC members, many of whom represent manufacturers with in-house heat treating, have shown great interest, providing feedback and resources to shape the development of the tool. Additional enthusiasm was found at IHEA’s annual SUMMIT in August 2025, where Srinivasan presented the tool’s development. When asked what inquiries have directed their research, Zhao and Srinivasan shared the following:
Versatility and functionality: How flexible is the tool in accommodating different furnace geometries, part geometries, furnace types, and heat treatment processes?
Part-based allocation: How does the tool allocate emissions accurately to individual parts or batches within a furnace load?
Location-specific emissions: How does it account for location-based variations in scope 2 and scope 3 emissions, such as differences in electricity generation or supply chain impacts?
Another challenge has been ensuring careful tool calibration and verification. To do so, the team has taken accurate, real-world natural gas and electricity consumption from heat treat operations, courtesy of PHTC members, to verify the model’s predicted energy consumption at defined furnace operating temperatures.
Eventually, some form of this tool will be made available to those outside the consortium. Currently, however, PHTC members are at the forefront of development and usage. The researchers underlined this, commenting, “This tool is particularly timely and essential for industry, as companies are increasingly expected to provide transparent and accurate emissions reporting.”
While the world of standards and regulations can feel like a minefield, benchmarked discussions of this tool reveal promising applications for in-house heat treaters in the near future.
El reporte de emisiones de carbono ya no es opcional para los especialistas en tratamiento térmico — se está convirtiendo en una necesidad competitiva y regulatoria. En esta entrega de Perspectivas de Sostenibilidad, Heat TreatToday examina la investigación del Profesor Fu Zhao y la candidata a Doctorado Lakshmi Srinivasan del Heat Treating Consortium de Purdue University, detallando una nueva calculadora de carbono basada en Python, desarrollada específicamente para operaciones de tratamiento térmico, cómo modela las emisiones del Alcance 1, 2 y 3 a partir de la geometría del horno y los parámetros del proceso, y cómo los especialistas en tratamiento térmico con operaciones internas pueden utilizarla para cumplir con las crecientes exigencias de transparencia con un mínimo de intervención manual.
Este artículo informativo se publicó por primera vez enHeat Treat Today’sFebruary 2026 Annual Air & Atmosphere Heat Treating print edition.
Si tiene comentarios o preguntas sobre este artículo, háganoslo saber en: editor@heattreattoday.com.
El reporte de emisiones se ha convertido en un paso esencial. Navegar los requisitos en un entorno político cambiante solo añade complejidad al desafío. ¿Cómo pueden los especialistas en Tratamiento Térmico mantenerse en el cumplimiento normativo? Una herramienta diseñada a través de Purdue University’s Heat Treating Consortium (PHTC, por sus siglas en inglés) podría ser la respuesta.
El consorcio ha financiado investigaciones en proyectos de tratamiento térmico que abarcan desde la eficacia de nuevos medios de temple hasta la mejora de dureza de los materiales. Hace aproximadamente dos años, las empresas miembros del PHTC solicitaron una investigación para el desarrollo de una herramienta que hiciera posible la estimación de carbono.
Lakshmi Srinivasan, Candidata a Doctorado en School of Mechanical Engineering at Purdue UniversityProfessor Fu Zhao, Miembro del Profesorado de School of Mechanical Engineering and the School of Sustainability Engineering and Environmental Engineering at Purdue University
El Profesor Fu Zhao, miembro del profesorado de School of Mechanical Engineering and the School of Sustainability Engineering and Environmental Engineering at Purdue decidió asumir esta solicitud de investigación. Incorporando a la candidata a Doctorado Lakshmi Srinivasan, una destacada investigadora en el modelado de sistemas energéticos y evaluación del ciclo de vida en School of Mechanical Engineering y la School of Sustainability Engineering and Environmental, para la investigación y desarrollo de esta herramienta. “Este proyecto tiene como objetivo modelar los requerimientos energéticos del horno en función de su geometría y los parámetros de entrada de tratamiento térmico”, explicó Srinivasan. “A partir de estos flujos energéticos modelados y de los insumos asociados a la construcción del horno, calculamos las emisiones de carbono del Alcance 1, Alcance 2 y Alcance 3 asociados a la operación del horno”.
Alcance 1: Emisiones directas de carbono derivadas del consumo de energía dentro de la planta (por ejemplo, combustión de gas natural u otros combustibles)
Alcance 2: Emisiones indirectas provenientes de electricidad, vapor, calor o enfriamiento adquiridos
Alcance 3: Todas las demás emisiones indirectas a lo largo de la cadena de suministro (por ejemplo, proveedores, transporte, uso del producto)
La herramienta es una aplicación de escritorio basada en Python, diseñada pensando en la escalabilidad. Dado que el desarrollo está orientado al proceso de carburizado tanto por razones de mercado como regulatorias, se encuentra altamente enfocada en las necesidades de la industria. Adicionalmente, Zhao y Srinivasan diseñaron la herramienta para que los usuarios puedan integrar características adicionales y conjuntos de datos que se alineen con nuevos requerimientos o tecnologías emergentes. También subrayaron que la arquitectura de la herramienta está pensada para su crecimiento como una aplicación basada en la web.
Imagen de la herramienta digital de seguimiento de carburizado | Image Credit: Srinivasan and Zhao
La facilidad de uso es un aspecto esencial. Zhao y Srinivasan han refinado la herramienta para limitar la cantidad de entradas únicas requeridas por el usuario para generar un resultado preciso. El equipo explicó que este aspecto fue particularmente desafiante, ya que se examinaron alternativas para simplificar la interfaz sin simplificar en exceso la “física subyacente”. Describieron como funcionará la versión final de la herramienta, explicando que una vez que se introduzcan los parámetros clave (tipo de horno, temperaturas de proceso, tiempo, pieza) la herramienta automáticamente calculará la energía usada y las emisiones con una intervención manual mínima.
Los miembros del PHTC, de los cuales muchos representan compañías manufactureras que cuentan con tratamiento térmico interno, han mostrado interés, proporcionando retroalimentación y recursos para dar forma al desarrollo de la herramienta. Un entusiasmo adicional se observó durante el IHEA’s annual SUMMIT en agosto de 2025, donde Srinivasan presentó el desarrollo de la herramienta. Cuando se les preguntó qué interrogantes han guiado su investigación, Zhao y Srinivasan compartieron lo siguiente:
Versatilidad y funcionalidad: ¿Qué tan flexible es la herramienta para adaptarse a diferentes geometrías de horno, geometrías de piezas, tipos de hornos y procesos de tratamiento térmico?
Asignación basada en piezas: ¿Cómo asigna la herramienta las emisiones de manera precisa a piezas individuales o lotes de una carga dentro del horno?
Emisiones específicas por ubicación: ¿Cómo considera las variaciones regionales en las emisiones del Alcance 2 y Alcance 3, tales como las diferencias en la generación de electricidad o los impactos de la cadena de suministro?
Otro desafío ha sido garantizar la calibración y verificación cuidadosa de la herramienta. Para ello el equipo ha utilizado datos reales y precisos de consumo de gas natural y electricidad provenientes de operaciones de tratamiento térmico, cortesía de los miembros del PHTC, con el fin de verificar el consumo energético predicho por el modelo a temperaturas de operación definidas del horno.
Eventualmente alguna versión de esta herramienta estará disponible para usuarios fuera del consorcio. Sin embargo, actualmente, los miembros del PHTC se encuentran a la vanguardia tanto del desarrollo como del uso. Los investigadores enfatizaron este punto: “Esta herramienta es particularmente oportuna y esencial para la industria, ya que las empresas enfrentan una creciente expectativa de proporcionar reportes de emisiones transparentes y precisos”.
Si bien el mundo de las normas y regulaciones puede sentirse como un campo minado, las discusiones comparativas sobre esta herramienta revelan aplicaciones prometedoras a corto plazo para los especialistas en tratamiento térmico con operaciones internas.
We’re celebrating getting to the “fringe” of the weekend with a Heat TreatFringe Fridayinstallment: a private equity firm in the aerospace supply chain has acquired Forged Solutions Group, a manufacturer of high-specification forgings used in flight-critical engine and structural components. The company’s products, including aeroengine discs and shafts, are the kinds of advanced alloy components that typically move through multiple downstream heat treatment steps before entering service.
While not exactly heat treat, “Fringe Friday” deals with interesting developments in one of our key markets: aerospace, automotive, medical, energy, or general manufacturing.
J.F. Lehman & Company has completed the acquisition of Forged Solutions Group, a manufacturer of high-specification closed-die forgings for aerospace, defense, and space applications. The company produces components including aeroengine discs, shafts, and structural parts from advanced alloys such as titanium, nickel-based superalloys, steel and aluminum before moving through machining and materials testing as part of the production process.
Ben Hatcher Managing Director J.F. Lehman & Company
The company supplies components for commercial aerospace and defense platforms through its manufacturing facilities. J.F. Lehman & Company, a private equity firm focused on aerospace, defense, maritime, government, and environmental sectors, completed the acquisition as part of its strategy to invest in companies supporting critical industrial supply chains.
Ben Hatcher, managing director at J.F. Lehman & Company, said, “FSG’s expansive forging capabilities, diverse product portfolio, and meaningful available capacity form a compelling and critical solution to the broader aerospace and defense industry’s production requirements. We are excited to build upon FSG’s differentiated technical capabilities and scaled operational footprint to increase throughput in support of current and next-generation aeroengine and defense platforms.”
Press release is available in its original form here.
Two vacuum induction melting (VIM) casting systems are being deployed to support the production of components used in power generation turbine manufacturing. The systems are designed to produce advanced alloys with controlled microstructures for components operating under demanding thermal and mechanical conditions.
The equipment, engineered to support both equiaxed (EQ) and directionally solidified (DS) casting processes, will be used in the production of high-performance, nickel-based alloy turbine components. These casting technologies are critical for achieving the structural integrity, thermal resistance, and performance consistency required in modern power generation turbines operating under extreme conditions.
Earl Good President Retech
Retech, a U.S.-based company and part of the SECO/WARWICK Group, supplied the two VIM systems. “These systems were designed to build on prior installations while incorporating specific changes requested by the [client] to support their current and future production goals,” said Earl Good, president of Retech. The systems are based on Retech’s core designs but incorporate client-specific modifications, tailoring feeder configurations to align with the client’s established production practices. This enables repeatable casting while maintaining precise thermal and atmospheric control throughout the process.
The order continues a relationship between Retech and the client that dates back to the 1980s, with several legacy systems still in operation at the facility. The client has indicated plans to expand capacity in the coming years, including potential additional system purchases and replacement of older equipment.
Press release is available in its original form here.