In this Technical Tuesday installment, Jim Roberts of U.S. Ignition entertains readers in a Combustion Corner editorial about how fuel sources became more affordable over time and aspects of combustion burner design. Stick around for his side story on the “innovative” use of bedposts.
This editorial was first released inHeat Treat Today’sOctober 2025 Ferrous/Nonferrous print edition.
A furnace guy walks into a heat treat facility and sees burners everywhere. Furnace guy says to the faces in the room, “Why did you pick those types of burners?” Thinking this is a trick question, the heat treaters respond, cautiously, “To make things hot?” Of course, they are correct, because making fire and heat is the name of the game, right?
But as we have considered burner styles, designs, flame shapes, and air delivery types with our last couple of Combustion Corner columns, I suspect there was a good deal more analysis given to the selection of burners.
To appreciate the history of burner design, “furnace guy” should realize why burners evolved in the first place: fuel source. When the first burners were starting to be used on box furnaces, they used oil, kerosene, and fuel that had to be pumped. Over the years, many different fuels have been used. Yet, we have a tendency to think of gaseous fuels as the only option for burner performance.
Bedpost Burners
I recall the first time I got called into a facility to try and improve the performance of the furnaces (yep, I truly am a furnace/burner guy). It was a big box furnace that could handle 3-ton quench and temper loads. At that point, I was unaware of the multiple types of burners that were out in the market.
The owner of the shop opened the furnace door for me to see the combustion system. I stared. Sticking into the walls of this big box furnace were bedposts. These “burners” were purchased at 50¢ a post from some hotel auction, and they had about 50 spare posts to boot.
Grinder slots had been cut into the top of these posts. Refractory had been mudded into the mounting blocks to protect the fuel feed, which was being forced, or should I say blown, in through the bed posts and atomized by the pressure of being squeezed through these slots in the knob at the top of the posts!
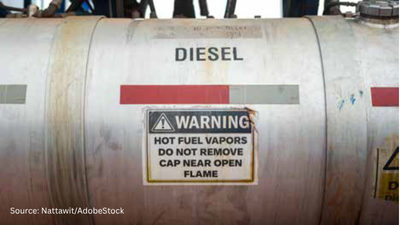
The fuel? Diesel fuel. Regular, old, out-of-the-pump diesel fuel. Or kerosene, for that matter. I was told the system could also use fire pulverized coal, sucked into the bedpost by pitot feeds of compressed air. They lit the burners with burning oily rags tossed into the chamber and quickly opened the valves controlling the fuel.
I was there to sell new modern high-efficiency gas burners.
I declared that this was antiquated, unsafe, archaic, dirty, and said about a thousand other denigrating comments.
The owner of this heat treat said, “Yep, it’s all those things, and more!” He continued, “It’s also reliable, simple, and predictable.” He mused, “I suppose that that thing hasn’t really broken down or shut off in the 25 years since we built it!”
I’m a fairly quick study and surmised that I was not going to make this sale. Duh! This furnace had everything they needed. And the gas system I was going to propose was going to be expensive.
A Burgeoning Gas Industry and Our Next Column
That furnace was still running when I made a move to another city some 10 or so years later.
Eventually, the gas industry that cropped up made fuel cheap…and I mean cheap. I thought, “I bet that guy and his accursed bedpost burners will talk to me now!” So, I went back, and that fella said, “Yeah, we got out of the business that used that old process and moved on. We’d be glad to talk about modernization.” And we did.
That same outfit that operated bedposts for burners for 50 years became a vanguard for modern efficiency and process improvement.
Natural gas as a fuel source is quite modern. Nowadays, that is essentially the truth: natural gas and sometimes other gaseous equivalents tend to be the most widely used fuels in the industrial world.
When looking at the rapid developments of burner configurations and why they developed, it is best first to understand some of the history of these developments. See you in the next installment to talk about the history of the industrial gas industry.
About The Author:
Jim Roberts President US Ignition
Jim Roberts president at U.S. Ignition, began his 45-year career in the burner and heat recovery industry focused on heat treating specifically in 1979. He worked for and helped start up WB Combustion in Hales Corners, Wisconsin. In 1985 he joined Eclipse Engineering in Rockford, IL, specializing in heat treating-related combustion equipment/burners. Inducted into the American Gas Association’s Hall of Flame for service in training gas company field managers, Jim is a former president of MTI and has contributed to countless seminars on fuel reduction and combustion-related practices.
For more information: Contact Jim Roberts at jim@usignition.com.
For heat treaters, choosing the right refractory lining is critical to keeping furnaces running safely and efficiently. Linings must endure extreme heat, stress, and chemical attack while balancing downtime, longevity, and cost. In this article, Plibrico Company Technical Services Groupexplains how refractory engineers carefully balance five critical factors to deliver solutions that meet today’s demanding production needs.
In refractory lining maintenance, recommendations for repairs and relines often consist of selecting a similar or equivalent material to replace the original. Sometimes that’s sufficient. Many refractory contractors and maintenance teams strive to use best practices by purchasing the same refractories that have worked on similar equipment in the past, but this carries the risk of assuming that nothing has changed in the process, production, or maintenance of the equipment over time. This assumption can be a dangerous bet because furnace equipment is made to meet the immediate demands of each thermal processor, and these demands often change depending on factors like production orders and maintenance capacities.
Choosing an appropriate refractory lining for an application isn’t always a straightforward decision. Many times, it is part science and part art. Making an effective choice requires knowledge of the industrial application process, refractory performance expectations, and potential refractory service failures. These factors must then be weighed against each other to find the right balance and best solution.
While there are a number of important criteria to consider, refractory engineers focus on five aspects to evaluate and choose a refractory material for each specific application: thermal, mechanical, chemical, logistics, and value — as well as connections among these aspects.
What is the best refractory material choice? To answer this question, each individual application requires an overall evaluation of the thermal processing furnace in relation to each of the five factors, and then a careful balance of each of these in finding the best solution that meets both the immediate and long-term needs of the thermal process.
Thermal Requirements: Temperature
For any high-temperature industrial process, the primary piece of information is the operating and maximum temperatures. The refractory lining chosen must meet the operating temperature requirements.
Refractory linings are designed to maintain physical properties at very high temperatures — 932°F and above. Refractories used to line thermal equipment must have proper insulating properties to reduce the steel skin temperatures to acceptable levels, usually well below 300°F. Multi-component linings employ a dense refractory material at the hot face with an insulating refractory or ceramic-fiber board or blanket behind it, well-known for achieving adequate cold-face temperatures with structural integrity for long thermal life.
Spalling and thermal shock are the most common thermal failure mechanisms in a refractory lining. These are due to crack formations caused by temperature cycling and high thermal loads. There’s more to learn about fracture mechanics thanks to expert research, but knowing the importance of this phenomenon is enough for the application specialist.
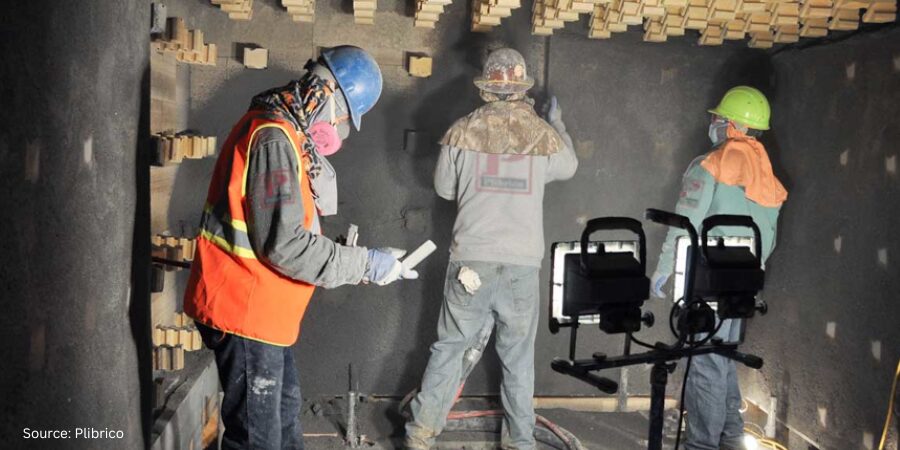
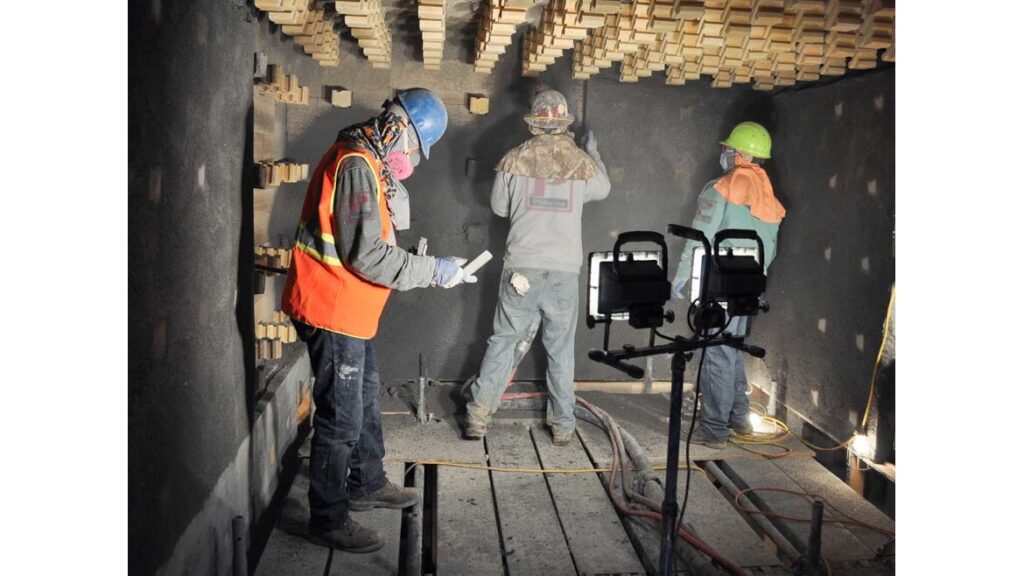
Refractory engineers working on refractory layer Source: Plibrico
In recent years, many thermal processors have experienced increased production demands. Meeting that need means that their furnaces are operating at higher temperatures for increased output. Running furnaces harder and faster often has the unintended consequence of overheating the refractory to the point that phase changes in the refractory matrix start to occur, causing lower-temperature glassy phases to form, softening the refractory, and shortening life. Due to this, the refractory engineer often needs to consider a material with higher refractoriness to meet the performance needs of shock resistance and high thermal loading. This usually means a higher-alumina material.
Physical Properties: Mechanical
The vast majority of higher-performing refractories in service today have been developed to maximize a material’s physical properties to improve lining lifespan and keep furnaces running at their best performance. Much of the information on a product Technical Data Sheet is devoted to the physical properties of the material, such as cold crushing strength, hot/cold MOR, and abrasion resistance. All of these are based on well-defined ASTM standards to make valid comparisons among available choices.
Refractory linings experience all sorts of mechanical and thermal loads that lead to wear and eventual failure, requiring repair or replacement. Some of these include excessive expansion, thermal cycling fatigue, mechanical impact (dynamic loading), severe abrasion and erosion, pinch spalling, tensile loads, large hydraulic loads (such as in molten-metal containment furnaces), and creep (deformation at high temperatures over time). While a deeper discussion of each of these failure modes is beyond the scope of this article, knowing the type of potential refractory failures for each application becomes the solution in choosing the refractory to best address the failure mode present.
During a visual refractory inspection, the lining can often give clues about failures. Crack patterns, wall buckles, surface spalls, discolorations, and other visual differences occur in locations and manners that correspond with their failure type. Mechanical and thermal forces will find weak points and initiate cracking. Many times, these occur in typical geometric locations and patterns, such as sharp inside corners, archways, midpoints of a lining, and in circular patterns, indicating a particular failure system. These will usually indicate shock and expansion due to high thermal loads, inadequate expansion allowance, deficient material properties for the application, and/or improper anchoring.
Corrosion: Chemical
Chemical attacks on the refractory matrix have been a fundamental concern of ceramics engineers since the beginning of refractory development. Chemical reactions between the vessel’s contents and the refractory at high temperatures can cause a change in the structure of the refractory matrix, which can have a detrimental effect on the performance and life of the lining. Chemical or mineralogical changes due to reactions occurring within the refractory lining can cause excessive volume change of the crystal structure or reduction of the oxides in the lining, leading to a breakdown of the ceramic bonds in the cement. The most common examples of these are:
A reducing atmosphere of carbon monoxide reacting with the lining, such as in CO boilers
An H2 reaction in the lining, which reduces silica in the refractory matrix at high temperatures
Molten slags, such as in coal-fired boilers
Alkali corrosion from ash in wood-burning furnace applications
Corundum growth in aluminum furnaces, especially those with aggressive alloys containing MgO
Installation: Logistics
In addition to the aforementioned elements, refractory construction contractors are faced with multiple logistical pressures to get their clients’ thermal processing equipment back on-line. This means that the choice of anchoring systems, installation methods, and bake-out becomes an important consideration.
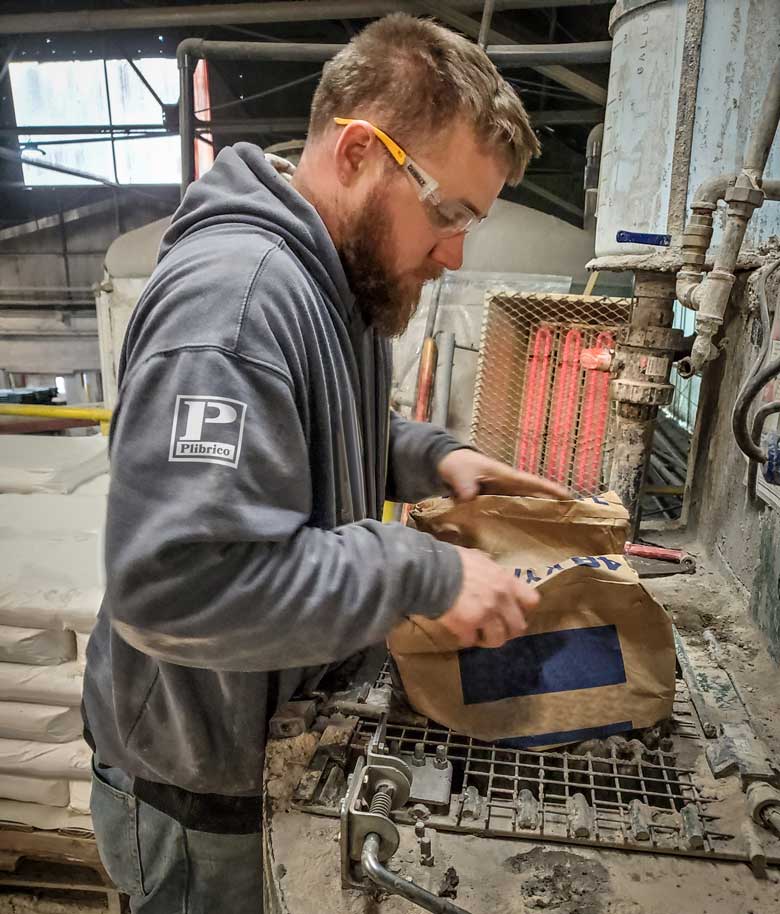
Preparing for mixing Source: Plibrico
The adage “time is money” is often a deciding influence when crafting a refractory solution. “Get it back up and running ASAP” is often the most pressing need communicated by the thermal processor. For example, while a brick lining often gives clients a highly durable option, bricking a job is very labor-intensive, requires high levels of experience, and usually takes a long time to complete. A cast-in-place lining may yield the best physical properties in service, but the time also needed for forming (or multiple formings), casting/pumping, then stripping may not be desirable. In other words, the required length of downtime may not justify these options.
Another example is the use of low-cement castables, which have superior properties. These have been around since the Plibrico Company first developed them, but they require more careful and longer bake-out. Gunning or shotcreting the lining could be a viable option if time or cost is a determining factor because forming is not required, and material can be placed at higher rates.
While a cast product theoretically produces the best physical properties in general, followed by shotcrete and gun mixes, time limits may require another method of installation. Other factors to consider may be to ram the lining using plastic, which requires no setting or moist cure requirements. With the advent of reduced bake-out refractories, such as Plibrico’s Fast Track castables and gun mixes, contractors can place material and fire several hours sooner. This saves time and money but often at a cost of reduced physical properties. Again, it is a balancing act.
Price: Value
Refractory linings are one of the most significant operational costs over the life of an industrial furnace. Therefore, when choosing a material for the application, price is always a very important factor. However, value is not only reducible to price; there is often more than one choice of materials to pick from.
The economics of each individual application can direct the engineer/specialist to recommend one solution over another. When we speak of price, the real driver is value. Everyone wants a refractory product installed that is good, fast, and inexpensive. However, it is often very difficult to achieve all three of these simultaneously. Value is the determination of the relative importance of each.
Conclusion
The question to be asked is this: What do refractory linings do? Their most basic function is to withstand very high temperatures; contain heat within a vessel; have adequate physical properties, such as strength; and resist chemical degradation or disintegration by aggressive atmospheres and corrosion by liquid slags and solids.
Choosing the right material solution for thermal processing applications requires balancing multiple aspects to determine a hierarchy of which aspect is most important. In many cases, there is no single answer to the problem. However, understanding the process, challenges, history, and root causes of refractory failures becomes the key to making the best decision to solve the problem.
For more information: For more information about choosing the best refractory lining, contact Plibrico Company at contact@plibrico.com or 312-337-9000
This informative piece wasinitially published in Industrial Heating. All content here presented is original from the author.
Ask The Heat Treat Doctor® has returned to bring sage advice to Heat Treat Today readers and to answer your questions about heat treating, brazing, sintering, and other types of thermal treatments as well as questions on metallurgy, equipment, and process-related issues.
This informative piece was first released in Heat Treat Today’sOctober 2025 Ferrous & Nonferrous Heat Treatments/Mill Processingprint edition.
In today’s Technical Tuesday, Dan Herring continues his exploration of what hydrogen embrittlement is by contrasting it with other forms of embrittlement. Learn how to identify these various forms of brittle intergranular failure below!
We continue our discussion from last month concerning hydrogen-assisted cracking (aka hydrogen embrittlement) by looking at closely related phenomena, often mistaken for hydrogen embrittlement. Let’s learn more.
As a brief recap of what we discussed last month, the severity and mode of the hydrogen damage depends on:
Source of hydrogen — external (gaseous) or internal (dissolved)
Exposure time
Temperature and pressure
Level of residual and applied stresses
Type of alloy and its production method
Method of heat treatment
Treatment of exposed surfaces (barrier layers, e.g., oxide layers as hydrogen permeation barriers on metals)
Final treatment of the metal surface (e.g., galvanic nickel plating)
Presence of chemicals that may react with metals (e.g. acidic solutions)
Number of discontinuities in the metal
There are, however, several other embrittlement mechanisms that are often mistaken for hydrogen embrittlement and we will explore these here.
Quench Embrittlement
Contact us with your Reader Feedback!
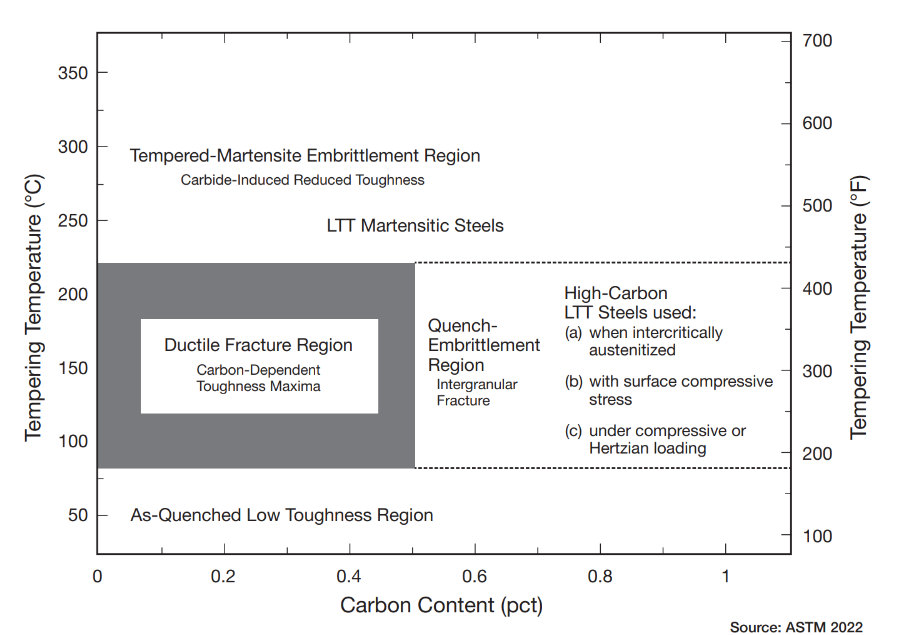
Many high hardenability steels (e.g., 4140, 4340, 52100) are susceptible to a form of brittle intergranular failure from a phenomenon known as quench embrittlement. Under tensile or bending stress, higher carbon steels are susceptible to intergranular fracture in both the as-quenched condition and/or after low temperature tempering — generally considered “safe” from traditional embrittlement. A transition from ductile to intergranular fracture in martensitic steels having greater than 0.5% C can be embrittled even when tempered at low temperatures.
This phenomenon is different from tempered martensite embrittlement (TME) or temper embrittlement (TE), as explained below, as embrittlement occurs before tempering. The issue is exacerbated by the presence of certain embrittling elements (e.g., P, S, As, Sb, Sn, Pb) solely or when their combination reaches a high enough percentage (typically, 0.10%).
Temper Embrittlement
In broad based terms, TE involves a reduction in the normal ductility of a metal due to a physical or chemical change. TE is characterized by reduced impact toughness and occurs in certain quenched and tempered steels and even in ductile irons with susceptible compositions. This form of embrittlement does not typically affect room temperature tensile properties but causes significant reductions in impact toughness and fatigue performance. Although normally associated with tempered martensite, it can also occur if the matrix is tempered to the fully ferritic condition.
Types of Temper Embrittlement
When tempering steel, several types of embrittlement must be avoided. The first type, TME, is an irreversible phenomenon that can occur within 200−400°C (390−750°F). Years ago, it was called “blue brittleness” for the steel’s surface oxidation appearance, but this term is misleading since it can occur at temperatures below the onset of a blue coloration on steel.
Figure 1. Fracture modes in hardened steels
The second type is TE, a reversible phenomenon that occurs when steels are heated in and/or slow cooled through the temperature range of 375−575°C (705−1070°F).
Why Does it Happen?
TME and TE are examples of intergranular embrittlement. A common factor in such failures is the presence of elements that segregate to the grain boundaries. The chemical reaction rate or kinetics of segregation are such that they exhibit “C” curve behavior in the 350−550°C (660−1020°F) range; in other words, segregation does not occur uniformly. Both types of embrittlement are in part related to grain-boundary segregation of impurity elements (e.g., As, P, Sb, Sn), and both develop during thermal processing after austenitizing and quenching to martensite, usually indicated by an upward shift in ductile-to-brittle transition temperature.
TME is thought to result from the combined effects of cementite precipitation on prior-austenite grain boundaries or interlath boundaries and the segregation of impurities at prior-austenite grain boundaries. By contrast, TE is thought to be caused by the formation of carbides on decomposition of martensite, in particular, precipitation of carbides in the form of films at grain boundaries. At higher temperatures of tempering, this film disappears and cannot be restored on repeated heating at 250−400°C (480−750°F).
Which Steels Are Affected?
All steels are susceptible, so the real question becomes how susceptible and what factors affect that susceptibility. For example, while plain carbon steels may contain some of the same impurity elements that will cause the embrittlement phenomenon to occur in other steels, the segregation of these elements is often enhanced by or caused by the presence of other alloying elements in substantial quantities. As a result, alloy steels, in general, have more susceptibility than carbon steels.
It is important to understand that the degree of embrittlement is affected by the prior austenite grain size and hardness. So, if we are dealing with a fine-grained plain carbon steel of low hardness, it may not experience embrittlement symptoms despite its phosphorous content, whereas a more highly alloyed Cr-Ni steel used at higher hardness is more susceptible to its impurity content.
Widely used alloying elements, such as chromium, nickel, and manganese, tend to promote TE with the highest embrittlement effect observed in Cr-Ni and Cr-Mn steels. Small additions of molybdenum (0.2-0.3%) can diminish TE, while greater additions enhance the effect. TE can be prevented by keeping silicon and phosphorus levels as low as possible, adding up to 0.15% molybdenum and avoiding the embrittlement heat treating conditions.
Susceptibility also depends on impurity control and here is where the steelmaking process is critical. For example, in plain carbon and Cr-Mo steels (those with no Ni) where phosphorous is the most impactful embrittlement element, the percentage can be controlled by the steelmaking process. In steels that contain significant amounts of nickel, antimony and tin are more potent embrittlement elements. Phosphorous has an effect but not as large as it has in plain carbon and Cr-Mo steels. It should be noted, however, that antimony and tin in plain carbon steels can cause other hot working issues.
How Can We Correct It?
TME is irreversible, and its effects are permanent. By contrast, the effects of TE can be reversed. This is done by re-tempering above the critical temperature of 575°C (1070°F) then cooling rapidly. Impact toughness can be restored. If necessary, this process can be repeated.
A Simple Example
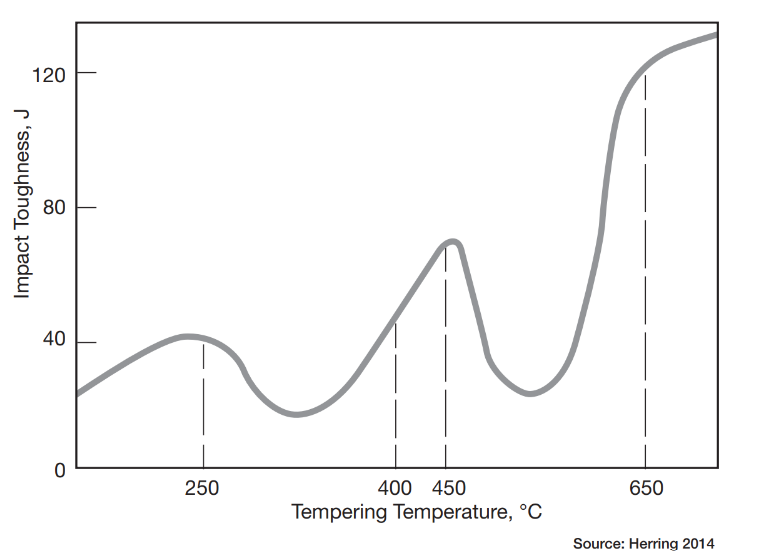
Alloy steel, which is susceptible to TE, will exhibit a relationship such as shown on Figure 2. Note that the impact toughness of quenched steel after tempering at 200−400°C (390−750°F) is lower than that obtained on tempering at temperatures below 200°C (390ºF). If brittle steel tempered in this range is heated above 400°C (750ºF) and transformed into a tough state, a second tempering at 250−400°C cannot return it to the brittle state. The rate of cooling from the tempering temperature range of 250−400°C has no effect on impact toughness.
Figure 2. Effect of temperature on impact toughness
The susceptibility of a given steel to TE depends on a number of factors, including grain size, hardness, steel grade, and the impurity control in the steelmaking process itself. Remember, not all steels and not all steelmaking processes are equivalent.
A heat treaters we must avoid the temptation to temper to a given hardness value without understanding the consequences of our actions. Since we do not have a simple embrittlement test that can be used on the shop floor, we must understand the phenomenon and question specifications that put us into TE ranges.
In Summary
The insidious nature of hydrogen embrittlement continues to cause concern and product failures during processing and during service, but as explained above, there are other heat treatment operations that can result in embrittlement. All of these and others (e.g., aluminum nitride embrittlement, overheating during forging, hot shortness) are responsible for many serious and in some instances catastrophic failures leading to injury or damage. All must be avoided.
References
ASTM International. 2022. ASTM B850-98 (Reapproved 2022): Standard Guide for Treatments of Steel for Reducing the Risk of Hydrogen Embrittlement. West Conshohocken, PA: ASTM International. https://www.astm.org.
Herring, D. H. 2014–2015. Atmosphere Heat Treatment, vols. 1–2. Troy, MI: BNP Media.
Herring, D. H. 2006. “The Embrittlement Phenomena in Hardened & Tempered Steels.” Industrial Heating, October.
Herring, D. H. 2004. “A Heat Treater’s Guide to Hydrogen Embrittlement.” Industrial Heating, October.
About the Author
Dan Herring “The Heat Treat Doctor” The HERRING GROUP, Inc.
Dan Herring has been in the industry for over 50 years and has gained vast experience in fields that include materials science, engineering, metallurgy, new product research, and many other areas. He is the author of six books and over 700 technical articles.
In this Technical Tuesday installment of Combustion Corner, Jim Roberts, president of U.S. Ignition, examines various burner nozzle shapes, sizes, and effects.Use this helpful resource to evaluate whether your own in-house heat treat burners are the right choice for your applications.
This informative piece was first released inHeat Treat Today’sSeptember 2025 Annual People of Heat Treat print edition.
A furnace guy walks into a bar and shouts “Straighten UP!” The other furnace guys turn to furnace guy #1: “It won’t work!” Just like last month. Let’s continue this topic.
What would you say if I asked you, “What does fire look like?” How would you describe fire to me — color, size, smell, temperature? It’s kind of a weird thing to try and do.
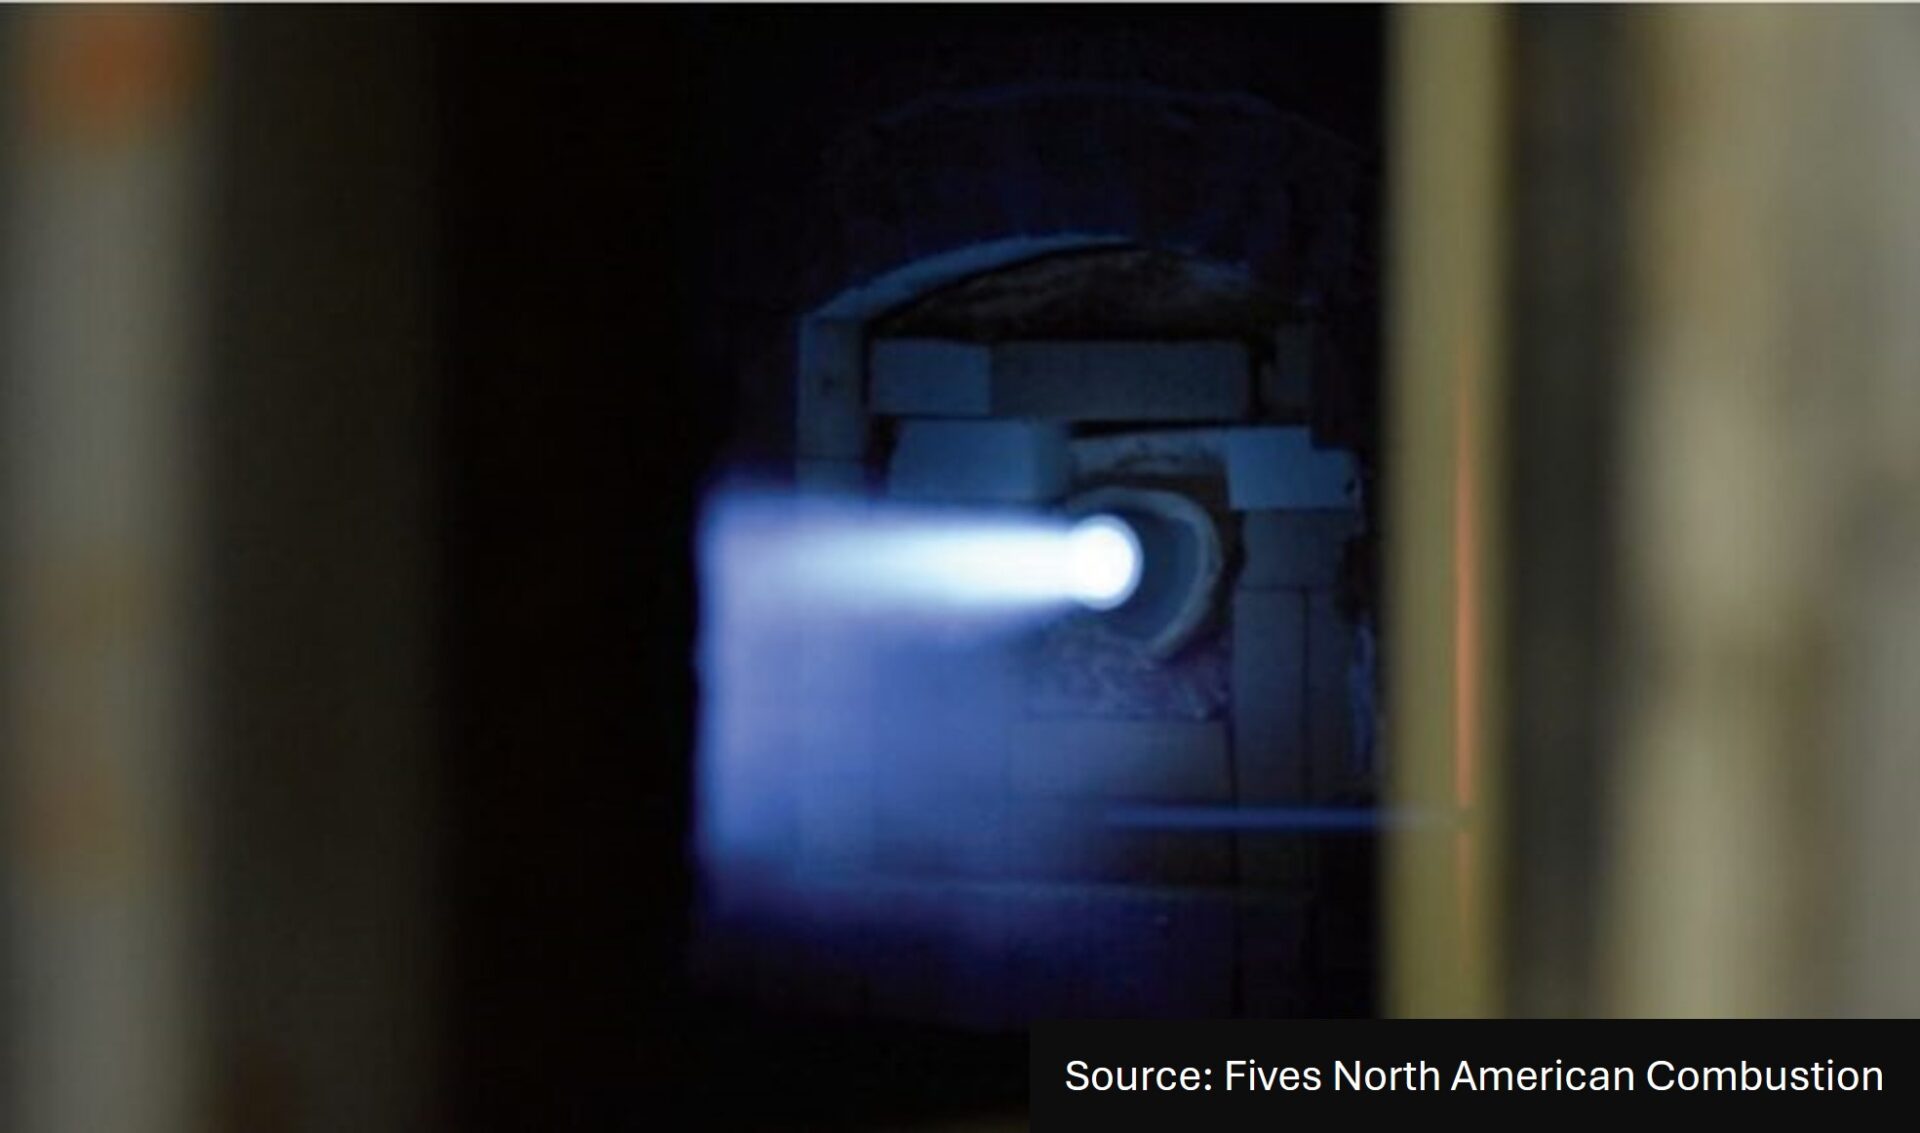
Figure 1. Fives Group’s North American Tempest
Last month, we ended by talking about how “air staged” burner design can make the flame exit the nozzle at a whopping 270 mph. There’s a reason that trade names for some of these burners are “Therm-Jet” and “Tempest” and “Hot Shot.” In these instances, velocity and turbulence are the game. The flame appearance is almost always a pinpoint tip, not dissimilar to what we have all seen spitting out of the tail of a fighter jet aircraft.
And, as an interesting aside, these high-velocity industrial burners can be victims of the same phenomena as a jet engine: flameouts. A tremendous amount of design time and testing has been dedicated to keeping the flame “retained” on the nozzle. If the flame lifts off the nozzle, cup, etc., it risks being blown out by the high-velocity stream of gases being produced in the guts of the burner. At these speeds, you cannot count on the burner backlighting, so a flame failure is imminent.
More Burner Types
The other types of nozzle-mixing burners are flat flame burners. These are sometimes called wall huggers or radiant wall burners. In these designs the idea is to have as little forward momentum to the flame as possible and to run the burners in a fuel-rich or highly luminous state. The design features are such that the whole wall of the furnace will be glowing radiantly and using radiation from the glowing walls to heat the product.
There are also infrared burners, where the burners are like a porous foam or screen grid and flame just glows on these surfaces. Again, the intent is radiant heat as opposed to velocity gases. These are very prevalent continuous production processes where radiant, consistent heat is required.
There are also radiant tube burners, where the flames are fired through an alloy or ceramic tube, and the flame is isolated from the process completely. The idea here is that the tube does not allow the products of combustion to make contact with the parts. Also, in most radiant tube furnaces, some sort of process atmospheres — comprised of a variety of gases to protect the products in the furnace from oxidation or to impart a metallurgic property to those parts — have been introduced to the chamber and the process.
As such, burner design engineers have to figure out how to give a very uniform heat delivery to the tube they are firing into. Many times, a burner will need to mix the air and gas very slowly (compared to direct fired furnace burners) to ensure the flame releases its radiation at a very uniform rate, so as to not distort the radiant tube itself. And the users of these variety of burners range from flame hardening to direct fired to indirect fired atmosphere processes and many more.
Figure 2. Fighter jet aircraft
We will continue this discussion point in subsequent columns because understanding these burners is critical to using them correctly. As for the original idea that flame shapes can affect all sorts of process performance, we will revisit this topic and others, because it’s all important. Different flame shapes can significantly impact combustion performance by influencing factors like flame speed, stability, heat release, and certainly one of the big design goals now, emissions reductions. We’ll tackle these topics in future columns.
Until then, I would suggest that you take a walk into the plant and check out the variety of burners that you may have. Let’s endeavor to find more about them and consider, “What would make this burner the right choice for this application?” Then, discover what you can learn about them and their history. We will tie that all together when we discuss the next installment.
Jim Roberts President US Ignition Contact Jim Roberts at jim@usignition.com
Hydrogen is essential for many heat treating processes, but what happens when your supply runs out?
In today’s episode of Heat TreatRadio,Devon Landry of Nel Hydrogen joins Heat TreatRadioHost Doug Glenn to discuss the potential risks of delivered gas and how on-site generation can secure reliable, high-purity hydrogen. This episode highlights the advantages of on-site generation and what questions to ask before making the switch.
Below, you can watch the video, listen to the podcast by clicking on the audio play button, or read an edited transcript.
The following transcript has been edited for your reading enjoyment.
Hydrogen Usage in Thermal Processing (4:05)
Doug Glenn: All right, let’s talk hydrogen. I think the first thing I’d like to do is talk about the basics, how hydrogen is used and what it’s used for in thermal processing.
Can you give us a 30,000-foot view on hydrogen and why are we using it in thermal processes?
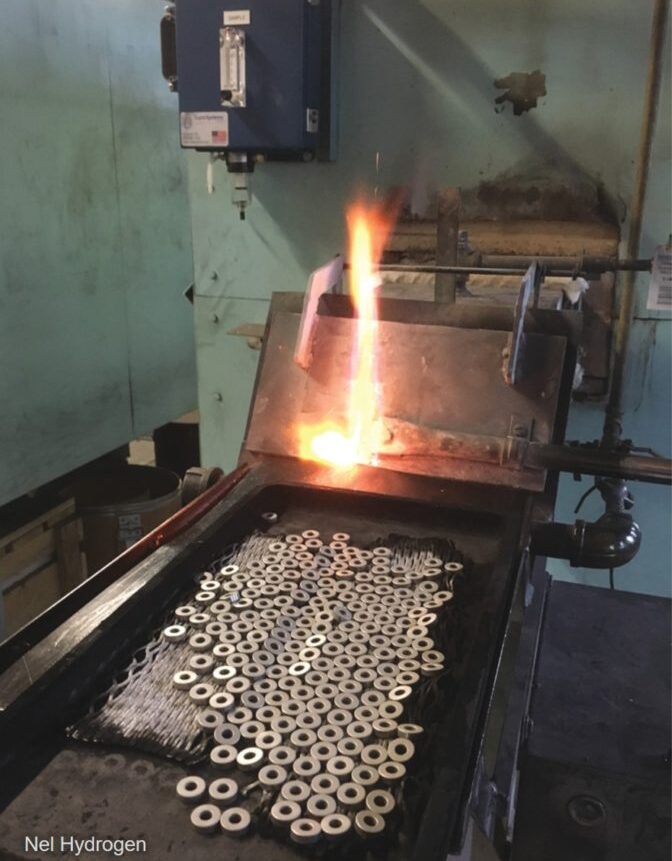
Devon Landry: Hydrogen is widely used in heat treat and processing. It’s a powerful reducing agent for surface cleaning and sintering success.
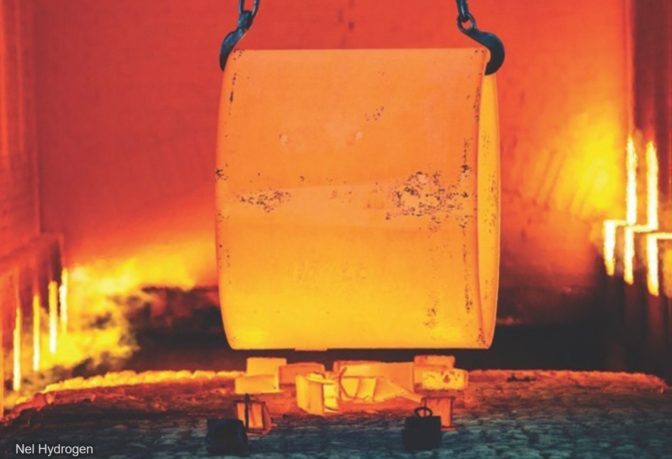
Hydrogen scavenges oxygen, counteracting minor furnace leaks. Photo Credit: Nel Hydrogen
It has the highest heat conductivity of any gas, so we can enter and exit parts quicker. It has lower density relative to air and nitrogen, which makes it really straightforward to manage. It burns off easily, readily, cleanly. The only true byproduct of that would be water.
Doug Glenn: We are talking about the security of hydrogen supply.
How important is it for people who need hydrogen to have it, and what happens if they don’t have it — what are the risks here?
Devon Landry: My predecessor, Dave Wolff, used to say it’s like yeast for a pizzeria. It’s a very small part of the cost, but if you don’t have yeast, you don’t have pizza. If you don’t have pizza, you don’t have business. So if you don’t have hydrogen, you can’t really run your processes.
The same with running out of hydrogen. If you’re halfway through a batch and you run out of hydrogen, that whole batch is done. If that batch isn’t finished and you don’t have any hydrogen left, you don’t have business. You have to send employees home and stop your production. You can run into a lot of problems.
Doug Glenn: If you’re processing high-value parts, it’s not just a matter of simply running out of parts and not being able to finish the load. That load could be worth a quarter of a million dollars.
Devon Landry: That’s correct, the parts are completely done; you won’t be able to use those parts — it’s a completely wasted batch. So, you would lose money, not just from excess production, but that batch as well.
On-Site Hydrogen Generation vs. Supplied (06:25)
Doug Glenn: There’s different ways of getting your hydrogen, it can be supplied or Nel, the company you’re with, supplies the equipment to manufacture hydrogen on-site. What type of risks are companies exposing themselves to if they are not generating their own hydrogen?
Devon Landry: Delivered hydrogen is really the only other way to get your hydrogen, and that’s through industrial gas suppliers. I see a shortfall in the future, especially with liquid hydrogen production. There are many hydrogen plants that are getting canceled or delayed.
Supply chain and hydrogen requirements for Artemis rocket
You see, it costs a lot of money to make these plants, and if the financial advisors deem that the plant is not going to make money, they’re not going to do it.
For the Artemis rocket, that takes a full day’s production of liquid hydrogen in the U.S. to fill up. And there are many projects out there that are requiring liquid hydrogen, which is why I see a shortfall coming.
If you can’t get the hydrogen from your industrial gas supplier, where are you going to get it?
That’s where Nel Hydrogen comes in. With generating on-site, you take control of your hydrogen supply.
Doug Glenn: You mentioned that you foresee a lack of supply and that some of these hydrogen plants aren’t being approved.
Why aren’t these plants being approved to be built?
Devon Landry: They cost a lot of money to build and industrial gas companies have a long-term strategic focus, with capital discipline kind of upfront. If you’re going to build a plant and shareholders are not going to see any returns on it, then they’re not going to do it.
So we’ve seen a lot of cancellations. They haven’t really have a good commitment to shareholder value, and they emphasize on strong fundamentals there.
Doug Glenn: At one point in time, there was a lot of talk about hydrogen fuel cells. And everybody wanted to do hydrogen. I haven’t heard much about that recently. Do you think that might have something to do with the cooling off of the hydrogen market?
Devon Landry: Yes, I think so. There was a hydrogen world out there, and people really wanted to build new plants, have fueling stations. There’s so much you can do with hydrogen. But policies around hydrogen are affected by different administrations. With the current administration, they’re taking some of those incentives away. So there’s not as much money being provided as an incentive.
Doug Glenn: This is all the more reason to be very careful about your hydrogen supply. Not only your current hydrogen supply, but in the future. With politics and different administrations, sometimes hydrogen fuel cells is on, then it’s off. As a result, supplies may be a bit dicey. Therefore, it’s probably well worth people paying close attention to where they’re getting their hydrogen now and what the future looks like.
Your input is really important here.
Proton Exchange Membrane (10:23)
Hydrogen cleans part surfaces to enhance processing results. Photo Credit: Nel Hydrogen
Doug Glenn: Tell me about PEM; what does that stand for?
Devon Landry: PEM stands for proton exchange membrane. It’s a differential pressure system, where hydrogen is allowed to pass through the membrane but oxygen cannot.
We’re taking ultra pure water with a resistivity of greater than one mega ohm. That’s going through into the cell stack and the electrolysis takes place there. The hydrogen is allowed to pass through that membrane; the oxygen is not. So, the hydrogen goes towards the process.
Doug Glenn: Oxygen and/or water is the only byproduct.
Devon Landry: Yes, and it returns to the main reservoir, and that oxygen gets vented, either out of vent stack or into the room.
Doug Glenn: The primary markets that Nel Hydrogen serves are mostly industrial, and Nel can also do much larger units. Can you tell me about that?
Devon Landry: With alkaline and PEM both, we can do megawatt style units. I handle primarily the industrial units, and we can go all the way up to 100, 200, 300 megawatt systems — a very vast range.
Doug Glenn: Most businesses in our industry would not need that much, but it’s good for our people to know that you guys have expertise, not just in the sizes that are good for them, but larger sizes as well.
Nel Series hydrogen generators Source: Nel Hydrogen
PEM Process vs. Alkaline (12:05)
Doug Glenn: We have discussed the PEM process. Can you explain the difference between how the hydrogen is extracted from the PEM process vs. alkaline?
Devon Landry: The alkaline system uses KOH, which is highly corrosive and dangerous to handle. You have to fill it up, so there’s a safety aspect with that. In addition, the purity that you’re getting out of the alkaline process is not quite as high as PEM. I think it’s 90%, but it can be 97 to 98%.
With the PEM process, the only output you’re getting is hydrogen and some water, and we mitigate that water with a dryer inside the system. We get five nines purity plus: 99.999% purity plus.
You really need that purity in a lot of the heat treating processes to give you the coloration of the pieces that you’re putting through. With the industrial gas suppliers, you often have to pay a premium to have higher purity. Many times, when you send those cylinders or a tube trailer back to get it refilled, they do not test it to find out exactly what the purity is unless you specifically request that. So your purity might differ every now and then, which means you’re not going to get the exact effect on your process that you would like.
The way the industrial suppliers are making that hydrogen is through steam methane reforming. It’s very energy-intensive, and carbon is a major by-product of that process.
Our machines are as carbon free as your electricity supply line: if you’re feeding it with solar and wind energy sources, utilizing renewable energy, then you are at a zero carbon footprint.
Doug Glenn: You would have true green hydrogen. If your electricity supplier was green, then you would be really producing green hydrogen, which would be very good.
Delivered Gas vs. Hydrogen Generation (14:55)
Doug Glenn: What questions should companies be asking if they are considering moving away from bulk or delivered gas to on-site hydrogen generation?
Devon Landry: To have a hydrogen generator on-site, you need to know your flow and your pressure. There are going to be operational and capital costs.
The capital costs are a little larger with the hydrogen generator. So you’ll need to know how much gas you’re using and what pressure you’re using at. We have calculators to determine which unit would be best for you based on those questions.
If the capital costs are a little too high, which they are for some companies, then we do have leasing options that will help with that capital cost. We can break it down monthly, even for a 10-year period of what you would be spending for your delivered gas versus a hydrogen generator on-site.
Doug Glenn: So, you can do that analysis for businesses if they can provide their current expenditures for delivered hydrogen and usage, and then you can do a comparison to advise them on what it would cost if they were to transition to on-site generation?
Devon Landry: Yes, exactly. Industrial gas suppliers can come with a lot of bills, so you have to pay attention. There could be a trailer rental fees, cylinder rental fees, delivery fees — a lot of bills combining into one. They also generally require signing a contract with them that could be seven plus years, and you have to provide quite a long notice to be relieved of those contract obligations as well.
Doug Glenn: The capital cost could potentially be different, meaning probably more for an on-site generator for hydrogen. When you think of bulk gases, the operating costs are quite low for delivered gas.
How about operational costs for hydrogen?
Devon Landry: The cost of hydrogen generation is going to be the cost of your electricity. The price per kilowatt is going to tell you how much cost per standard cubic foot that you’re going to be paying for it.
Doug Glenn: Electricity is really the only major cost operationally. How about maintenance costs?
Devon Landry: The maintenance cost depends on which machine you select. We build maintenance costs right into the calculator that tells you how much the costs will be per year. There’s a quarterly maintenance cost, which is just basically a calibration, and then a yearly maintenance kit that you can put in yourself.
Doug Glenn:Do you need to have any special personnel to run it or is it self-maintaining?
Devon Landry: It pretty much takes care of itself. If there’s a problem with it, a pop up will let you know the problem, and you can go to the manual to learn exactly what the problem is. If you have a regular maintenance crew on site, many power plants have these, then you usually have somebody that can do it.
It’s generally filter changes and updates like that.
Community Perception on Hydrogen Generation (18:25)
Doug Glenn: Pertaining to public perception, how has the community responded to hydrogen generation?
Devon Landry: Most people like it better. We like to refer to it as the good neighbor benefit. Would you rather look outside and see a gigantic tank full of combustible gas or a quarter inch, stainless steel line?
Fire marshals love it because we store less than seven standard cubic feet on our biggest machine, internally.
And then when we hit the stop button, or if the generator shuts down, the hydrogen is all vented out into the atmosphere. There’s no stored hydrogen — only a minimal amount inside the machine.
Doug Glenn: No rocket ships in your backyard.
Devon Landry: Looking out the window, I’d rather see the sky and some bushes rather than a big tank.
Is Hydrogen Generation Right for Your Company? (19:30)
Doug Glenn: Are there instances where generating hydrogen on-site doesn’t make sense for a company or when bulk delivery is a better deal?
Devon Landry: This is why we have those calculators. I don’t need a company buying a generator if it’s not going to save them money or if it’s not going to be easier for you. It’s really only practical when you’re under 10,000 standard cubic feet per hour.
Doug Glenn: Is that amount for a very large industrial manufacturing plant?
Devon Landry: Yes, that’s quite a bit.
Doug Glenn: Is there any amount that’s too small in which it wouldn’t make sense to have a generator?
Devon Landry: No, our smaller generators put out about 10 standard cubic feet per hour, about 4.9 liters per minute, and it’s on-demand. If you need the smallest amount possible, they’ll put that out for you. If you don’t need any further for the interim, it will basically sit there in idle. These generators are fully on-demand and give you exactly what you need.
Doug Glenn: Which companies currently are out there that it really makes sense for them to look at on-site hydrogen generation?
Devon Landry: Really, anybody that needs hydrogen. If you’re not excited about your delivered hydrogen, if you’re having issues with it, if the cost is too high, we have a lot of different industries that we run with. Many are heat treating and metal processing business. There’s also chromatography, gas chromatography, MOCVD, many different industries. If you have delivered hydrogen, generating hydrogen on-site would be worth looking into.
Final Thoughts (22:45)
Doug Glenn: Where is the corporate headquarters or the world headquarters for Nel Hydrogen?
Devon Landry: Nel Hydrogen is headquartered in Oslo, Norway.
Doug Glenn: How long has company existed?
Devon Landry: It started in 1927.
Doug Glenn: Where’s the main headquarters in the U.S. or North America?
Devon Landry: We’re in, Wallingford, Connecticut, and all of our PEM machines are built there.
Doug Glenn: Very good. I’d like to thank all the everyone for listening.
Hopefully you found this episode enjoyable and informative. Thanks again, Devon. Appreciate you being here.
About the Guest
Devon Landry Senior Field Engineer and Technical Lead Nel Hydrogen
Devon Landry has been an integral part of Nel for 16 years, establishing himself as a leading expert in industrial on-site hydrogen generators. With over 15 years as a Senior Field Engineer and Technical Lead in Technical Service and Customer Support, he has played a key role in delivering top-tier service and expertise to Nel’s global customer base. His extensive experience includes traveling more than 3 million miles worldwide, working across diverse industries and customer sites.
Beyond his technical proficiency, Devon brings strong leadership and business acumen. As an entrepreneur, he successfully founded and managed a craft brewery and taproom in Connecticut for six years, leading a team of seven employees. This experience further enhanced his ability to blend technical expertise with strategic management and operations.
What are the ways to improve the cleaning process of component parts and reduce smoke from residue and environmental impact? Mercury Marine faced this challenge head on with a new system. Learn more about their solution in today’s Technical Tuesday case study written by Chris Tivnan the sales manager for North America at SAFECHEM North America Inc.
This informative piece was first released inHeat Treat Today’sAugust’s 2025 Annual Automotive Heat Treating print edition.
Mercury Marine’s Need for Clean
Mercury Marine is a world leading manufacturer of marine propulsion systems headquartered in Fond du Lac, Wisconsin. A subsidiary of Brunswick Corporation, Mercury Marine designs, manufactures, and distributes engines, services, and parts for recreational, commercial, and government marine applications.
Mercury Marine has an in-house heat treatment facility for the components they manufacture. These components include gear case parts, such as propeller shafts, pinions, forward and reserve gears, and clutches. The parts undergo typical manufacturing steps like turning, milling, or gear tooth generation. Some machines allow for dry cutting, while others involve hydraulic oil. In total, more than 170 distinct metal parts require cleaning before undergoing vacuum carburizing, hardening, tempering, and/or cryogenic treatments.
Carburizing with Closed-Vacuum Solvent Cleaning
But vacuum carburizing has not always been the technology of choice for Mercury Maine. Prior to 2023, parts and components underwent initial cleaning in an aqueous washer before proceeding to atmospheric carburizing. Then, they were quenched in oil and then underwent another round of cleaning with a water-based cleaner.
Figure 1. NANO vacuum carburizing system from ECM
Mercury Marine made the strategic decision to transition from atmospheric carburizing to vacuum carburizing in 2023. The shift was motivated by concerns related to smoke and environmental impact, particularly the evaporation of oil residuals during tempering. The desire for an overall environmentally friendlier process further fueled this change.
Vacuum carburizing benefits from more stringent cleanliness requirements on parts whereby all residue oils, greases, and debris must be removed entirely to prevent contamination of the furnace and the vacuum pump system. As a result of these considerations, Mercury Marine replaced their existing aqueous cleaning process with solvent-based cleaning, convinced that this solution provided superior and consistently reliable cleaning results.
Figure 4. With lipophilic and hydrophilic properties, DOWCLENE™* 1601 removes oils and greases just as effectively as certain polar contaminants like cooling emulsions or solids (e.g., particles and abrasives). Source: ECM USA
Their furnace equipment manufacturer ECM recommended a closed-vacuum solvent-based cleaning machine (Model: SOLVACS 3S) from the manufacturer HEMO. This design could be seamlessly integrated into their NANO vacuum carburizing system.
The vacuum cleaning machine runs on the modified alcohol solvent DOWCLENE™* 1601. Because of its lipophilic and hydrophilic properties, DOWCLENE 1601 can remove oils and greases just as effectively as certain polar contaminants like cooling emulsions or solids (e.g., particles and abrasives). The solvent also has low toxicity and good biodegradability.
Enabling High Environmental and Safety Standards
The switch from aqueous to solvent cleaning initially raised some safety concerns within Mercury Marine’s environmental safety committee. However, these concerns were swiftly addressed once the committee understood the operation of a closed vacuum cleaning machine and how it contributes to the highest safety and sustainability standards.
First, the airtight design of the machine virtually eliminates air emissions. The hermetically sealed construction means there is minimal risk of contaminating groundwater. Additionally, full machine automation removes operator handling and minimizes chemical contact.
Figure 2. While closed vacuum cleaning machines enable high-quality cleaning results with strong safety and sustainability standards, HEMO designs integrate seamlessly into furnace lines
Second, the machine’s built-in distillation unit enables continuous solvent recovery — as high as 95% in Mercury Marine’s case — thereby significantly reducing chemical consumption and waste while lowering overall cleaning costs. Distillation ensures that parts are consistently cleaned in fresh solvent. The effective cleaning result is further warranted by the high solvent quality in the rinsing step, followed by vapor degreasing as the last cleaning step, which is highly effective due to high temperature difference between parts and vapor. With the drying process below 0.1 psi, a perfect drying of the parts is guaranteed.
Additionally, unlike aqueous cleaning, solvent cleaning does not consume significant water, nor does it require wastewater treatment, providing a considerable cost and environmental advantage.
Using a simple test kit, solvent conditions can be easily monitored on a regular basis. Solvent lifespan can also be extended by adding stabilizers, reducing the need for frequent bath exchanges. Due to the high stability of the cleaner, only minimal stabilizer additions have been required since the machine was first put into operation.
Leveraging CFC for Solvent Cleaning
Another crucial factor supporting solvent cleaning is the use of carbon fiber composite (CFC) workload trays and fixturing of the heat treat batch in the cleaning machine. After cleaning the parts, the CFC fixtures are directly transferred into the vacuum furnace. This streamlined workflow eliminates the need to transfer parts between different fixtures, minimizing part damage or contamination while saving time. The durability and thermal stability of CFC fixtures make them ideal for such demanding applications.
Figure 3. Industrial robots streamline the loading and unloading of components in ECM’s vacuum furnaces and facilitate part transfers between systems, ensuring a fully automated heat treatment line
Since CFC is a highly absorbent material, it can soak up liquids during the cleaning process. Any remaining residue in CFC fixtures can be released during a vacuum heat treatment process, contaminating the oven, which will impact the process and cause improper heat treatment outcomes. Unlike aqueous cleaning, which leaves some liquids behind, solvent cleaning under vacuum conditions effectively removes these absorbed residues.
Additionally, CFC fixtures must be properly dried and moisture-free before entering the vacuum furnace. Moisture can lead to contamination, inefficient carburizing, oxidation, or vacuum system problems. Solvents dry much faster than water, mitigating the risk of water vapor migration into the vacuum carburizing system.
Superior Controllability and Quality Results
Since transitioning from atmospheric to vacuum carburizing, Mercury Marine has experienced many benefits due to a significantly more consistent and repeatable heat treatment process.
It is known that residual oxygen within the furnace atmosphere can react with alloying elements on the component’s surface. This interaction can lead to the formation of an oxidation layer, potentially affecting the compressive stress profile. Such layers need to be ground off. However, with vacuum carburization, these intergranular oxidations (IGO) no longer occur.
The vacuum carburizing process follows a precise “boost and diffuse” cycle, where the presence of carbon is transferred via acetylene. This approach provides superior controllability compared to atmospheric carburizing, where natural gas is used. Additionally, the absence of open flames and the energy-efficient design contribute to reduced greenhouse gas emissions.
In the past, Mercury Marine faced cleaning challenges following oil quenching. While maintaining clean quench oil is essential, frequent oil changes can be costly. When the quench oil was not cleaned frequently enough, deposits adhered to parts, especially drive shafts with spiral oil grooves for passage. Despite attempts at aqueous cleaning, such debris could persist, and additional blasting was needed to remove them.
Vacuum carburizing has eliminated this problem as the parts now undergo gas quenching instead of oil quenching, removing the aqueous cleaning step altogether.
The investment in a new furnace system, along with the integrated closed vacuum solvent cleaning machine, has proven highly beneficial. The fully automated system ensures that technicians are not manually handling baskets, while parts are cleaned to the highest standard, enabling a seamless vacuum carburizing process. Mercury Marine has expressed great satisfaction with the results, recognizing the system as a valuable addition to their manufacturing operations.
About The Author:
Chris Tivnan Sales Manager North America SAFECHEM North America Inc.
With two decades of experience in the chemical industry, Chris assists manufacturers in determining the right choice of cleaning agent and their parts cleaning operation. He also manages relationships with regional distributors as well as local OEMs/OEAs.
Ask the Heat Treat Doctor® has returned to bring sage advice to Heat Treat Today readers and to answer your questions about heat treating, brazing, sintering, and other types of thermal treatments as well as questions on metallurgy, equipment, and process-related issues.
This informative piece was first released in Heat Treat Today’sSeptember 2025 People of Heat Treat print edition.
If you’ve ever experience internal cracking, surface blistering, loss of ductility, or high pressure hydrogen attack, today’s Technical Tuesday might contain just the information you need to avoid it. Read below to learn from Dan Herring as he addresses what hydrogen embrittlement is, how to avoid it, and what solutions should not be pursued in order to fix it.
The other night, The Doctor decided to relax and watch a rather whimsical movie, The Great Race (1965), directed by Blake Edwards, who is perhaps better known for directing Breakfast at Tiffany’s and The Pink Panther. It is most memorable not for the actors, nor the plot, but for the infamous pie fight involving over 4,000 pies in a scene that took more than five days to film but lasted only four minutes on the big screen. Not one actor was spared the embarrassment of being hit by (multiple) pies in the face!
So, what does THIS have to do with heat treatment, you ask? Well, try as he may to believe the subject has been explained well in the past, The Doctor has been inundated recently with questions about hydrogen embrittlement (aka hydrogen-assisted cracking). Let’s learn more.
What Is It?
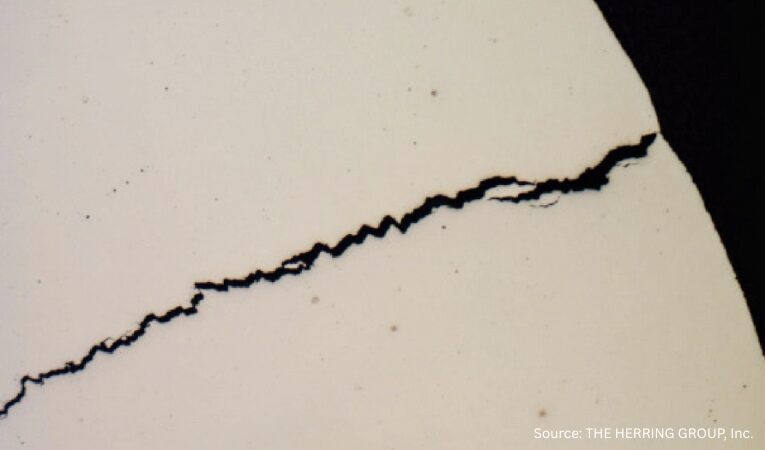
Hydrogen-assisted cracking (HAC) is an embrittlement phenomenon responsible for a surprising number of part cracking issues in heat treatment and is found to be the cause of many delayed field failures, especially if the components undergo secondary operations such as plating (Figure 1).
It is generally agreed that hydrogen in atomic form will enter and diffuse through a metal surface at elevated or ambient temperatures. The simple rule to remember about hydrogen is fast in, slow out. Once absorbed, atomic hydrogen often combines to form molecular hydrogen or other hydrogen molecules (e.g., methane). As these are too large to diffuse through the metal, pressure builds at crystallographic defects (e.g., dislocations and vacancies) and/or discontinuities (e.g., voids, laps/seams, inclusion/matrix interfaces) causing minute cracks to form. Whether this absorbed hydrogen causes immediate cracking or not is a complex interaction of material strength, external stresses, and temperature.
Figure 2. Intergranular fracture of a plated component (SEM image)
Most heat treaters associate hydrogen embrittlement with the plating process and the lack of a proper bake-out cycle. However, there are many other sources of hydrogen, including heat treating atmospheres; breakdown of organic lubricants left on parts; the steelmaking process (e.g., electric arc melting of damp scrap); dissociation of high-pressure hydrogen gas; arc welding (with damp electrodes); grinding (in a wet environment); and the end-use environment.
Parts undergoing electrochemical surface treatments, such as etching, pickling, phosphate coating, corrosion removal, paint stripping, and electroplating, are especially susceptible (Figure 2).
What Is The Nature and Effect of Hydrogen Attack?
Although the precise mechanism(s) is the subject of active investigation (Figure 3), the reality is that components fail due to HAC. It is generally believed that all steels above 30 HRC are vulnerable, as are materials such as copper, titanium and titanium alloys, nickel and nickel alloys, and the like. See Table A below for examples of hydrogen damage and ways to avoid it.
Figure 3a and 3b. Hydrogen embrittlement mechanism models
Since a metallurgical interaction occurs between atomic hydrogen and the atomic structure, the ability of the material to elastically deform or stretch under load is inhibited. Therefore, it becomes “brittle” under applied stress or load. As a result, the metal will break or fracture at a much lower load or stress levels than anticipated by designers. Since failures can be of a delayed nature, hydrogen embrittlement is insidious.
Table A. Problems with hydrogen damage and ways to avoid them
In general, as the strength of the steel goes up, so does its susceptibility to hydrogen embrittlement. High strength steel, such as quenched and tempered steels (e.g., 4140, 4340), or precipitation hardened steels are particularly vulnerable. It is often called the Achilles heel of high strength ferrous steels and alloys.
Nonferrous Materials and Hydrogen Embrittlement
Nonferrous materials are also not immune to attack. Tough-pitch coppers and even oxygen-free coppers are subject to a loss of (tensile) ductility when exposed to reducing atmospheres. Bright annealing in hydrogen bearing furnace atmospheres or torch/furnace brazing are typical processes that can induce embrittlement of these materials.
In copper, the process involves diffusion and subsequent reduction of cuprous oxide (Cu₂O) to produce water vapor and pure copper. An embrittled copper often can be identified by a characteristic surface blistering resulting from expansion of water vapor in voids near the surface. Purchasing oxygen-free copper is no guarantee against the occurrence of hydrogen embrittlement, but the degree of embrittlement will depend on the amount of oxygen present. For example, CDA 101 (oxygen free electronic) allows up to 5 ppm oxygen while CDA 102 (OFHC) permits up to 10 ppm. A simple bend test is often used to detect the presence of hydrogen embrittlement. Metallographic techniques can also be used to look at the near surface and for the presence of voids at grain boundaries.
Are Low Hydrogen Concentrations Also Problematic?
Of concern today is embrittlement from very small quantities of hydrogen where traditional loss-of-ductility bend tests cannot detect the condition. This atomic level embrittlement manifests itself at levels as low as 10 ppm of hydrogen — in certain plating applications it has been reported that 1 ppm of hydrogen is problematic! Although difficult to comprehend, numerous documented cases of embrittlement failures with hydrogen levels this low are known.
This type of embrittlement occurs when hydrogen is concentrated or absorbed in certain areas of metallurgical instability. This concentrating action occurs via either residual or applied stress, which tends to “sweep” through the atomic structure, moving the infiltrated hydrogen atoms along with it. These concentrated areas of atomic hydrogen can coalesce into molecular type hydrogen, resulting in the formation of high localized partial pressures of the actual gas.
How Does Hydrogen Get Out?
Hydrogen absorption need not be a permanent condition. If cracking does not occur and the environmental conditions are changed so that no hydrogen is generated on the surface of the metal, the hydrogen can re-diffuse out of the steel, and ductility is restored. Performing an embrittlement relief cycle, or hydrogen bake-out cycle (the term “bake-out” is misleading as the process involves both inward diffusion and outgassing), is a powerful method in eliminating hydrogen before damage can occur. Key variables are temperature, time at temperature, and concentration gradient (atom movement).
Contact us with your Reader Feedback!
Electroplating, for example, provides a source of hydrogen during the cleaning and pickling cycles, but by far the most significant source is cathodic inefficiency. To eliminate concerns, bake-out cycles and recommended temperatures/times are shown in ASTM B850-98 (latest revision) as a function of steel tensile strength (see Table 1 of the specification). However, in this writer’s eyes, a “bake-out” cycle of at least 24 hours at temperature is required for the effective elimination of hydrogen as a concern regardless of the tensile strength of the material. Also, caution should be exhibited to prevent over-tempering or softening of the steel, especially on a carburized, or induction hardened part.
Next time we will talk about quench and temper embrittlement, as well as embrittlement due to overheating during forging, all of which are often mistaken for hydrogen embrittlement.
References
ASTM International. 2022. ASTM B850-98 (Reapproved 2022), Standard Guide for Treatments of Steel for Reducing the Risk of Hydrogen Embrittlement. West Conshohocken, PA: ASTM International. https://www.astm.org.
Herring, D. H. 2004. “A Heat Treater’s Guide to Hydrogen Embrittlement.” Industrial Heating, October.
Herring, D. H. 2006. “The Embrittlement Phenomena in Hardened & Tempered Steels.” Industrial Heating, October.
Herring, D. H. 2014–2015. Atmosphere Heat Treatment, Volumes I & II. Troy, MI: BNP Media.
Krause, George. 2005. Steels: Processing, Structure, and Performance. Materials Park, OH: ASM International.
About the Author
Dan Herring “The Heat Treat Doctor” The HERRING GROUP, Inc.
Dan Herring has been in the industry for over 50 years and has gained vast experience in fields that include materials science, engineering, metallurgy, new product research, and many other areas. He is the author of six books and over 700 technical articles.
The Heat Treat Doctor® has returned to offer sage advice to Heat Treat Today readers and to answer your questions about heat treating, brazing, sintering, and other types of thermal treatments as well as questions on metallurgy, equipment, and process-related issues.
This informative piece was first released in Heat Treat Today’sAugust 2025 Automotive Heat Treating print edition.
Quench cracking during heat treatment can turn expensive components into scrap metal in seconds. In today’s Technical Tuesday article, Dan Herring (The Heat Treat Doctor®) explores more about the underlying mechanisms and proper preventative measures to save you time, money, and ensure reliable part performance.
As a young heat treater, I learned first-hand about quench cracking while running various dies for our tool and die shop — and succeeded in cracking all of them! I have never forgotten the foreman’s (rather animated) critique of my heat treating abilities. Quench cracking can be a significant problem for heat treaters, its potential consequences ranging from costly rework to premature failure in the field. Let’s learn more.
We must not only understand the mechanisms involved but also take proactive steps to avoid it. This includes careful consideration of such items as:
Material (e.g., chemistry, hardenability, form, mill processing)
Component part design (e.g., sharp radii, thin and thick sections next to one another)
Manufacturing processing steps (e.g., the effect of stress relief after rough machining)
Part loading (e.g., part orientation in relation to the quench, fixturing, total load weight)
Equipment choice (i.e., limitations and capabilities)
Quench medium (e.g., type, agitation, flow characteristics, temperature, temperature rise)
Process parameters (e.g., ramp rates, atmospheres, vacuum levels)
The Heat Treatment Challenge
Quench cracking primarily occurs during the hardening process, typically when materials are rapidly cooled via quenching. Since the cooling process introduces internal stresses within the material, it can result in crack formation. These stresses are a result of the rapid transformation of the material’s microstructure, most notably when transforming to martensite, a very hard, brittle structure.
Figure 1. Quench crack in a 4140 axle shaft
Mechanisms Involved
Failure mechanisms related to quench cracking include the following seven factors.
Material Imperfections
As material is heated, thermally induced stresses can cause existing surface or subsurface defects, such as inclusions, laps, and seams. These defects act as stress risers to open and propagate into cracks. Once a defect reaches “critical flaw size” — the smallest flaw that can lead to failure under expected operational stress levels — crack propagation will begin and lead to part failure.
Rapid or uneven heating only exacerbates this issue, especially when a material undergoes phase transformations that introduce volumetric changes.
Stress Risers
Sharp corners, steep edges around holes, and even grooves in parts create stress concentration points where quench cracking is most likely to occur. These features also result in localized heating and cooling, causing differential stresses that can initiate cracks.
The sharp edges of a part, for instance, cool much faster than the rest of the material, leading to a high risk of cracking.
Proper design modifications, such as adding radii to sharp corners, can reduce the likelihood of stress concentrations.
Rapid Cooling and Phase Transformation
The transformation from austenite to martensite during quenching is a key contributor to internal stresses. The rate at which the material cools can greatly influence these stresses. If cooling is too rapid or if tempering is delayed, the material can become overly brittle, leading to quench cracking.
Improper Heating and Overheating
Overheating during the austenitizing process can lead to coarse-grained structures that are more prone to quench cracking. Coarse grains increase the depth of hardening but reduce the material’s resistance to cracking. It is critical to avoid temperature overshoot, high ramp rates, and excessively long dwell times when heating.
Inadequate Quenching Methods
The choice of quench medium (brine, water, oil, polymer, high pressure gas, etc.) can also contribute to quench cracking. Overly aggressive quenchants may create excessive thermal stresses.
Improper Fixturing
The way parts are positioned during quenching can create problems. If parts are bunched together in a basket, uneven cooling rates will occur, with parts on the edges cooling faster than those in the center. This can lead to differential stresses and increase the risk of cracking.
Delays Between Quenching and Tempering
Quenching produces high residual stresses in the material, and if parts are not tempered soon after quenching, these stresses can lead to cracking. For materials with high hardenability, such as 4340 steel, immediate tempering (usually within 15 minutes of quenching) is critical to prevent in-service failure.
Understanding Fracture Mechanics
Contact us with your Reader Feedback!
Understanding these mechanisms is critically important. A material’s fracture toughness, which is the ability to resist crack growth, is defined by the stress intensity factor (KIC). This value varies based on the material’s properties and the size and geometry of the crack. The important point to remember is that when the applied stress reaches a critical threshold, cracks begin to propagate (literally at the speed of sound), leading to catastrophic failure.
Digging a bit deeper, there are three primary modes of fracture:
Tensile (Mode I): Fracture caused by tensile stress at the crack tip.
Sliding (Mode II): Fracture caused by shear stress that causes the two sides of the crack to slide.
Tearing (Mode III): Fracture caused by shear forces in a direction perpendicular to the crack plane.
Preventive Measures
Several strategies can be employed to minimize the risk of quench cracking during heat treatment. They broadly fall into the following categories.
Material Selection
Choosing the right material for the job is essential. Many designers select materials with high hardenability, forgetting that they can be prone to cracking. Additionally, one should take special care with materials that have high carbon content or are heavily alloyed.
Design Considerations
Ensure that part designs minimize stress risers. Avoid sharp corners and incorporate radii where necessary. Proper design can reduce the likelihood of cracks forming at critical locations.
Improved Manufacturing Practices
Proper stock removal during machining and addressing surface imperfections before heat treatment can prevent the initiation of cracks. Machining should aim to eliminate any seams or inclusions that might act as nucleation sites for cracks. Stress relief after rough machining is almost always a good idea.
Control of Heat Treatment Parameters
Maintain tight control over the heating and quenching processes to ensure uniformity. Avoid overheating and try to ensure that the part enters the quench medium in the best possible orientation to reduce the likelihood of creating differential cooling rates.
Figure 2. Quench crack due to a combination of rapid heating, overheating and improper
polymer quench medium concentration in a motor shaft (50x, as polished)
Quenching Media
Select the appropriate quenching medium based on the material, part geometry, and load. Less aggressive quenchants or minimizing time in the quench should be considered for materials with moderate to high hardenability.
Post-Quench Tempering
Temper parts as soon as practical after quenching to avoid concerns with internal stresses. High-hardness materials should be tempered immediately to prevent quench cracking.
Quench Cracking in Other Materials
Quench cracking is not exclusive to steel. Other materials, such as nickel and cobalt superalloys, can also experience cracking due to similar mechanisms. In these materials, the phenomena are often referred to as “fire cracking,” “strain-age cracking,” or “stress cracking.” As with steel, cracks in these materials are often linked to high residual tensile stresses on the surface and the presence of stress raisers. Strategies, such as shot peening, redesigning part geometries, and improving surface finishes, can help mitigate cracking in superalloys.
Summing Up
Quench cracking represents a significant challenge in heat treatment, but by understanding its underlying mechanisms, heat treaters and engineers can take steps to mitigate the risk. Material selection, part design, proper heat treatment procedures, and timely tempering are all critical factors in preventing quench cracking and ensuring the integrity of components. A proactive approach to addressing flaws and stress concentrators combined with careful attention to detail in every stage of the manufacturing and heat treatment process can greatly reduce the likelihood of failure and contribute to the long-term success of heat treated products.
References
Herring, Daniel H. 2012. “Quench Cracking.” Industrial Heating, April.
Herring, Daniel H. 2015. Atmosphere Heat Treatment, Volume 2. BNP Media.
Johnson, D. D. 2005. “Thermal and Mechanical Behavior of Materials.” University of Illinois.
Klarstrom, Dwaine L. 1996. “Heat Treat Cracking of Superalloys.” Advanced Materials and Processes, April.
Krauss, George. 2005. Steels: Processing, Structure and Performance. ASM International.
About the Author
Dan Herring “The Heat Treat Doctor” The HERRING GROUP, Inc.
Dan Herring has been in the industry for over 50 years and has gained vast experience in fields that include materials science, engineering, metallurgy, new product research, and many other areas. He is the author of six books and over 700 technical articles.
If you are one of many heat treat professionals watching AM take over the industrial world with bated breath, it may be time to stop watching and start doing. This article highlights the rapid rise of AM and how changes in your heat treat operations may be needed.
This informative piece was first released inHeat Treat Today’sAugust 2025 Automotive Heat Treating print edition.
For manufacturers who produce customized or complex parts and components for the medical, aerospace, automotive, and other industries, additive manufacturing (AM) with metals has the potential to bring innovation and agility to the process.
However, because AM is a somewhat nascent technology, there are still challenges to address before it is widely accepted throughout the manufacturing industry. Fortunately, as research and development continue, the aerospace and automotive industries are beginning to acknowledge that parts made via AM are robust enough for use in safety-critical applications. Manufacturers who want to use AM to gain a competitive edge are advised to zero-in on the most suitable method for metals and determine in which applications AM presents an economically viable solution.
The Additive Manufacturing Market
AM, also known as 3D printing, is the process of creating an object based on a digital file, such as a computer-aided design (CAD) or one created with a laser scanner. Unlike traditional manufacturing methods that often involve cutting or subtracting material from a solid block (like machining), AM involves building up thin layers of material — usually metal, ceramic, or plastic — one by one using a 3D printer.
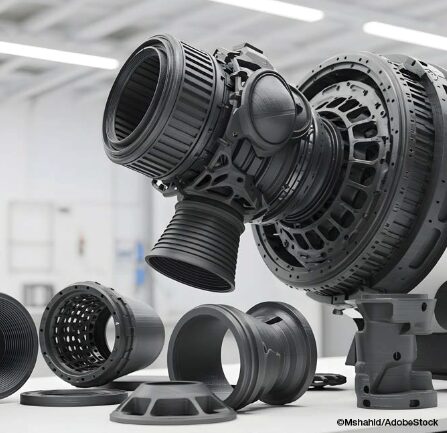
AI-generated image of 3D-printed turbine engine components
AM is increasingly transforming the manufacturing industry, enabling faster prototyping, customized production, lightweight parts, and complex shapes and geometries that would be impossible to manufacture using conventional casting, machining, or subtractive techniques, such as milling, grinding, carving or shaping.
For product design, prototyping, and reverse engineering applications, AM allows designers to rapidly print parts as a single piece, reducing material waste, saving time, and reducing costs, all while getting new products to market faster. Although the same advantages apply to traditional manufacturing applications, manufacturers have not been as quick to adopt the technology.
Still, the AM industry is seeing growth. A recent report from Grand View Research states that the global AM market size was valued at over $20 billion in 2023 and is expected to grow at a CAGR of 23.3% from 2023 to 2030, with unit shipments of 3D printers expected to reach 21.5 million units by 2030 thanks to a growing demand for prototyping applications in the healthcare, automotive, aerospace, and defense industries. The report also acknowledges that rigorous R&D in 3D printing will further contribute to growth.
Additive Manufacturing Techniques for Metals
Currently, three primary techniques are used for AM with metals: laser powder bed fusion (LPBF), directed energy deposition (DED), and binder jetting.
LPBF
LPBF technologies, including direct metal laser sintering, selective laser sintering, and direct metal printing, use a laser to sinter or fuse powdered metal particles until a complete part if formed. LPBF processes typically include heating the bed of powdered metal to a consistent temperature. The printer begins applying the first layer over a build plate, fuses the powder particles together with a high-powered laser, and then continues the process layer-by-layer until the part is finished.
After the part is printed using LPBF, it is removed from the powder bed, cut away from the build plate, heat treated to prevent internal stresses, and finally machined or polished to achieve the desired surface finish.
LPBF is limited by the size of the print bed, so it is not suitable for manufacturing large components or parts.
DED
DED using powdered metals also relies on a laser to produce metal parts. However, rather than spreading powder on a bed, the DED machine blows powdered metal out of the print head and uses a laser to fuse the part during construction.
DED-manufactured parts require post-processing heat treatment and machining steps. And while DED is a faster process than LPBF, there are a limited number of materials that can be used in the DED process, and the technique still needs more research and development before it sees widespread commercial use.
Binder Jetting
Binder jetting deposits a layer of loose metal followed by a layer of binder material layer by layer to create the product. During the process, a binder jetting machine distributes metal powder over the print bed to form an unbound layer. A jetting head then spreads a binder to adhere the powder. The machine continues to spread alternate layers of building material and binder to form a complete product. Sintering is generally required after printing to remove the binder, resulting in a part that is composed entirely of metal.
While binder jetting is a fast process and offers the opportunity to create and sinter parts in batches, it is currently a more expensive option. However, research and development into this technology, the availability of binder jets from companies (e.g., Markforged and HP), and the potential to use binder jetting for high-volume batch production may eventually make binder jetting the technology of choice for metal AM.
Post-Processing Heat Treatment for AM Parts
No matter the print technique, some AM-printed metal parts will require post-process heat treatment in which the printed part is subjected to specific temperatures and durations and then cooled to enhance or customize the properties of the metal material and optimize performance and reliability of the part.
Applying controlled heating and cooling cycles during post-printing heat treatment eliminates internal stresses created during the AM process to prevent distortion, cracking, and warping that would negatively impact part performance and reliability. Heat treating can also be used to increase hardness, density, strength, and fatigue resistance to optimize performance of the part. Furthermore, heat treating can be applied to customize the mechanical properties of the final part and provide specific characteristics so that it performs reliably in the intended application.
The type of heat treatment used following AM will depend upon the printing technique, metal material, and desired characteristics and properties. Annealing, sintering, normalizing, quenching, and tempering are commonly used. Hot isostatic pressing (HIP) — another post-process option that is used to reduce porosity and improve the density, performance, and reliability of AM-printed parts — will be specifically addressed in a subsequent article release.
Greater Acceptance in Industry Sectors
Metal alloy 3-D printed components
While AM has been widely used for prototyping and reverse engineering, adoption of the technology has been slower for the manufacture of finished parts and components. Stephen Feldbauer, director of Research and Development, with Abbott Furnace Co., suggests that the right approach to AM with metals depends upon the ability of manufacturers to refine their application. “Manufacturers should not take the ‘shotgun’ approach of ‘I can print anything,’” comments Feldbauer. “Instead, they should focus on what makes the most sense for them and specialize in those parts rather than just printing something because it’s possible.
However, because it provides significant benefits, AM does have application in the several manufacturing sectors. Advantages in using AM to produce parts include minimization of waste, time and cost efficiency, and the ability to customize parts for single-use applications or low-volume production runs.
Thanks to these benefits, AM is currently being used in the following industries:
Aerospace: functional parts, such as engine turbine blades and fuel systems
Automotive: various components, such as suspension systems, engine parts, and door panels
Defense: obsolete parts, as well as vehicle and weapon components
Medical: implants, prosthetics, and other apparatuses
And, as AM technology continues to expand, it is becoming more widely accepted and is most notably being employed to create safety-critical aerospace and automobile parts. For example, General Motors (GM) announced that it is using AM-printed seatbelt pillar adjustable guide loops in its all-electric Cadillac Celestiq, making them GM’s first safety-related AM-printed metal part.
The component is made by Azoth using Markforged metal binder jetting technology with a liquid binding agent. Following the process, the metal parts are then sintered, polished, and plated. Automotive sector acceptance of additive manufactured safety-critical parts is a tremendous boon for the AM industry.
Experts like Feldbauer see the need for manufacturers to make a few key decisions for this technology to become a reality. “For additive manufacturing to be a commercially viable solution,” he argues, “manufacturers must determine which parts they can 3D print with high levels of success and where printing is cost effective and profitable. Commercial viability is really the determining factor as to whether a part should be 3D printed or made using conventional manufacturing techniques.”
Currently, though, AM seems to be benefiting smaller jobs. According to Feldbauer, AM usually makes the most sense for small runs where there is a need for customized tooling; in these cases, manufacturers run into too complex of shapes or simply to time or cost intensive.
The Future of AM
While AM is increasingly accepted as a beneficial process across many industries, it still faces challenges affecting its usage more broadly, such as material restrictions, bed or plate sizes for techniques that rely on bed printing, and the need to purchase high-end printers from a market that is constantly consolidating. Research and development into the process, more diversity in technologies, increased availability of AM outsourcing companies, and the benefits associated with cost, time, and material reductions are expected to be a driving force in widespread commercial adoption.
Stephen Feldbauer, director of Research and Development with Abbott Furnace Co., updated Heat Treat Today on the state of AM in 2025
As the technology continues to mature, AM will continue to expand into industries where the availability of high-volume AM production, such as is possible with binder jetting, would reduce the cost of part manufacturing. Additionally, optimizing post-process heat treatment methods will help further enhance the cost effectiveness of AM with metals and enable more customized characteristics. These advances could make AM an attractive and economical option for manufacturers, so those who want a competitive edge should begin to focus and refine application of AM to the parts for which it will be most worthwhile.
References
Grand View Research. 2022. Additive Manufacturing Market Size, Share & Trends Analysis Report by Component, by Printer Type, by Technology, by Software, by Application, by Vertical, by Material, by Region, and Segment Forecasts, 2024 – 2030. April 2022. Grandview Research. Report ID: GVR-4-68039-922-9. https://www.grandviewresearch.com/industry-analysis/additive-manufacturing-market#
Check out our AM/3D Trivia to test your knowledge of the AM/3D industry, the processes, and the technology.
This editorial was written by the Heat Treat TodayEditorial Team.
Helium leak detection is critical to ensure system integrity, product quality, and operational efficiency in vacuum processing. With 36 years of hands-on experience, Dave Deiwert of Tracer Gas Technologies joins host Doug Glenn on the most recent episode of Heat Treat Radioto share a wealth of knowledge on the evolution of leak detection technology, practical maintenance, and best practices for leak testing.
Listeners will gain practical insights into the best leak detection practices and how to troubleshoot challenges.
Below, you can watch the video, listen to the podcast by clicking on the audio play button, or read an edited transcript.
The following transcript has been edited for your reading enjoyment.
Introduction
Doug Glenn: Helium leak detection has come a long way, but not everyone has a brand new piece of equipment. So let’s talk about some of the shortcomings of older equipment and some of the improvements that you’re seeing.
Dave Deiwert: When I started in 1989, leak detectors pretty much had what were called oil diffusion pumps as the high vacuum pump. That’s the pump that creates the vacuum for the analyzer cell or mass spectrometer so they can separate helium from other gases. These diffusion leak detectors did not like to be shut down improperly or have power outages quite frequently.
You would hear stories of somebody that turned the power off of a leak detector without a proper shutdown or a power outage, and that could cause an oily mess from the diffusion pump, and maybe even crack the oil. So, you would end up having quite a maintenance event required on the leak detector before you could use it again.
In fact, these kinds of problems happened so frequently that in my young sales days when turbopump leak detectors first were introduced, as I would go in to show it to a potential client, one of the first questions was, “What happens if you have a power outage?”
I would have a little fun with that.
I’d say, “Well, let’s find out.” And I would pull the plug out of the wall, and they would say, “Oh, you can do that?” And of course you could. A turbo pump would just coast down towards a stop. Then we turn the power back on, and it’s back up.
Part of what compounded this problem with the diffusion pump is that it works by heating oil to jet mist oil vapor that goes to the top, and it’s condensed and directed back down. When power is lost, whether you turn the power off with an improper shutdown or a power outage, that pump is still hot for quite a while. It’s still trying to pump, and the backing pump, whether it’s a diffusion pump or a turbopump, is typically a rotary vane pump. With a power outage or power stop, those pumps will come to a stop very quickly. But those diffusion pumps and turbo pumps are not designed to exhaust atmosphere, so the backing pump or rotary pump comes to a stop pretty quickly, and now you have atmosphere potential on the exhaust of the diffusion pump.
The turbopump survives that much more nicely than a diffusion pump does. So the first major upgrade in the technology across the board with all the manufacturers was moving away from diffusion pumps to turbo pumps. If you buy a new leak detector from the ‘90s to today, it will very likely have a turbo pump no matter whom you buy it from and even if you buy a used one.
Size and Portability of Leak Detectors (00:06:09)
Doug Glenn: How large were these original pieces of equipment? Did you have to wheel them around?
Dave Deiwert: The very first ones I worked with predominantly would be the size of a washer/dryer. They would typically have casters on so you can roll them around.
They took up more space and certainly took up a lot more energy. You could sometimes find what they would call portable leak detectors, but they would still have diffusion pumps in them, and they’d have less features because of how small they were versus the console leak detectors.
Doug Glenn: So now nowadays they use helium leak detectors.
Dave Deiwert: Most everybody’s gotten away from console leak detectors. You can find a couple companies that have a fairly large rolls-on-caster leak detector that still has turbo pumps, and higher performing backing/ruffing pumps. But the majority of leak detectors you’re going to find are more portable and smaller in size.
Doug Glenn: Are they close in size to a briefcase?
Dave Deiwert: They average 12 to 18 inches wide by 10 to 12 inches deep and 12 to 14 inches tall, approximately. So, much smaller than a washer/dryer.
Quite frequently, these leak detectors may be sold with a cart so that you don’t have to carry them from point A to point B. It can be a little laborious to still carry them. They weigh 40 lbs or more. So quite often, the first accessory purchased with the leak detector is a cart to roll it around.
Doug Glenn: So it’s a heavy piece of carry-on luggage essentially.
Dave Deiwert: Absolutely.
Maintenance: Old vs. New Leak Detectors (00:06:37)
Evaluating a vacuum furnace for leaks
Doug Glenn: How would you compare the maintenance of those older units, assuming that you don’t lose power, versus maintenance of the newer units.
Dave Deiwert: A stereotypical experience from my field service days would be if you’re running a diffusion pump leak detector in a production environment, using it every day, then most likely you’re going to do what I call an overhaul of the leak detector. During this overhaul, you’re going to change your oils, change the filaments in the mass spectrometer, put on new valve seats, and clean the manifold.
Not everybody will do this. There are those that might go a year or two, especially if the leak detector is purely for troubleshooting, like if you have only a few furnaces. The leak detector may sit against the wall, and then you go get out to leak test a furnace. They may well get a couple of years of use out of a leak detector before needing to do any preventative maintenance or even a major overhaul.
With the new turbopump leak detectors, I think all the manufacturers now have models that most likely you’ll go multiple years without really doing anything other than changing oil in the backing pump, which you might do a couple times a year or so, keep an eye on the oil level, much more maintenance friendly and easier to do the troubleshooting and the service to it.
Filament Technology Improvements (00:08:10)
Dave Deiwert: The next major upgrade in the leak detectors across the industry was the filament design.
The old diffusion pump leak detectors predominantly had tungsten filaments, which, if you’ve ever cracked or seen a cracked light bulb that had a tungsten element in it, you know that immediately you lose the function of the light bulb. And the same thing with the filaments that are tungsten in a mass spectrometer. If it gets a pressure burst, which is what I call the event when somebody disconnects the test port from the vacuum furnace while the leak detector is still in test, that allows a pressure burst into the leak detector and tungsten filament, and most likely you will burn out the filament. As a result, you will have a maintenance event for that.
As a rule of thumb, you will get 1,000 to 2,000 hours out of an old leak detector with tungsten filaments, but you’re going to get many thousands of hours out of a Yttria coated-iridium, which I think is used across the board in the industry today. In the case of
several years even, it greatly reduces your cost of ownership with the newer leak detectors.
Performance and Cost Comparison (00:09:12)
Doug Glenn: Are there any other major differences between the old units and the new units?
Dave Deiwert: There are some extra benefits from the upgrades that we’ve talked about. The turbopumps will allow, at least modern leak detectors, us to test at a higher pressure (or less vacuum). You press “Start Leak Detector.” The test port pressure pumps down to some vacuum level. For diffusion pump leak detectors, they had to get down to typically less than 50 mTorr. Depending on the model, definitely significantly lower vacuum than the turbopump leak detectors. So, the turbopump ones with the gross leak testing capabilities, you’re probably looking at 18 to 20 torr. I think a couple of manufacturers claim they can get in the test pretty much right below atmosphere and start looking for very massive leaks.
The capabilities going to turbopump and Yttria-coated filaments has allowed manufacturers to greatly improve the performance and the robustness and reliability of the leak detectors.
Doug Glenn: In terms of cost comparison, are newer units more or less expensive than older units?
Weighing the costs and comparisons of different units
Dave Deiwert: When buying a leak detector in 1889 to early ‘90s, you’re probably looking at the low to mid-20s in price. You’re going to find they are a little higher than that now. With the market and inflation, you’re probably looking at upper 20s to low 30s for the most typical leak detectors that are purchased for the vacuum furnace industry. You can find some that are maybe two or three times that amount, but those are not needed for the industries that we’re talking about today.
Troubleshooting and Service Efficiency (00:11:00)
Dave Deiwert: If the client, their suppliers, or people who work on the leak detectors from time to time service a diffusion pump leak detector, they may want to explore an idea to troubleshoot a problem. They may not be sure what the problem is yet.
First, you’re going to do a proper shutdown of the diffusion pump leak detector to protect the oil in the diffusion pump and the cleanliness of the leak detector. You may wait a good part of an hour for that diffusion pump to cool off before you can try the troubleshooting solution you’re going to investigate. Then you’re going to wait for another good hour for it to heat back up and be ready to confirm if what you have tried to do was successful.
With a turbopump leak detector, you turn a switch off to turn the power off, and within minutes you can test out the solution on the leak detector. So you greatly expedite your troubleshooting time.
What might have been almost always a full day event of troubleshooting and servicing a diffusion leak detector turns into less than a half day, possibly even an hour or two.
In every category, the newer leak detectors are very attractive. If clients or our viewers reach out to their suppliers or potential suppliers, there will most likely be some trade-in value for your old leak detector, which will also help offset the pain and suffering of spending money on a new leak detector.
Doug Glenn: Hopefully they’ll come pick it up, too.
Where to Connect Leak Detectors on Furnaces (00:14:11)
Doug Glenn: In your column, you talk about how there’s some debate amongst users on where to hook up the leak detector on the furnace. Can you walk us through that a bit?
Dave Deiwert: I run into people who are very adamant that you hook up the leak detector in one of three places. And I’ve told salespeople that while we have our preferred location of where to hook to the leak detector, we should never visit a client and tell them they are doing it all wrong. As a field service engineer, I’ve confirmed that you can connect the leak detector at three most prominent locations, but the question is where is the most optimum place to connect it?
Leak testing a vacuum furnace
The first place is hooking the leak detector directly up to the furnace chamber, because that’s where they imagine the leaks might be. The next two locations might look like close cousins because they’re both in the series flow away from the chamber, through the pumps and out to the exhaust.
My preferred location is to connect it between the blower and the chamber. Or, if there’s
a diffusion pump, I would connect it between the blower and the diffusion pump.
The last place that you might see somebody connect it is between the blower and the backing pump or a roughing pump. They might do this to use the blower almost like a turbocharger to improve the signal to the leak detector. The disadvantage of doing that is most likely these vacuum pumps are very dirty single-stage roughing pumps. There are two concerns I have with this. One is the back stream of oil or hydrocarbons from that pump to the leak detector. And the second is the potential for back streaming, even of helium from the ballast port of the pump or the exhaust, depending on where the exhaust is terminated. If somebody exhausts the pump directly out of the building, then that’s not so much a concern. But if you connect it between the blower and the diffusion pump or the blower and the chamber, then you’re allowing the roots blower to be like an optically dense filter between the leak detector and that backing pump.
And for the two concerns that I mentioned earlier about either back streaming of helium from the leak testing or back streaming hydrocarbons from the vacuum/roughing pump, the optimal location would be to hook it up between the blower and the chamber, or if it’s a diffusion pump, between the blower and the diffusion pump. If you’re hooking it up between the diffusion pump and the roughing pump, you need to make sure that you pump down to your base pressure before you open up the valve from the leak detector to that point. You don’t want to potentially suck any diffusion pump oil into the into the leak detector.
Furnace Connection Points and Hardware (00:15:50)
Doug Glenn: Is there a feed through meant for leak detection built into the furnace, between the blower and the diffusion pump or roughing pump or on the chamber?
Dave Deiwert: There is almost always a connection point where I describe my preferred location, especially with furnaces manufactured in the last twenty years. On new furnaces sold today, it’ll be an NW25 flange, which will match up directly to the leak detector.
With the leak detectors in this industry, we’ll have an NW25 flange, which is a standard vacuum connection. You run a bellows hose from that leak detector to that point on the furnace.
I like to see a manual ball valve that’s always on the furnace at that point. You can put a blank cap on the exposed port on that valve, which can act like a dust cap. It’s always there. This facilitates doing a PM leak check, which we might talk a little bit more about later.
Now, sometimes you may go to hook it up between the blower and the furnace or the blower and the diffusion pump and there’s no connection there.
I’ve seen that, so you have to work with what you’re given. You might well see there’s a port between the blower and the backing roughing pump,
and you can use that. It’s just not the optimal place to put it.
If you put the leak detector directly on the chamber, typically there’s a small port that you can hook up to, now you’re going to be competing in what we call molecular flow with a much larger opening going to the blower. The lion’s share of helium is going to go out that large target to the blower, and you’re not going to get as much helium signal to the leak detector. So, putting the leak detector port basically right into the end of the flow, going to the blower lets you sample the flow going in that direction.
Doug Glenn: Right, which is going to be the bulk of it.
Dave Deiwert: Yes, and you’ll find a faster response time and faster cleanup and recovery of the leak rate signal when you stop spraying the helium by putting it in that location.
PM Leak Checks During Furnace Operation (00:18:05)
Doug Glenn: You briefly discussed conducting PM in the column. Can you walk us through conducting a PM leak check during a live operation of the furnace.
Dave Deiwert: First off, when you’re going to do a preventative maintenance (PM) leak check on the furnace, there are two scenarios. In the first scenario, you’re not running the furnace today. So, you roll the leak detector up and you look for leaks that you may not know are there when they’re smaller and less noticeable, so you can either mark them or repair them at your convenience before they get to be larger and more noticeable, maybe affecting quality of your process.
The second scenario is that you have a very long process. You might have enough time to do a leak check while the furnace is in process. Helium is an inert gas. If you pull a vacuum on your furnace to do some heat treating, and it’s going to be in that vacuum level for an hour or more, this may be plenty of time to do some leak testing. We definitely don’t want to compromise quality. But again, helium is an inert gas, and if you have an experienced person doing this PM leak check in an orderly fashion, it can be done safely.
Basically, you roll the leak detector up to that closed ball valve, and you would have to have the ball valve in place there if you’re doing this during a live process. So you connect the hose from the test part to this closed ball valve. You start the leak detector and put it in test. I suggest that after you put it in test, you ensure you have a good vacuum test level vacuum from the leak detector to the closed valve.
Because we don’t know initially if the vacuum level is different on the other side of the valve,
Heat Treat Radio #123 Host Doug Glenn and Dave Deiwert
I recommend momentarily stopping the test of the leak detector. I think all modern leak detectors have a standby mode so you’re not venting the test for a leak detector. You put it in standby, then you open the ball valve, and the leak detector computer can now see if the vacuum level changed to maybe potentially a level a little higher than what it wants to be at. That allows it to tell itself to pull some more vacuum along with the furnace before we actually open the test valve to the analyzer cell or the mass spectrometer.
If you’re in test, you open the ball valve, and somebody forgets that step, there can be a little vacuum differential and you may shock the leak detector and throw it out of test. This doesn’t hurt the leak detector. You just have to go and press test again. But by putting it into standby and then opening the ball valve, then putting it back into test, this saves you a step.
Once you put it into test, the next thing you’re going to make a note of is the background level of helium before you start spraying helium. I’m a big fan of people who leak test their furnace, or really anything no matter what market is, and take care of their furnaces purposefully.
If you don’t suspect any leaks or it’s a brand new furnace, you can hook your leak detector up and you put it in test, and before you spray any helium, make note of what I call the background helium signal. This is a result of any natural helium that’s in the furnace. There is five parts per million helium in the air we breathe. There’s going to be helium in the furnace, and take note of what that is.
Let’s say you notice you have two times ten minus nine background of helium on the display of the leak detector, and you haven’t sprayed any helium, you can make note of that.
So now you know you’re going to be looking for leaks for some delta change increase of that value. From there, it’s playing the hot and cold game as you pinpoint where the leak isas you spray helium.
You can do this potentially while a furnace is in process. You certainly want everybody to know what you’re doing and have an opportunity to discuss this because it could make people nervous, especially the quality manager or even the production manager. It’s something that should be talked about with the whole team to ensure everybody sees the value in it.
So we spray helium and make a note of anything we see. Next time we have an opportunity, when no production is going on, we can fix that leak at our convenience rather than wait until it might get worse.
Doug Glenn: Certainly we would want to consider whether that should be done with high-value items in the furnace.
Dave Deiwert: Yes, unless everybody is on board and understands, and you’re doing things purposely.
If you are doing a PM leak check on a sensitive process and quality of a product and you’re done testing, that manual ball valve needs to be closed before you do anything else to the leak detector. If you forget, and you press vent on the leak detector, it’s going to try to vent that whole furnace through the little vent valve of the leak detector, and that’s not going to be good.
This whole discussion point is that everybody on the team would need to buy into this idea and be very clear about what we’re going to do, how we’re going to do it.
I’m just suggesting it’s something that can be done, and if you confirm it works for you, it has value. It’s just another option for somebody to optimize the way they take care of their furnace.
Confirming Leak Location Before Repair (00:23:38)
Doug Glenn: When you’re isolating a leak, how important is it to assume or not assume that you found the leak once you get a reading on the on the meter?
Dave Deiwert: I spend a lot of time on this topic in every class that I teach because nothing is more frustrating than thinking you have found the leak when you haven’t.
Let’s say you think have found the leak on some big 10-inch gate valve. Maybe it’s too heavy for one person you have to have someone to help you take this gate valve off the system. Once you take the gate valve off the system, you put a repair kit in there, clean everything, you put it back on the furnace, and everything’s assembled. You start to furnace back up and you do a leak check and realize you still have the same leak you thought you fixed. There may be other flanges you need to check, which might require more help.
You absolutely, beyond the shadow of doubt, can know that you have found the leak because every time helium is sprayed at that place where you think the leak is, you should get the same response, same response time, same peak leak rate.
If I spray the helium at point A, where I think the leak is at, and I stop spraying, I wait for the leak rate to go back to baseline, then I go back to spray it again. The more work that is involved, the more I’m going to want to duplicate that response and make sure that is where the leak is at.
Last thing you can do, just to be sure, is what I call the “x, y, z axis.” Try to spray helium left, right, up, down, back and forth, just to make sure you’re not getting a better response to something else nearby.
Doug Glenn: By better response, do you mean a higher measurement of helium that comes through or comes through more quickly?
Dave Deiwert: That’s correct. Now, you might have the problem where there are 2, 3, or 4 connections right in the same general area, and it’s difficult to pinpoint where I’m getting I think the same response, no matter where I’m spraying the helium. To remedy this, you can put a barrier between two fittings. This barrier could be plastic, tape, putty, your hand. Try to put some barrier between the two connections so when you spray on one side now, you’re not really getting the same response you were before and can pinpoint the location of the leak more accurately.
This is an important step before you repair or remove something. If you remove a NW25 flange and you’re wrong, there’s not a lot of pain and suffering. But I guarantee you 100%, you can prove to yourself with some patience and some diligence where the leak is before you do the work of disassembly and service.
Doug Glenn: It is better to invest a little time in detection than to repair something that doesn’t need to be repaired or find out later that you fixed the wrong piece.
Dave Deiwert: Absolutely.
Repair vs. Replace: Leak Source Components (00:26:44)
Doug Glenn: Once you do find the leak and it’s through some sort of a device, whether it’s a feed through or a control or a valve, how do you decide whether to repair that item or replace it?
Discerning when to repair or replace
Dave Deiwert: If the device is something that you can disassemble, and if the manufacturer has a repair kit (a valve is a good example of that), I would recommend that you go ahead with a repair. You have already taken it apart, I would put the part in a repair kit, if you have one, to try to lengthen the time between now and the next time you look at it.
If it’s a piece that has no repair kit, then obviously you will need to repair it or replace it, depending on your skill level and what it is you’re looking at.
If you’re looking at thermocouple and the feed screws on it are leaking, you may be a little limited in what your options are. Can you apply a vacuum-friendly sealant to brush around the feed throughs to see if that would solve the problem? That may be an option. What is the cost of that thermocouple? If it’s a $20 item, I’m probably going to put another thermocouple on there. If it’s a $1,000 item, I might try brushing some vacuum-friendly sealant on and see if that takes care of the problem.
One time, I found a leaking rotary vane pump, back in my field service days.
These all have repair kits where you can replace all the gaskets, the vanes, everything. But I didn’t have one. This was early in my young career. I talked to the factory about getting one and they were going to send one. But I told the client that we had nothing to lose. Let’s open it up, see what we can find. So, we open that pump up, and it looked pretty bad inside, but we cleaned everything up, even the gaskets, put a little vacuum sealant on, and put it all back together. We made it leak tight, and we got it running again. If I had a repair kit, I’m already there, then let’s go ahead and put the repair kit in. But if you don’t have one, there’s nothing wrong with taking it apart and seeing if cleaning and
reassembly gets it going for you.
Rotary Vane Pump Field Advice (00:30:30)
Dave Deiwert: I’m going to give a little free advice, no extra charge, to people talking about rotary vane pumps. In my career, I’ve come across quite a number of rotary pumps that were having an issue. I can count on one hand, however, how many times I wasn’t able to just clean it, put it back together, and get it going again with fresh oil. And both those times involved a shaft seal leak. So, if you don’t have a shaft seal leak, in my mind, you’ve got nothing to lose by taking a rotary vane pump apart, cleaning it, and putting some fresh oil back in it.
If you’re using solvents, when you take it apart, make sure those are solvents cleared back out of there
because solvents and oil don’t play very nice. You want to make sure that solvents have been removed and degassed from your pump. This may require that you put oil in it, run it for a little while, then flush it, and put some oil in to make sure you don’t have anything remaining behind.
A little willingness to get your hands dirty, open up the rotary vane pump, and a very good chance that you can get it going by just doing that.
Doug Glenn:All right, Dave. Appreciate the good advice and your expertise.
About the Guest
Dave Deiwert
Dave Deiwert has over 35 years of technical experience in industrial leak detection gained from his time at Vacuum Instruments Corp., Agilent Vacuum Technologies (Varian Vacuum), Edwards Vacuum, and Pfeiffer Vacuum. He leverages this experience by providing leak detection and vacuum technology training and consulting services as the owner and president of Tracer Gas Technologies.
Learn more about Dave from Heat Treat Today’s July Digital Edition’s Meet the Consultant page.