

Heat Treater vs. Water: Best Practices to Avoid Water Contamination

Heat treaters have their processes down to a science, literally. But what factor can compromise your heat treated part, let alone possibly cause detrimental damage to your facility?

Sr. Key Account Manager
Idemitsu Lubricants America

Quality Assurance Sr. Coordinator
Idemitsu Lubricants America
Heat Treat Today is pleased to present this original content article for today's Technical Tuesday. Greg Steiger, senior key account manager at Idemitsu Lubricants America, and Michelle Bennett, quality assurance senior coordinator at Idemitsu Lubricants America, describe water contamination in quench oil, the effects of this contamination, and how to test and safely remove the water from the quench oil.
Introduction
Water is an amazing substance. Water helped create the Grand Canyon and Niagara Falls. When water freezes, it doesn’t contract like most materials. Instead, it expands and creates potholes that swallow up our cars every winter. As the temperature rises, water also expands. This property allows water to heat our homes and is why steam engines work. The thermal expansion of water as it turns into steam is what can create catastrophic events in a quench oil. This paper will look at potential water contamination sources in a quench oil, what the effects of the water can be, how to test for the presence of water in a quench oil, and how to safely remove the water from a quench oil.
Sources of water contamination
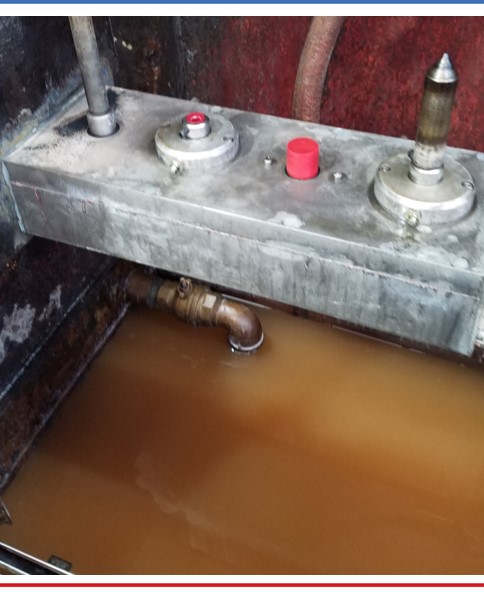
There are two major classifications of potential water contamination. The first source can be classified as potential internal sources of water. These potential sources are typically a part of heat treating furnace or oil cooling system. They include water-cooled bearings, fans, doors or heat exchangers. These water-cooled components are under a contestant pressure and will eventually leak. Because the quench tank is usually below these sources of water, the water will eventually find its way into the quench tank. Water-cooled bearings and fans are located within the furnace and are often directly above the quench tank. While a water-cooled door is typically not directly above a quench tank, it is in close proximity to the quench tank. This proximity will allow leaking water to enter the quench tank. Heat exchangers are typically situated away from the furnace. However, in a water-cooled heat exchanger, the water is never more than the wall thickness of the cooling tubes away from the oil. Should a cooling tube form a leak, the water and quench oil would simply mix within the cooling stream and the quench oil water mixture would return to the quench tank.
"The greatest risk of external water contamination lies in preventable operator or maintenance mistakes, especially when the equipment is down and open for maintenance."
The second classification is external sources. These sources of water contamination are not part of the heat treating furnace. Examples of external sources can be further broken down into leaks and operator or maintenance personnel mistakes. Leaks typically include fire extinguishers and fire suppression systems leaks, leaking fire resistant hydraulic systems, atmosphere leaks, pneumatic cylinders and building leaks. To prevent the leak type of contamination, routine maintenance, like a daily “Gemba” walk to spot any leaks, is the best defense against water entering a quench oil through a leak. The greatest risk of external water contamination lies in preventable operator or maintenance mistakes, especially when the equipment is down and open for maintenance.
Quite often when a furnace undergoes repairs, the quench oil is pumped out into empty totes to be reused after the furnace repair is finished. There is nothing wrong with doing this if the totes are clean. However, there have been reports of heat treaters doing this without first inspecting the totes to ensure that they are clean and free of any type of contamination. There have also been instances when the totes were not properly sealed and then stored outside, thus allowing rain water to get into the quench oil. But, the potential to add an incorrect product to the quench tank is a preventable operator error.
How water affects a quench oil
As previously mentioned, water expands as it turns into steam. At 212°F, water has a density of 0.96g/cm3.1 One gallon of water occupies 0.14 ft3. At one degree above boiling the steam from the boiling water has increased to occupy 224 ft3 and a density of 0.0006 g/cm3. The thermal expansion rate of water is approximately 1600%. What this means is the single gallon of water that was in the quench oil before it turned into steam now has a volume approaching 1600 gallons. In order for the 1600 gallons of steam to escape from the quench tank, it must displace an equal amount of quench oil. With nowhere to go, this displaced oil will find hot spots and open flames to create a catastrophic event.
Quench severity
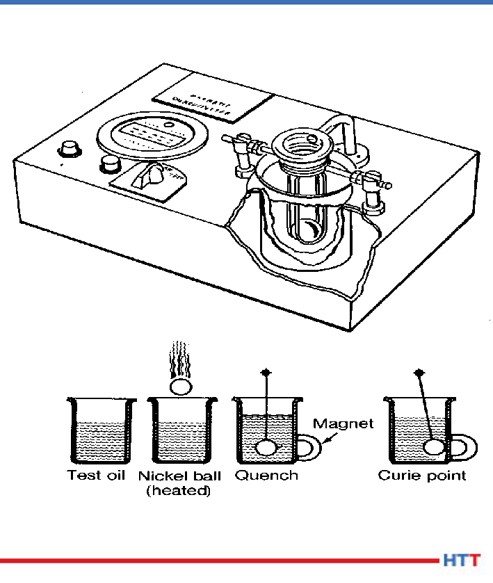
Historically, the severity of the quench has been measured by ASTM D-35202. In this method, a chromized nickel ball is heated to 885°C and is dropped through an electronic sensor, which starts a timer, and into a steel cylinder of quench oil in a magnetic field. Once the chromized nickel ball reaches the Currie temperature of nickel at 354°C, the ball becomes magnetic and closes the timing circuit when the ball comes into contact with the cylinder. The popularity of this test has always been that it provides a number that is easily interpreted by heat treaters to “rate” the oil as fast (9 – 11 seconds), “medium” (12 – 14 seconds), “slow” (15 – 20 seconds) or marquench (20 - 25 seconds). A schematic of the test method is shown in Figure #1.
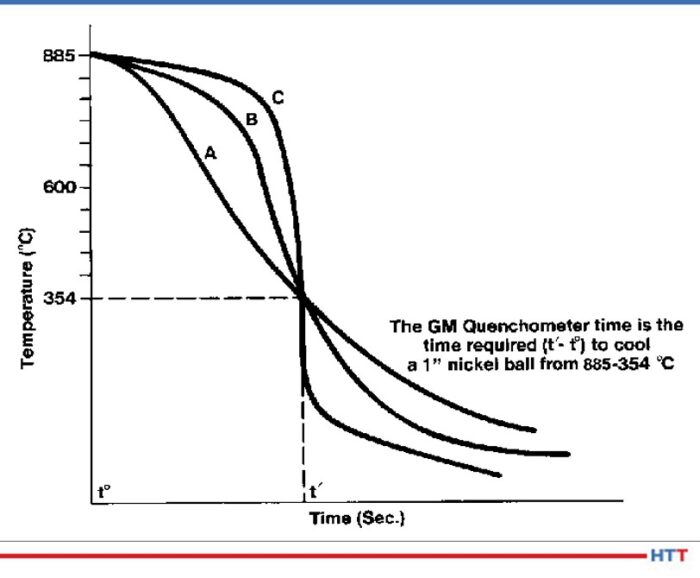
This test worked well to differentiate between different how well the quench oils cooled the nickel ball. The test really didn’t distinguish between the cooling characteristics of a quench oil. The test result in Figure #2 show a time in seconds for the nickel ball to reach 354°C for three separate oils. However, when the actual cooling curves of the oils are examined there are three distinct cooling curves shown.
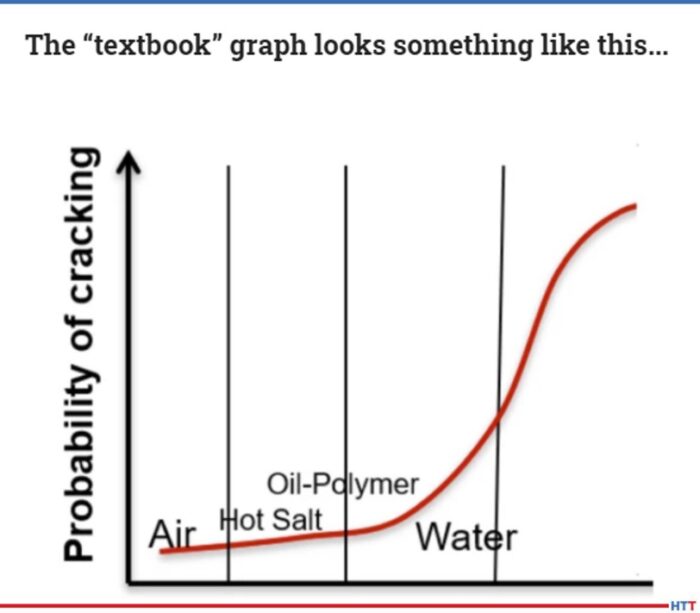
Because mechanical properties such as yield strength and hardness are dependent on the severity of the quench, the Grossman H value3 has become more popular over the years. In using the Grossman H value the lower the value the slower and less severe the quench. For instance air has an approximate H value of 0.01 cm-1 and water has an approximate H value of 0.4 cm-1. The calculation used to determine the Grossman H factor has historically been:
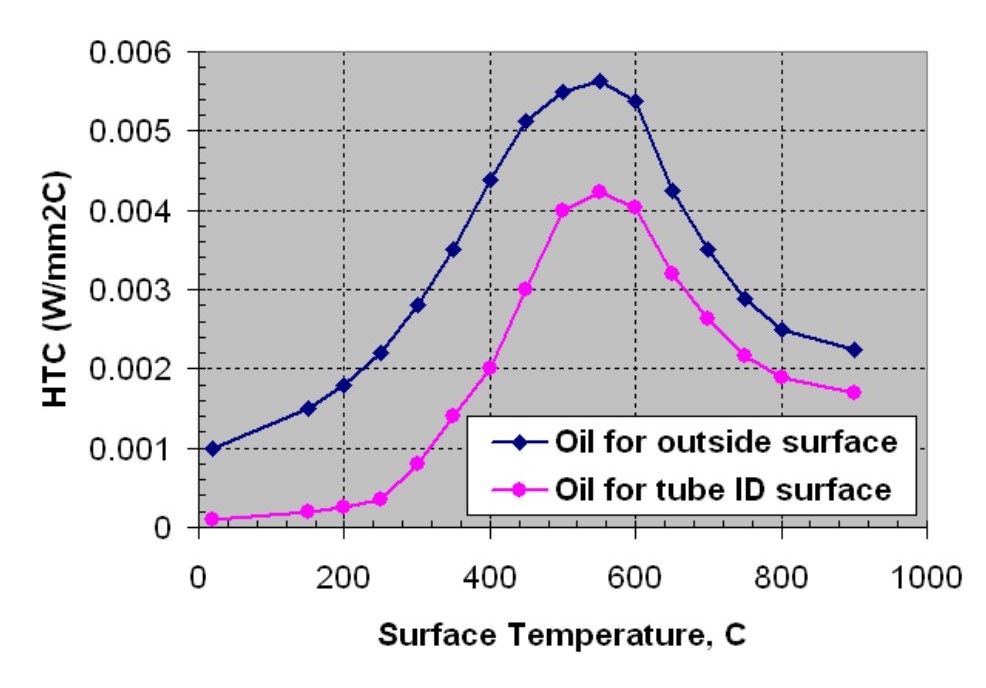
Where h is the heat transfer coefficient of the part when measured at the surface of the part and k is the thermal conductivity of the steel. Typically the heat transfer coefficient is measured at 705°C. A steel’s thermal conductivity does not typically change according to alloy composition or temperature. Therefore the Grossman H value is proportional to the heat transfer coefficient of the part.
Cooling curve
The basic cooling curve consists of three stages: the vapor blanket, nucleate boiling and convection. A basic cooling curve with the three different cooling phases is shown in Figure #3.
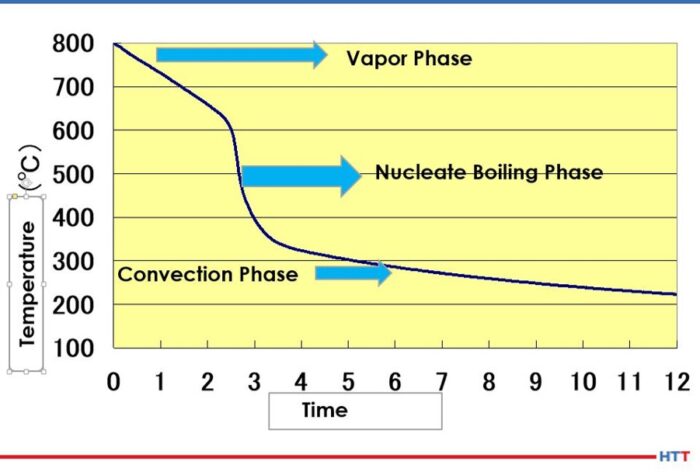
In the vapor blanket stage, the load and the quench oil coming into contact with the load are above the evaporation temperature of the oil. An insulating vapor blanket forms around the load and no cooling occurs. Because the vapor blanket is insulating and does not allow for cooling, the vapor stage carries the highest risk of distortion.4 Once the vapor pressure decreases to a point where the oil can once again condense on the load and the temperature of the oil falls below the evaporation temperature, the nucleate boiling stage begins. In this stage, the load undergoes the most aggressive cooling. After sufficient cooling has occurred and the quench oil temperature is below the boiling temperature of the oil, a smooth transition into the convection stage begins.
Stabilization of the vapor stage
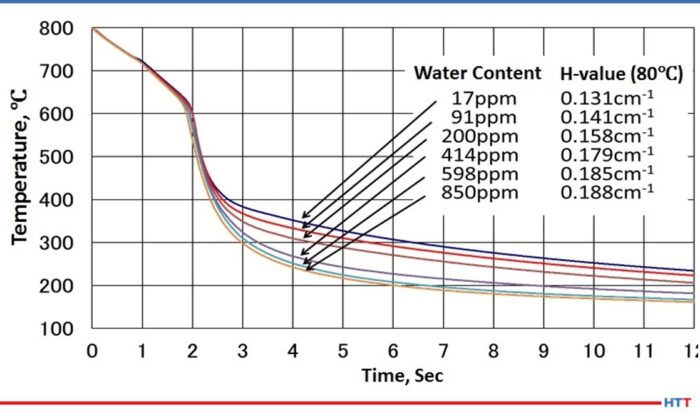
As water is dispersed throughout the oil, the viscosity of the oil changes. As the amount of water increases, the viscosity of the oil also increases.5 A careful examination of Figure #4 will also show a slight movement of the cooling curve to the left and a lengthening of the vapor stage as the amount of water increases. Furthermore the water in the oil is not uniformly dispersed, and this non-uniform dispersion creates uneven cooling rates throughout the oil. To restore even cooling, it is recommended the water in the quench oil be reduced to below 200 PPM.
Types of water found in a quench oil
In simplistic terms, water in a quench oil can be thought of as being dispersed in the quench oil due to agitation or as free water having exceeded the saturation point of the oil. As a general rule of thumb in the industry, the saturation point is considered to be 0.1% or 1,000 PPM. However, the saturation point will vary according to the temperature of the oil and the additives within the quench oil. Daphne Hi Temp A-U is a good example of a clear amber quench oil. Figure #5 shows a picture array of the appearance of the oil as the amount of water approaches and then exceeds the 1000 PPM industry standard.
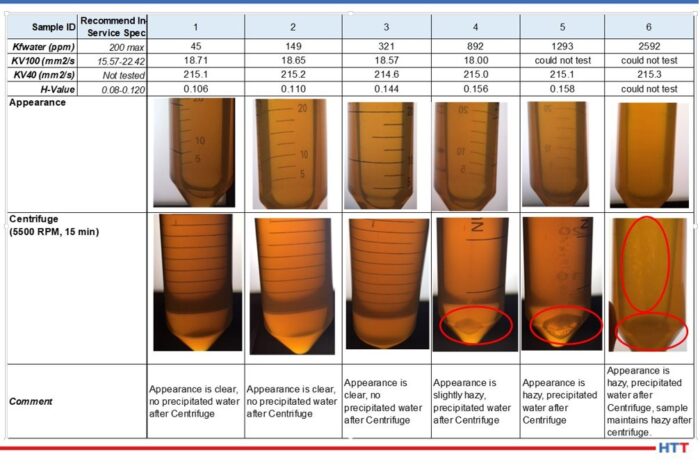
Notice in the data above that as the amount of water increases in the Daphne Hi Temp A-U, so does the viscosity as measured at 100°C. In addition to the viscosity rising as the amount of dispersed water increases, so also does the quench severity as measured by the Grossman H value. Furthermore, the appearance of the quench oil changes as the amount of water increases as well. (See Fig. 5 for the Daphne Hi Temp A-U.) With small amounts of dispersed water—45 PPM—the quench oil is clear and there is no water that is precipitated out after centrifuging for 15 minutes at 5500 RPM. However, as the amount of water begins to approach the 1000 PPM level, the appearance of the quench oil begins to become hazy. As the saturation point is exceeded, the appearance remains hazy and water precipitates out after centrifuging for 15 minutes at 5500 RPM.
Testing for oil in a quench oil
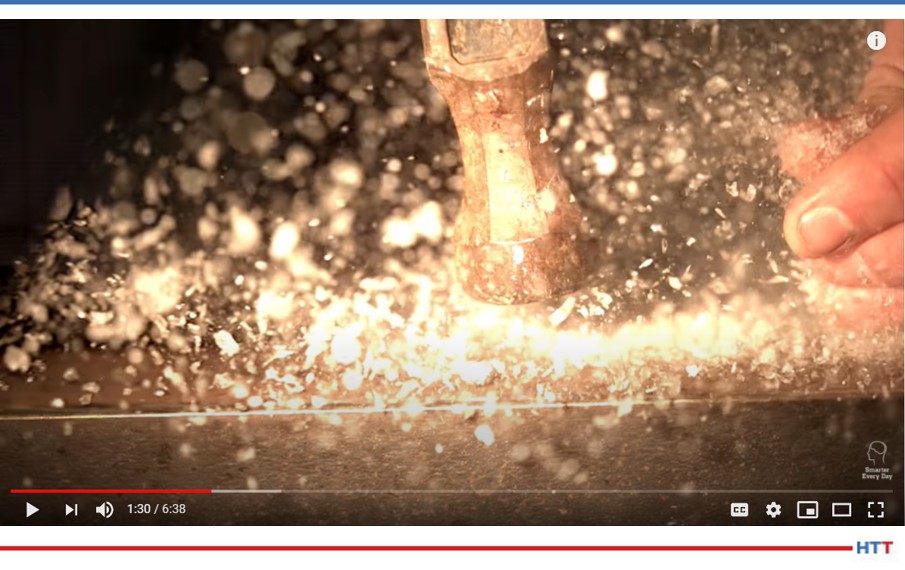
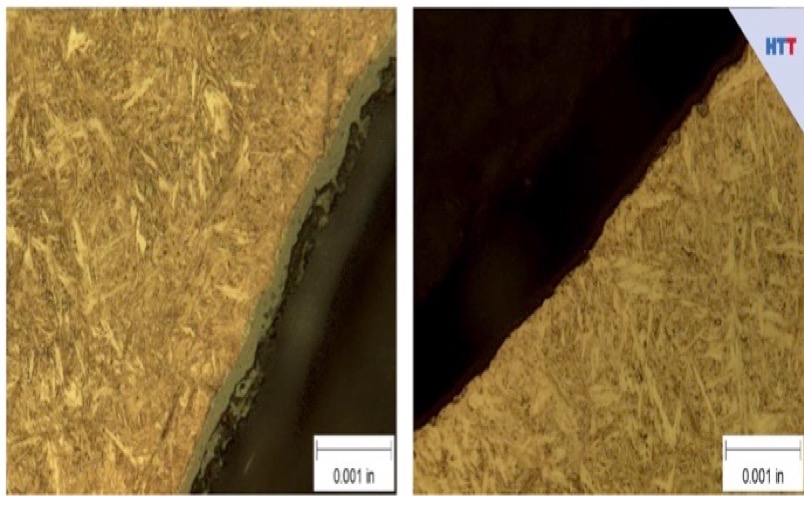
There are two basic types of testing methods for determining if there is water dispersed in a quench oil. One of the methods is subjective and the other is quantitative. The crackle test involves heating a metal coupon to approximately 400°F and placing a few drops of the quench oil on the surface. If there is a sufficient amount of water in the oil visible bubbling within the oil and audible crackling will occur. Unfortunately, this is typically above the saturation point of the quench oil. At which point it is often too late. Figure #6 shows examples of crackle testing.

The second and preferred testing method is through ASTM D-6304 Standard Test Method for Determination of Water in Petroleum Products, Lubricating Oils and Additives by Coulometric Karl Fisher Titration6. The Karl Fisher test uses the Bunsen electrochemical reaction to calculate the amount of water in a used oil and is accurate in used oil from 1 PPM to 50,000 PPM.
Removing water from a quench oil
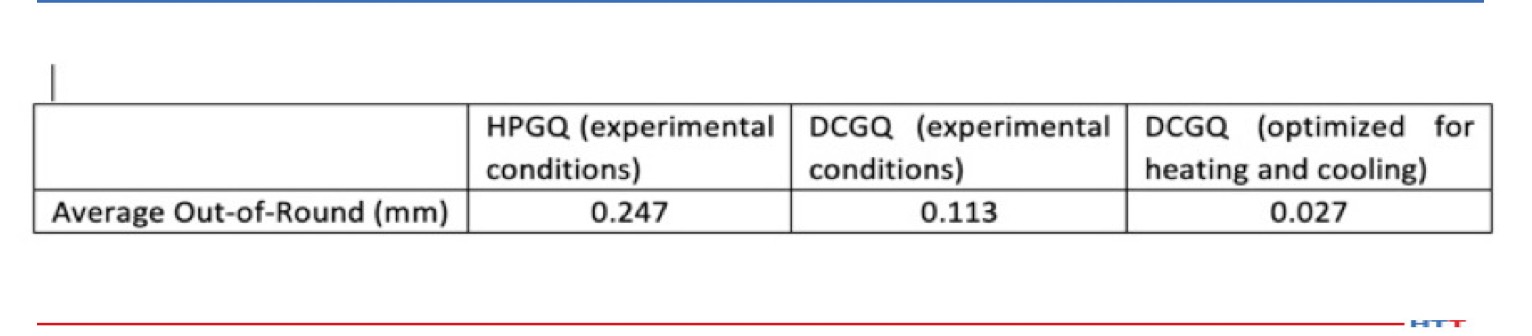
Removing excessive water from a quench oil can be achieved economically through several methods. Table #1 is a brief trouble shooting guide to the safe removal of water from a quench oil.

Conclusion
Finding small amounts of water, less than 50 PPM is very common in a used quench oil sample. This small amount could simply be condensation within the bottle and quench tank. However,when the amount of water begins to reach levels above 200 PPM, troubles can begin. At levels above 200 PPM of water, the following may occur:
- Uneven cooling due to non-uniform dispersing of the water within the quench oil
- Increase in viscosity
- Increase in Grossman H Value
- Lengthening of the vapor blanket stage
- Increase in the severity of the quench
Like most materials, water expands as it changes from a liquid into a vapor. With a thermal expansion rate of 1600%, a gallon of water turns into considerable more steam. Therefore excessive water transitioning into steam in a quench oil creates safety concerns when the steam forces the quench oil from the tank. Examples of these safety concerns are:
- Risk of harm and injury to plant personnel
- Damage to furnaces and related equipment
- Damage to the heat treat facility the surrounding plant and nearby buildings
- Severe cases can result in a quench oil fire or a building fire
The importance of a “Gemba" walk should not be overlooked. Water can enter into quench oil systems through normal heat treating operations such as a leak in a water-cooled piece of equipment, others can be from preventable sources such as a building leak or other human error. No matter what the source is, if water is suspected in a quench oil, the quench tank should be sampled and tested before it is used.
References:
- Handbook of Chemistry and Physics. 60th edition CRC Press, p. E-18.
- ASTM International, “Standard Test Method for Standard Time of Heat Treating Fluids (Magnetic Quenchometer Method),” American Society for Standards and Materials.
- M. A. Grossman and M. Asimov, “Hardenability and Quenching,” 1940, Iron Age Vol. 107 no.17, p. 25-29.
- Rikki Homma, K. Ichitani, M. Matsumoto, and G. Steiger, "Evaluation and control technique of cooling unevenness by quenching oil," 2017 ASM Heat Treat Expo, https://asm.confex.com/asm/ht2017/webprogram/Paper43594.html.
- G. Steiger, "Preventing the degradation of quench oils in the heat treatment process," Metal Treating Institute, https://www.heattreat.net/blogs/greg-steiger/2018/10/03/preventing-degradation-of-quench-oils-in-the-heat.
- ASTM International, "ASTM D-6304 Standard Test Method for Determination of Water in Petroleum Products, Lubricating Oils and Additives Coulometric Karl Fischer Titration," West Conshohocken, ASTM International, 2016.
- B. Lisic and G.E. Totten, "From GM Quenchometer Via Cooling Curve Analysis to Temperature Gradient Method," ASM Proceedings: Heat Treating, 18th Conference, 1998.
About the Authors:
Greg Steiger is the senior key account manager of Idemitsu Lubricants America for quench products. Previous to this position, Steiger served in a variety of technical service, research and development, and sales marketing roles for Chemtool, Inc., Witco Chemical Company, Inc., D.A. Stuart Company, and Safety-Kleen, Inc. He obtained a BSc in Chemistry from the University of Illinois at Chicago and is currently pursuing a Master’s Degree in Materials Engineering at Auburn University. He is also a member of ASM International.
Michelle Bennett is the quality assurance senior coordinator at Idemitsu Lubricants America, supervising the company's I-LAS used oil analysis program. Over the past 9 years, she has worked in the quality control lab and the research and development department. Her bachelor’s degree is in Chemistry from Indiana University.

Heat Treater vs. Water: Best Practices to Avoid Water Contamination Read More »


 From top left clockwise