In today’s Technical Tuesday installment, we highlight the various techniques and developments in the world of metal AM as it pertains to post-process heat treating. Check out the trivia quiz below to test your knowledge of the AM/3D industry, the processes, and the technology.
This feature was first released inHeat Treat Today’sJanuary 2025 Technologies To Watch in Heat Treating print edition.
Additive manufacturing (AM), commonly known as 3D printing, has a history marked by constant innovation for uses across the space, aerospace, medical, food, and manufacturing industries, to name a few. While AM is known to support, streamline, and customize part production, advanced materials paired with evolving AM techniques are creating new possibilities in materials engineering and industrial manufacturing. Due to the nature of this ever-developing technology, in-house heat treaters must continually learn about AM components and how thermal processing may enhance component properties.
Emanuel “Ely” Sachs
What was the original name for additive manufacturing (AM), circa 1980s? A) 3D printing B) Rapid prototyping (RP) C) Additive manufacturing (AM) D) Rapid tooling (RT)
What grade of stainless steel is most commonly used for AM to achieve varying levels of strength, hardness, and elongation when heat treated? A) 17-4 PH B) 316L C) 304 D) 430
Who is Emanuel “Ely” M. Sachs? A) An engineer at GE Aviation who combined multiple parts into one huge, complex design using a laser-based additive manufacturing method called direct metal laser melting B) An engineer at Stratasys Ltd., an American-Israeli manufacturer that began using a material extrusion based process with their FFF (fused filament fabrication) technology to print parts, patented in 1989 C) A professor of Mechanical and Materials Engineering at Worchester Polytechnic Institute who evaluated the post process heat treating of DMLS titanium alloy parts D) An MIT engineering professor who patented the process of metal binder jetting technique in 1993
What do cast parts made from powder metallurgy methods and AM parts have in common? A) The same heat treatment cycles produce the best results B) Custom cycles are used in less than 2% of both applications C) Parts exhibit porosity D) None of the above
What are the most commonly adjusted parameters to achieve higher yield strength when heat treating AM parts? A) Cooling and heating rate B) Temperature and time C) Time and pressure D) Temperature and pressure
Why is HIP known as the “gold standard” for processing AM parts for space? A) Eliminates porous microstructures without compromising the part’s geometries and dimensions B) High level of control and uniformity C) Combines high temperature and pressure to improve a part’s mechanical properties D) All of the above
What is NOT a potential benefit of additive manufacturing? A) Immediate cost savings B) Fast part production C) Rapid prototyping D) Opportunity for increased automation and use of robotics
What are the two main categories for most 3D printing methods? A) Those that use liquid binding polymers, and those that don’t B) Binder jetting technology (a non-melt-based process) and melt-based processes C) Both A and B D) Neither A nor B
Which alloy was originally developed for aerospace applications but became one of the most common biomedical alloys? A) Inconel 718 B) Inconel 625 C) Ti-6Al-4V D) Hastelloy C22
What was the first rapid prototyping method to produce metal parts in a single process (and is one of the most widely used AM technologies to manufacture Ti-6Al-4V parts)? A) Powder-bed fusion (PBF) B) Directed energy deposition (DED) C) Sheet lamination (SL) D) Direct metal laser sintering (DMLS)
In what way does high temperature processing — specifically HIP below the annealing temperature (1470°F/799°C) — improve DMLS Ti-6Al-4V parts? A) Preserves surface roughness and enhances osteointegration B) Reduces porosity and enhances corrosion resistance C) Both A and B D) Neither A nor B
What is the ideal way to process 3D printed parts made using liquid binder polymers? A) Print the parts in-house followed by debind and sinter. B) Have AM parts delivered in-house for heat treating when parts are at the “Green” stage C) Have AM parts delivered in-house for heat treating when parts are at the “Brown” stage D) None of the above
As Thomas Bauernhansl, professor of Production Technology & Factory Operations at the University of Stuttgart, aptly states, “We are going from more supply-oriented production to a demand-oriented one. In many cases, the customer determines which version he wants to have [of] a product — the manufacturer adapts to this and his processes accordingly.”
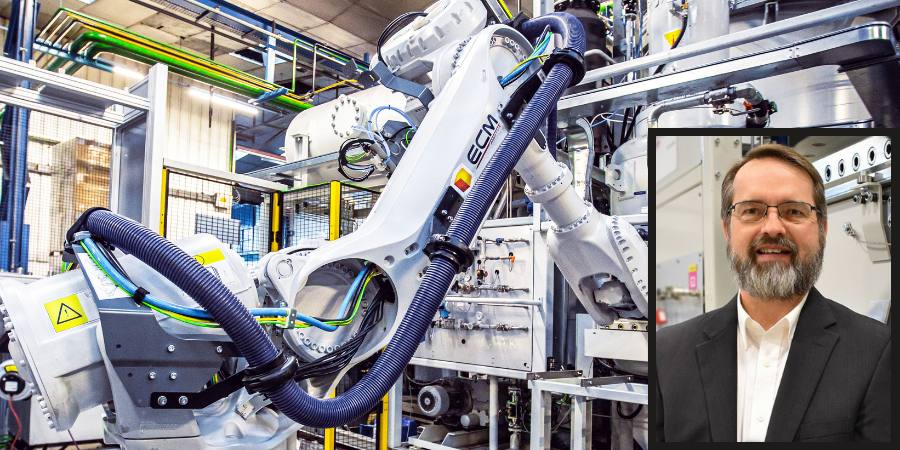
This shift is critical for the heat treat industry, where the need for advanced automation and robotics integration is paramount to achieve higher efficiency, consistent quality, and reduced costs.In this Technical Tuesday, Dennis Beauchesne, general manager at ECM USA, discusses the increase in use and installation of automation and robotics in manufacturing and specifically how companies within the heat treat industry have adapted to their implementation—and become innovators in their usage.
This informative piece was first released inHeat Treat Today’sJanuary 2025 Technologies To Watch in Heat Treating print edition.
Industry Automation
In the last 10–15 years, an upward trend is consistent with the increased investment value of integrated automation within a heat treatment plant. At the beginning of the 2000s, it was common to have an automatic transport car transporting batches to different stations, but, in the last five years, far more complex automation solutions are in demand. In order to meet the requirements of future industry robotics and automation, our industry must adapt to the new and improved technology offerings and standards that are being used in other industries.
Figure 1. Annual robotics installation by industry 2021-2023
According to World Robotics, there has been a significant increase in robotics usage and installations since 2020 (Figure 1). For example, the automotive industry shows installations almost doubled from 2020 to 2022 with 83,000 installations in 2020, compared to 136,000 installations in 2022. The industrial robot market was expected to grow by 7% in 2023 to more than 590,000 units worldwide. Although it exceeded 500,000 installations, robotics were down 2% (possibly due to COVID-19) compared to the prior record year. Of interest to note for the automotive industry, the industry increased its robotics demand in 2023 to surpass electronics with a 25% share (electronics was close with 23%, down by 5% due to inventory levels stabilizing after supply chain bottlenecks mostly vanished).
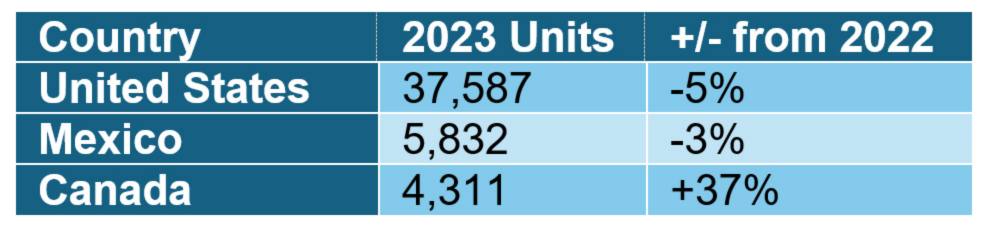
Table 1. North America’s robotics comparison 2022 to 2023 Source: World Robotics
Specifically for the United States and Mexico, peak robotics installation demand was documented in 2022, but demand has been consistent within +/-5% (Table 1). The future of robot installations is trending to grow and exceed 50,000 units in North America for 2024. Nearshoring of supply chains will create demand for automation technology in the years to come, according to Christopher Müller in his World Robotics 2024 – Industrial Robots presentation.
Manufacturing Concepts
The company SEW has previously published its ideas and concepts of autonomous transporters distributing the raw parts to the production cells, after the soft processing to the hardening plant, and finally the hard machining (Figure 2). All steps are configured within the component so the process steps can be well documented on a component basis.
Figure 2. SEW concept from Hiller, “The networked hardening shop,” 2019 Source: ECM GmbH
As can be seen in the SEW Figures, the original hardening plant is shown as a continuous furnace. However, this type of plant technology can be seen as contradictory to current production needs. To be compliant with this new philosophy, plant technology must be as modular, flexible, and automatable as the rest of the production layout and components. Heat treatment must also be controllable and unloadable with automatic transport units. Robots must be able to load batches and navigate the plant (according to CHD, steel, part numbers, etc.). The smaller the batch size, the larger the value of robotic component documentation. Furthermore, a reduction in batch size is advantageous for flexibility, costs, and heat treatment of many requirements for production runs.
Heat Treatment & Robotics
A heat treatment plant can implement recommendations for the future of industry automation by acquiring technology for:
Automatic loading/unloading
Component recognition systems
Automatically loaded/read recipe systems
Smaller batch sizes with a wide variety of variants
Heat treatment of different applications or steels in small quantities
Maintenance/repair detection
Benefits of automating part or all production line steps include:
Shorter process times
High CHD (Case Hardening Depth) uniformity and lower distortion
Lower operating costs and labor reduction
These technologies have existed and are being implemented in heat treat operations for a few years now. The results are clear and the benefits are proven through higher quality parts, highly efficient heat treat operations, and overall more efficient production facilities.
As many machining operations have been robotized, this allows the downstream heat treat operations to easily take advantage of part placement in dunnage and plant transport systems, whether manual or automated.
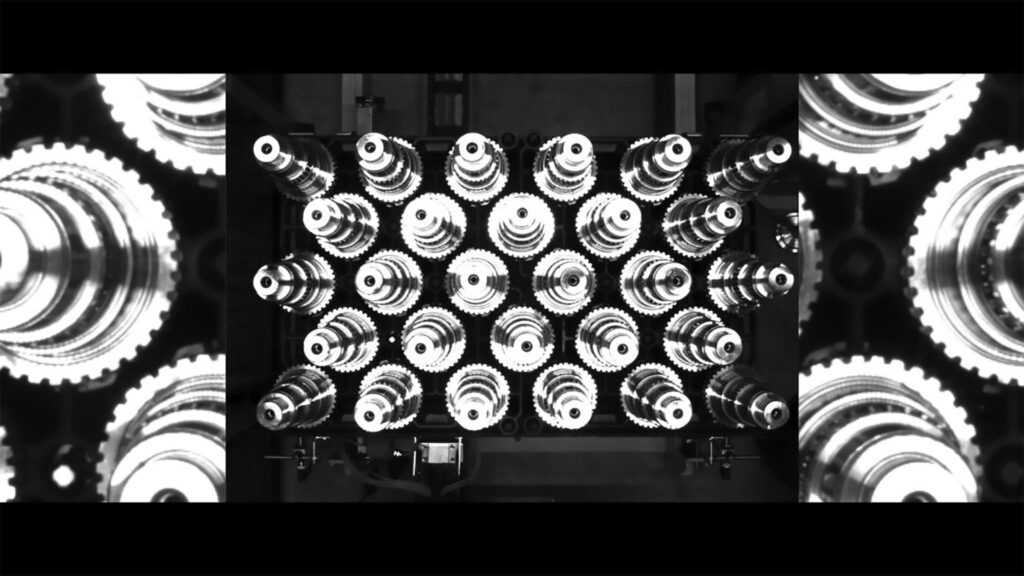
Figure 3. ECM Vision System Source: ECM Robotics
Batch Loading with Robotics
Bulk goods-loading (such as clips, links, and other small parts via weight detection) as well as loading and unloading of truck shafts in fixtures and in straightening machines are just a few examples of production areas that can benefit from robotics/automation. Visual recognition systems can identify gears/parts based on the diameter or by the number of teeth on the gear and can then sort them by these features (Figure 3).
Like the visual locating of the parts by cameras, they can also be used for tracking parts and loads within a heat treatment cell. A good amount of work has been done in this area for heat treating. This work covers part marking, tray/fixture encoding, and part weighing scenarios, and allows the heat treat system to accurately process all the different parts coming through the heat treat system with the correct process recipe.
Some of the work being done has been implemented with a QR code marking system for each part before heat treatment. To ensure the correct recipe or heat treatment is performed on the proper part, this scanned code works with the heat treatment system controls to upload the correct recipe to the proper cell. This information can be further analyzed to indicate precise placement in the heat treat tray through virtual tracking.
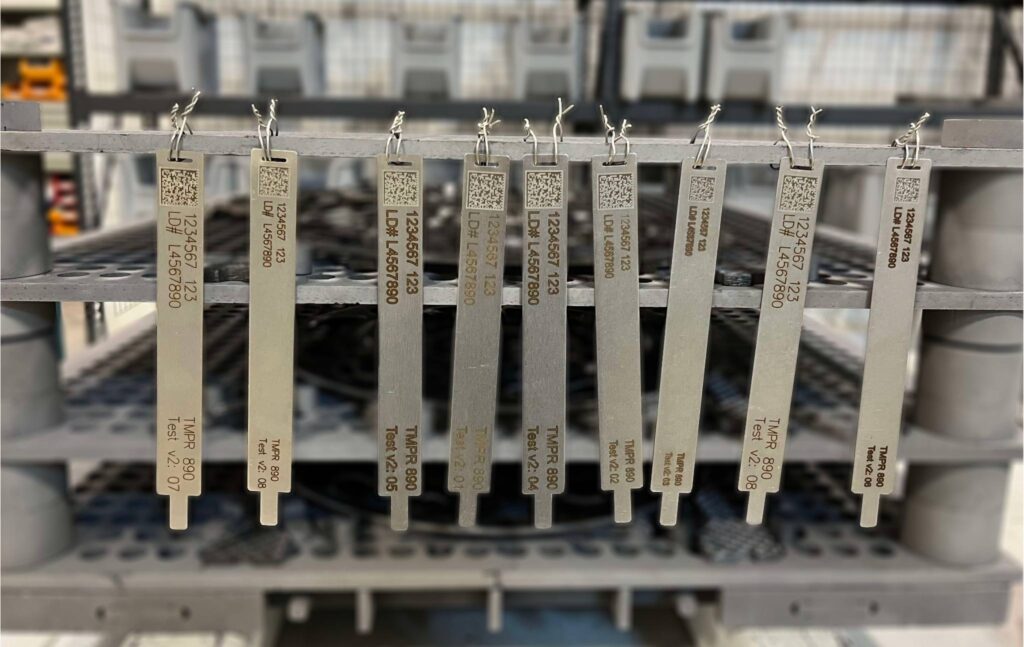
Figure 4. QR code heat treat test picture Source: ECM USA Synergy Center
In Figure 4, you can see in the details that this client has reviewed and tested to assure the code is visible before and after heat treating with a carburizing and hardening process.
These parts are tracked when entering the system and also noted as to which heat treat tray they are on by using a binary code with holes in a tray or on a strategically placed bar code plate on the tray. With this system, they can be scanned by a camera before entry and upon exit of the furnace (Figure 5). This tray scanning can also indicate how many cycles the trays have on them to ensure the trays stay in good condition and can be cycled efficiently.
Let’s look at the SEW production concept again and re-imagine it with a more efficient vacuum furnace technology with robotic integration. In this concept, the vacuum furnace system forms the “spatially distributed production reserve” which helps autonomous transport units as “situationally self-controlling” material is delivered.
The QR code on the component represents the “knowledge-based” running card. The robots recognize the components by means of the QR code and are loaded onto the appropriate heat treat trays. The heat treatment can then be carried out on a component-related, flexible, and documented basis. Traceability of production can also be ensured (Figure 6).
Loading of the parts can be done efficiently through a series of dunnage that hold the part in specific locations which assist the robot to locate, lift, and place the parts in the heat treat tray. This method doesn’t always need to be a perfect location for the incoming work as we now have 2D and 3D cameras that can work in tandem to locate parts, even in odd stacking or randomly loaded bins.
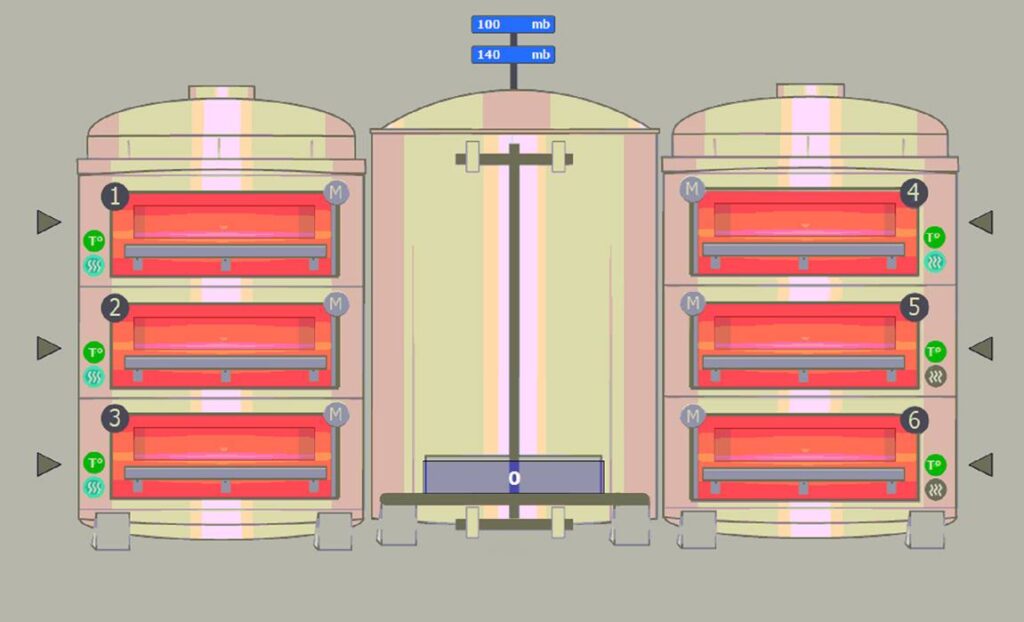
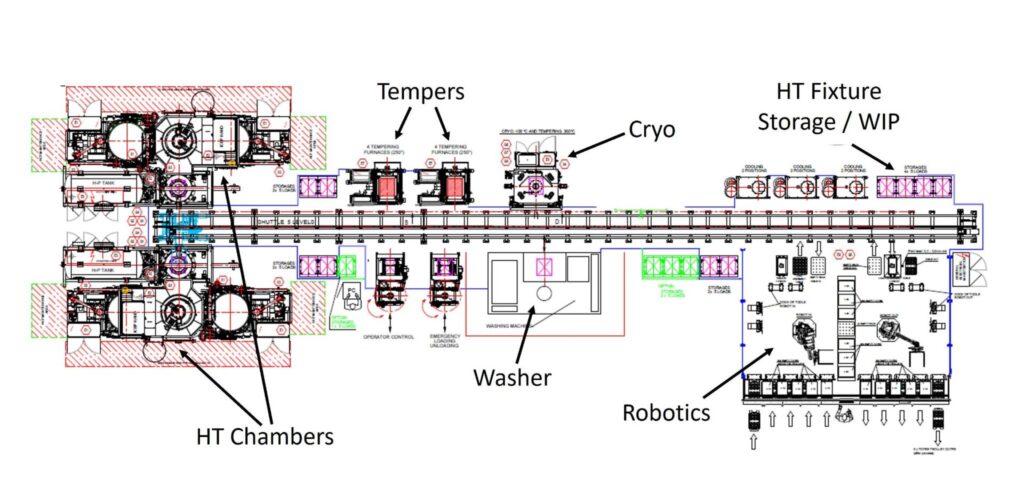
In a recent installation, a heat treater automated their gear cutting operation to prepare the dunnage before heat treat. Therefore, the heat treat robotics phase was simplified by storing each part in a specification location for the robot to “see” with its vision system. These parts are then scanned and automatically connected to the part’s recipe as stored in the system. In a modular system using low pressure carburizing, individual cells are utilized, and production is recipe driven. These recipes are pre-developed and stored to allow each cell to utilize the recipes for many different parts. In this case, after a part is scanned, the recipe is uploaded into the next available cell and the scanned parts and heat treat fixture is moved to the cell (Figure 7).
Figure 7. Modular vacuum furnace for low pressure carburizing Source: ECM USA
Figure 8 was designed to use over 175 different parts with nine different heat treat processes which included carburizing and slow cooling, hardening, tempering, cooling after tempering and cryogenic treatment.
With further considerations for additional benefits of the automated system, fixtures were optimized by using CFC (carbon fiber composite) base trays. These trays are not only extremely stable and have non-existent growth/warpage, but they also help with robotic placement before and after heat treatment. CFC trays are flat, or can be machined to conform to part geometry, which helps to reduce or minimize distortion related to fixture warpage or creep.
Figure 8. LPC and robotics configuration Source: ECM USA
Many system designs have been proposed to a variety of clients; however, the end goal is to design a system that is “standard.” This standard design needs to incorporate different forms of dunnage, bins, boxes, and pallets to allow a commercial heat treater to easily program the system whenever the next part comes in from their client, whatever it may be. This is a challenging task and needs to be broken out by weight category to design the robot’s reach and end tool design. In this case a robot cell offline of the heat treat furnace can be built and utilize, and ultimately use, an AMR (automated mobile robot) or AGV (automated guided vehicle) to bring the built loads to the furnaces (Figure 9).
Vacuum furnace systems have a clear advantage over traditional atmospheric systems with many features which lend themselves to integrate into the machining area with robotics and automation.
The fact that an LPC (low pressure vacuum) furnace system can process loads via a recipe input and each cell can be used to process a different case depth, or hardening cycle is highly advantageous when processing a wide variety of parts. In addition, the LPC process provides a more uniform case depth throughout the part to make a stronger part along with high quality processing. The vacuum furnace cells can be arranged in many ways to fit into existing facilities and to be able to use many methods of automation especially including robotics.
Quenching is also a key element in any hardening heat treat process. LPC furnace systems are usually associated with high pressure gas quenching (HPGQ) in a separate chamber to provide the best quenching performance. This gas quenching technique provides a clean process for each part and allows the use of CFC fixtures. There is also no requirement for post cleaning as is necessary with oil quenching.
Providing quality low pressure carburizing, clean and precise gas quenching, CFC trays for better uniformity and keeping the parts flat, and the automation benefits of robotics makes for a state-of-the-art heat treating production operation and thus completes the heat treat paradigm shift.
Figure 10. Robot loading Source: ECM USA
Conclusion
The heat treat industry wants and needs automation and robotics integration to advance production, reduce costs, and improve the overall quality of production. With traditional technology, process data evaluation and self-configured recipe values are not possible. Therefore, component analysis should be automated to meet and achieve consistent and reliable recipe values (mass flow, time). With the increase in robotics demand, vacuum furnace technology meets the variable requirements of “demand-oriented” production. Due to the flexibility of this technology, small batch size systems can be automated with robots or as bulk material.
References
Hiller, Gerald. “The networked hardening shop – the challenge to the hardening plant in the world of Industry 4.0.” ECM GmbH. Paper presentation, 2019.
Dennis Beauchesne brings experience of over 200 vacuum carburizing cells installed on high pressure gas quenching and oil quenching installations. He has worked in the thermal transfer equipment supply industry for over 30 years, 23 of which have been with ECM USA.
Did you know that November 6 was National Stress Awareness Day? It seems an appropriate designation to cover the days and weeks that follow Election Day as well as those leading up to the holidays. For many who are well aware of the stress of the events of the season, Heat Treat Todaywants to help with a different kind of stress relief.
Today we’re highlighting technical content that we’ve published over the last couple of years about stress relieving processes. Read an overview about stress relieving stainless steel components, listen to a Lunch & Learn dialogue about this underrated process, and explore a mechanical testing method for measuring material strength.
It is critical to provide things like stainless steel appliances and the Tesla truck with proper maintenance to keep the corrosion resistance and appearance lasting as long as possible.
Stainless steel shines in our kitchens and is becoming more popular in auto showrooms, mostly because of the promise that it is corrosion resistant. What most people don’t realize is that stainless steel will rust in a lot of circumstances. Sarah Jordan explores how stainless steel can be compromised by improper heat treatment and the steps heat treaters can take to prevent corrosion:
“Improper heat treating can also contribute to stress corrosion cracking. When material is quenched, it can cause residual stresses that, if not relieved, can become an issue.
“Corrosion in stainless steel can often be traced to improper heat treatment. When stainless steel is heated between 842–1562°F (450–850°C), chromium carbides can form at the grain boundaries, depleting the surrounding areas of chromium and making them susceptible to corrosion.”
Click on the image to hear this episode of Heat Treat Radio and read the transcript.
In this Lunch & Learnepisode from Heat Treat Radio, Dave Mouilleseaux discusses the three most underrated heat treat processes, including stress relieving manufactured components. If a comprehensive analysis of a heat treat operation needs to be performed on a manufactured component, such as a gear or a shaft, it is necessary to take into consideration any prior existing stresses in the part and what effect that has on the part.
The detrimental effects of not having stress relieved Source: pixabay
“Many times during the course of my career, I’ve had a customer come to me and say, ‘The part I gave you was correct, and you’ve given it back to me and then fill-in-the-blank. It’s warped, it’s changed size, it’s shrunk, all of those things.’
“What have you done in your heat treating process?” asked Mouilleseaux. “You have to back up all the way to the beginning of how this part was manufactured and deal with all of those component steps in order to answer that question properly. Stress relieving is one of the answers. It’s not the answer. It’s not the only answer, but it is one of them that has to be considered.”
To listen to this episode of Lunch & Learn, click here.
Photograph of the Hardox steel samples, with and without the WC insert attached, showing high levels of oxidation following from the brazing process. Source: Plastometrex
Mechanical testing is a standard production step in heat treating operations, but conventional methods of testing don’t always yield stress values consistent with the testing calculations.
Indentation plastometry allows users to obtain material strength characteristics in a way that is faster, cheaper, and simpler than conventional mechanical testing procedures. James Dean explores this novel mechanical testing method developed to infuse efficiency and accuracy into the process.
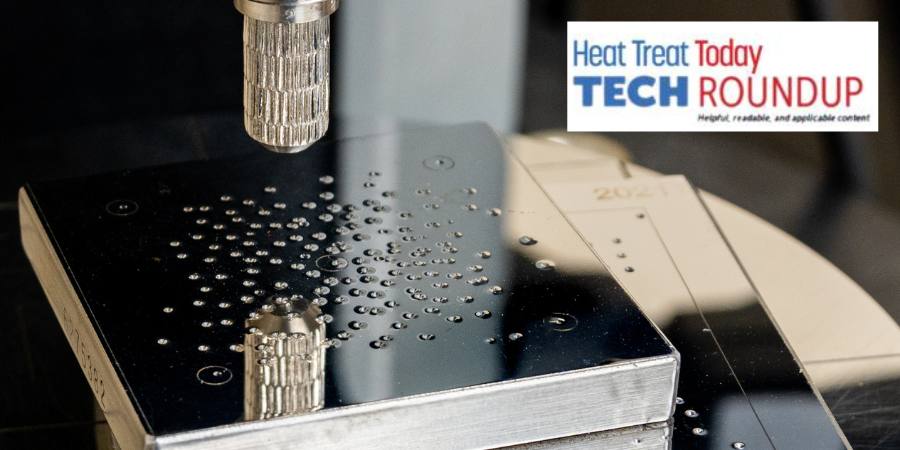
“The testing process is fully automated and involves three simple steps. The first is the creation of an indent using the indentation plastometer which is a custom-built, macromechanical test machine. The second is measurement of the residual profile shape using an integrated stylus profilometer.
“The third is the analysis of the profile shape in a proprietary software package called SEMPID, which converts the indentation test data into stress-strain curves that are comparable to those that would be measured using conventional mechanical testing methods. The entire procedure takes just a few minutes, and the surface preparation requirements are minimal.”
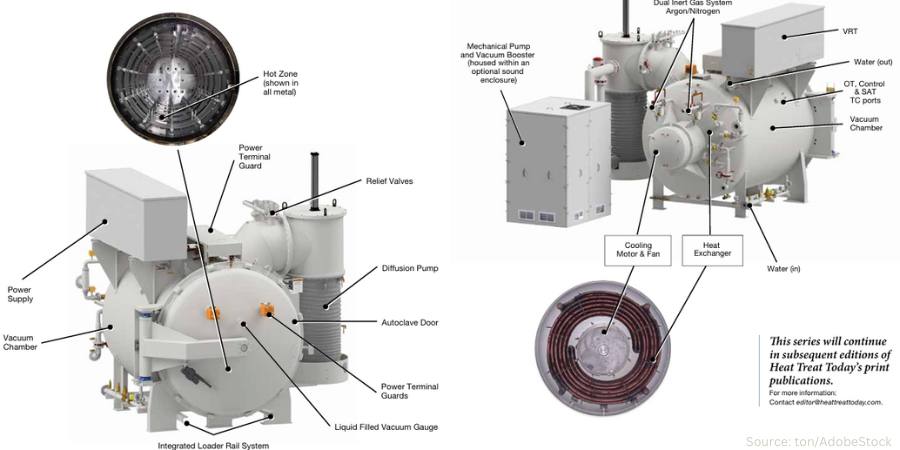
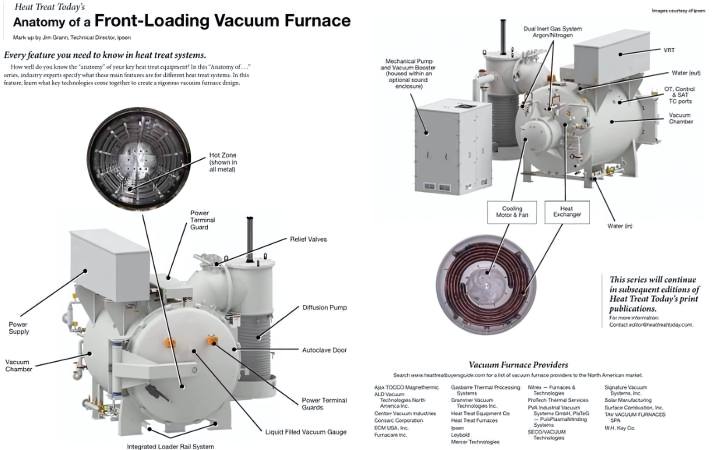
How well do you know the “anatomy” of your key heat treat equipment? In this “Anatomy of . . .” series, industry experts indicate the main features of a specific heat treat system. In this installment, the full-page spread identifies main features of a front-loading vacuum furnace.
The mark-ups for these reference images are provided by Jim Grann, technical director, Ipsen.
View the full graphics by clicking the image below.
This Technical Tuesday article is drawn from Heat Treat Today’sNovember 2024 Vacuumprint edition with a special focus on vacuum furnace technologies.
Search www.heattreatbuyersguide.com for a list of vacuum furnace providers to the North American market. If you are a vacuum furnace supplier and are not listed here, please let us know at editor@heattreattoday.com.
This series will continue in subsequent editions of Heat Treat Today’sprint publications. Stay tuned!
Find Heat Treating Products And Services When You Search On Heat Treat Buyers Guide.Com
In this episode of Heat TreatRadio,Doug Glenn and guest Michael Mouilleseaux, general manager at Erie Steel LTD, continue their discussion of case hardness, delving into the hardening ability of materials, focusing on case hardening and effective case depth. Michael explains the differences between total and effective case depth, the impact of core hardness, and the role of material chemistry. They also discuss practical applications for heat treaters, emphasizing the importance of understanding material properties.
Below, you can watch the video, listen to the podcast by clicking on the audio play button, or read an edited transcript.
The following transcript has been edited for your reading enjoyment.
The Influence of Core Hardness on Effective Case Depth Measurement (01:03)
Doug Glenn: Today we are going to talk about a pretty interesting topic, and some interesting terminology, that has to do with hardness and hardenability of metals. For people who are not metallurgists, this may seem like a strange topic because isn’t all metal hard?
But we are going to talk more in depth about hardness of metal, hardenability of metal, and effective case depth. What we want to do is get a run down on the influence of core hardness on effective case depth measurements.
Michael Mouilleseaux: We are going to get a little bit into the weeds today on some things specific to metallurgy.
Those who are involved in high volume production carburizing know that consistency of results is extremely important. It is not just important in that we have the process centered in that the results are that way, but ultimately it has something to do with the dimensional control.
Specifically with gears, if the output from the process is not consistent, then one of the things that is going to suffer is going to be the dimensions. So, we’re going to be talking about effective case depths today.
Effective Case Depth vs. Total Case Depth (02:23)
Effective case depth is a little bit different from total case depth. Total case depth is the total depth that carbon is diffused into a part. That is very much a function of time and temperature. And there are some nuances with grain size and alloy content, but it is essentially a time and temperature phenomena.
Effective case depth vs total case depth (02:59)
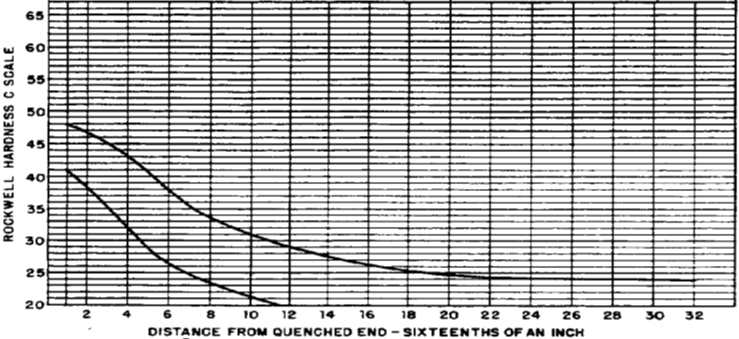
Effective case depth is a little bit different. If we look at this graph, the x axis is the distance to the surface, and the y axis is hardness in Rockwell C.
If you look at the green line, this is a micro hardness traverse of a carburized part. It tells us many things. If you look at the left-hand side of the line at .005 in depth, the hardness there is 60 Rockwell C. Then it diminishes as we go further into the part: 0.010, 0.020, 0.040, 0.050.
We get to the end of that line, and we see that is the core strength. The core is a function of the material hardenability.
So, what is the effective case depth? If we look at the second vertical blue line on the right, it says “Total Visual Case.” So that’s exactly what that is. If we were to look at this part and etch it — I am presupposing that everybody understands that we would section the part — we would mount it, we would polish it, and then we would look at it in the microscope at 100x. Then, we would see a darkened area, which would be the total depth of carbon diffusion into the part. That is not a function of the material grade; there are some nuances there.
But the effective case depth is a measurement. And in North America’s SAE Standard J423, we say that we measure the case effective depth to Rockwell C 50. The surface hardness is 60, we measure the hardness in increments, and when we reach this hardness the depth that hardness achieves is 50 Rockwell. That is the effective case depth. If we look at the core hardness on that part, we can see that on this particular sample it is somewhere between 45 and 50.
Finding Material Hardenability (05:17)
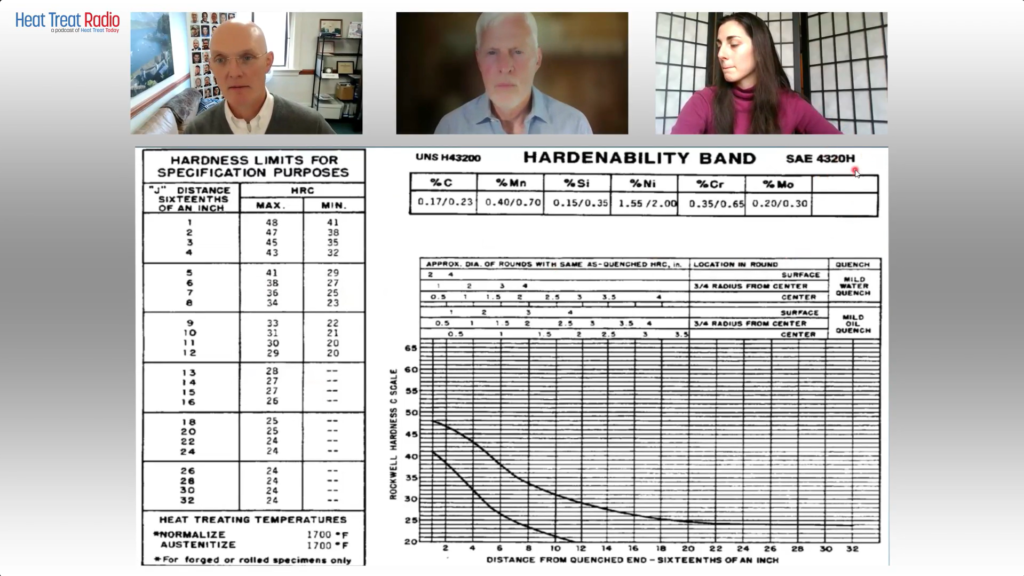
Hardenability band graph (14:26)
What causes this core hardness? It has to do with the hardenability of the material.
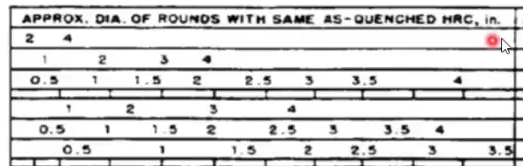
Here we are looking at an SAE chart J1268. It is for H band material for 4320, a common gear material. This tells us a lot. It has the chemistry on it, below that it has some information for approximate diameters, and then it has, on the far right side of the diameters, we see specs for cooling in water or cooling in oil.
And between them there is the surface, the three-quarter radius, and the center. If we look at the surface of an oil quench at two inches, it has a distance from the surface of something like 4 or 5. So, if you go over the chart on the left-hand side, go to 4/16” or 5/16”, which has an HRC of 29 to 41. Even though this is a hardenability guaranteed material, for a two-inch round you would expect to have something between 29 and 41 for the surface hardness.
Now let’s look at what you would get at three-quarter radius in an oil quench. If you look at two inches, the Jominy position is [eight]. You can see that at three-quarter radius on a two-inch bar, that is an inch and three quarters, I believe, the hardness is going to be something between 23 and 34. In the center of that bar for a two-inch round, it is going to be J12, which has a hardness of 20 to 29.
That is the definition of hardenability. It is the depth that a material can be hardened. And it’s totally a function of chemistry. Davenport and Bain did the algorithms for this in the 1920s leading up to World War II.
Effect of Core Hardness (07:20)
If we are going to evaluate the effect of core hardness, we are going to look at parts that are heat treated in the same furnace to the same cycle in the same basket under all of the same conditions — the only thing different is going to be the hardenability of the material.
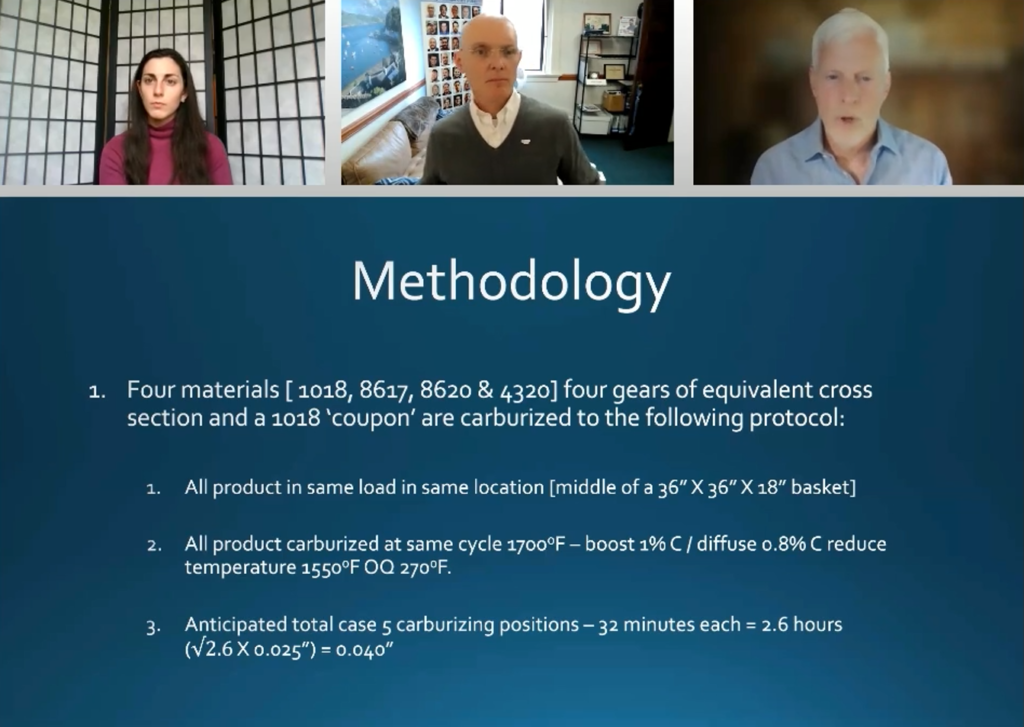
Methodology Slide (07:37)
Go all the way down to number three on this “Methodology” slide. The anticipated total case is going to be about 0.040 for all of these samples.
Hardenability samples measured (08:43)
This data graph has four samples on there. The red line is the measurement of Rockwell C 50. If we look at the highest hardenability sample, the blue sample has the highest core hardness and also the deepest effective case depth. And as the core hardness is reduced, you can see that where the line crosses the plane of Rockwell C 50, that is reduced as well.
Doug Glenn: Am I correct in thinking the yellow line here at the bottom has the lowest core hardness or hardenability?
MichaelMouilleseaux: Both. You’re correct.
Doug Glenn: That’s why it is crossing the red line much earlier than the others.
Michael Mouilleseaux: Yellow also has the lowest effective case depth.
Tabular data (10:22)
If we look at this in a tabular form, this is the data, and what you looked at were the microhardness traverses, per the standard using an MT-90: the hardness was (the effective case depth was) measured to Rockwell C, the total case depth was determined visually on these things, and, you’re going to say, that Michael, you’ve got four different materials there. That is correct. We also have four different hardenabilities.
In answer to the question, if these were all the same heat, would we have these same results? We would with the exception of the bottom one at 1018. There is no way that we could take an alloy steel and reduce the hardenability of that amount.
Here is what we are talking about: We know that they were all run at the same process when we look at the total enrichment on this; it’s within the margin of error 0.038 to 0.042.
We look at the effective case depth, interestingly, we have quite a variation there. The first one has the highest core hardness at 46, and the effective case depth is 0.039. Second, we have a sample where the core hardness is 44, and the effective case depth is 0.036. Third, we have a sample where the core hardness is Rockwell C 39, and we have 0.029 effective case depth. And finally, there’s the 1018 sample that was put in there just as a reference. The core hardness on that was 24 with 0.015 effective case depth.
There is a direct proportion between the core hardness and the effective case depth that you are going to be able to achieve.
Referencing back to that hardenability chart that we looked at (the very bottom, half inch section quench in moderately agitated oil), it has a Jominy position of 3. If we look at J3 on the chart, we can see that at the lower end of the chemistry composition, we could have a core hardness as low as 35, and at the upper end of the chemistry composition we could have a core hardness as high as 45.
Tabular data (10:22)
Let’s go back to the tabular data. That column for J3 is the data that was provided to us by our client from the steel mill.
When they melt a sheet of steel, it is a high value part. So, they use what is called SBQ (special bar quality). Special bar quality is subject to a lot of scrutiny and a lot of controls. One of the things provided, in addition to things like the chemistry and the internal cleanliness in the steel certification, is the hardenability of that specific heat.
You can see that the 8620, the first line, had a J3 of 44. We actually had a 46. The way to understand that is that when you’re going to melt 200 tons of steel, 100 tons of steel, or whatever amount it’s going to be, it’s not all done at one time in a single pour. It’s multiple pours out of a tundish.
The chemistry and the hardenability numbers that you got in a steel certification is going to be very close to an arithmetic average of what you would get when they test the first pours and the middle pours and the end pours. They’re going to average out.
Applying the Data (12:44)
When we’re using this data internally, we say we want to be plus or minus two points Rockwell C within the steel certified hardenability data. I can say that experientially over the years, Gerdau, SDI, Nucor (the domestic sources of SBQ bar )are very consistent in the way they make this stuff, and this is something that we can depend upon.
You could use this as a check for what you’re doing. If the steel that you have has a hardenability of 44 and if you’re not plus or minus two, you have to ask yourself why. There are only a couple of reasons that it would be outside those limits. If it’s above you, it probably is not the heat that it’s purported to be. If it is lower, it could either not be the heat that it’s purported to be, or there could be an issue with the heat treating.
As I said at the outset, we’re going to assume in this discussion that the reason that we have these numbers — the differential and core hardness — is not attributable to heat treating; it’s solely attributable to the chemical composition of the material or the hardenability.
We can use this information if we are an in-house or captive operation and are purchasing the material. We have an opportunity to define in our purchasing practice what the hardenability of the material is going to be.
As I mentioned before, the domestic sources are very consistent in the material that they produce. To produce a heat of 4320°F that has a J3 of 40 or 42 or 44, there is no cost penalty to that (in my experience involved in a major automotive supplier). It is a definition of what you want.
They are not making heats by randomly selecting chemistries for these heats and selling them. They make a recipe for a specific client. And my experience has been that they hold very true to that recipe.
If you are introducing a lot of variation into your process, not only is the output from that variable, but the cost of handling that is variable as well. A material such as this, to specify a J3 of 42 to 44, is something that is eminently doable. My experience is that the steel companies have been able to do that over time with a great amount of consistency.
Now, for those who are not involved in high volume production and do not have control of the source of the material, this chart remains usable. If someone is running a job shop or shorter term things who does not have furnace load sizes of parts, the key is to be able to mix and match things into specific processes. At least in carburizing, if we understand what the hardenability of the material is, then we have a much better opportunity of taking multiple parts and putting them into a load and determining ahead of time whether or not we are going to have consistent results.
Just one more thing that we would like to look at here is this next graph — the Caterpillar hardenability calculator. This is available from Caterpillar, and they readily share it with most all of their suppliers. I have been involved in numerous businesses and have never been refused this. You have to ask them for a copy of it.
SAE Chart J1268, which measures hardenability band for 4320 (05:47)
Michael Mouilleseaux: Using this calculator you import the chemistry of a heat, and then it automatically calculates the hardenability of that heat.
If you recall the J3 on the 4320 material that we looked at, the hardenability guaranteed it had a ten-point range. If you look at this particular heat, and this is what we call the open chemistry, this would not be a hardenability guaranteed material. The upper limit is higher than what you would see on a hardenability guaranteed material, and the lower limit is lower than what you would see. So the variation in a “Standard SAE J 48620” is going to be much wider – it will be much different.
If we look at that same J3 position, we are looking at 25 to 45, a 20-point swing in core hardness. If we go back and revisit the results we had, 39 to 46 with a seven-point swing, we had a 0.010 difference in effective case stuff. If we had a 20-point swing, you could imagine it is going to be significantly greater than that.
Two things, if you have the lower hardenability grade of material, it allows you to modify your process ahead of time to compensate for the fact that the core hardness is going to be lower in this part. Vice versa, if you have an extremely hot heat or it is high hardenability, similarly, you may be able to reduce some time and not put as much total case on the part in order to achieve what specified as effective case.
The hardenability charts are great guides in helping to establish a process and then to evaluate the consistency of that process.
One other comment about the chart is this is not a full-blown Lamont chart, which has various quench severities for different sizes. And that can be utilized to help pinpoint this. As you can see on the SAE chart, you essentially have two different quench rates. You have mild oil and water.
There are a lot of different types of quenchants that are available. The moderate quench rate that is on this chart very closely mimics what we at Erie have been able to achieve modified marquenching. Therefore, I’m able to use this chart without any offset.
Now, if you had a fast oil — petroleum-based oil is very fast — and a heat that had a J3 of 40 in which you are consistently seeing 44 out of it, then in your specific instance, your quenchant is more aggressive than what this chart was built to simulate. However, you can continue to use the chart. It’s just that you must use your experience in doing it.
So again: The strategy to control it is getting the hardenability data so that you can utilize that ahead of time — understanding what your specific heat treating operation is and, more specifically, what your quenching operation allows you to achieve.
Then, knowing that a typical section size of X in this furnace is going to give a Jominy position of Y, you can take that information and say over time, “If I have a variation here, it’s going to be an effective case depth. Is that variation attributable to the core hardness?” If it is, there is a strategy which will possibly change and tighten up the purchasing practice. If it is attributable to something else, then that gives good information to say, “There’s something in my heat treating process that I should be looking at that is attributable for this variation in case depth.”
Conclusion (22:14)
So, we waded into the weeds, and hopefully we have found our way out.
Doug Glenn: I think that explanation is going to be especially good for those who already know a little bit of metallurgy and know those charts.
Bethany Leone: Michael, for in-house heat treaters, how often do they need to be aware of the materials coming into their operations, testing it, or asking about changes that could be happening?
Michael Mouilleseaux: Hopefully this would give heat treaters worth their salt a reason to pause if they previously assumed the material does not come into play.
The next thing would be in high valued components — gears, shaft, power transmission, those kinds of things — heat lot control is typically mandated by the end user. If you have heat lot control and the unique data that goes with that, utilizing the strategy we just talked about is going to give you the ability of evaluating variation. If the primary source of variation is the material, that needs to be addressed. If the material is very consistent and yet you continue to have variation, there is obviously something in the heat treating process that needs to be addressed to reduce that variation.
Doug Glenn: Thanks for listening and thanks to Michael for presenting today. Appreciate your work, Michael.
About The Guest
Michael Mouilleseaux General Manager at Erie Steel, Ltd. Sourced from the author
Michael Mouilleseaux is general manager at Erie Steel LTD. Michael has been at Erie Steel in Toledo, OH, since 2006 with previous metallurgical experience at New Process Gear in Syracuse, NY, and as the Director of Technology in Marketing at FPM Heat Treating LLC in Elk Grove, IL. Having graduated from the University of Michigan with a degree in Metallurgical Engineering, Michael has proved his expertise in the field of heat treat, co-presenting at the 2019 Heat Treat show and currently serving on the Board of Trustees at the Metal Treating Institute.
On just about any given Tuesday, Heat TreatToday features an article that aims to educate our heat treating readers — be it in a process, equipment, metals, analysis, critical parts, or more. On this Thursday, enjoy this sampling of Technical Tuesday articles from the past several months.
Case Study: Heat Treat Equipment Meets the Future Industry Today
How has one heat treat furnace supplier contended with modern challenges of manufacturing? In this case study about a shift away from traditional forms of heat treat, explore how vacuum furnace technology has more technological horizons to bound.
Figure 1. Construction and schematic furnace cross-section CMe-T6810-25
Several key features discussed are the various challenges that characterize modern industry; the differences between historical heat treat furnaces and vacuum furnaces; furnace features that can meet these obstacles; and a close look at what one equipment option from SECO/WARWICK can offer. Additionally, explore the case study of a process that resulted in the following assessment: All technological requirements have been met, obtaining the following indicators of efficiency and consumption of energy factors calculated for the entire load and per unit net weight of the load (700 kg).”
How do thermocouples work? How would you tell if you had a bad one? Those ever-present temperature monitors are fairly straightforward to use, but when it comes to how it works — and why — things get complicated.
Figure 2. Eric Yeager of Cleveland Electric Laboratories explaining the 101 of all things thermocouple
This transcript Q&A article was published in a print edition, but there was too much information to fit the pages. Click below to read the full-length interview, including the final conversation about how dissimilar metals create electromotive force (EMF). Included in the discussion is proper care of T/C and guidance on when it’s time to replace.
A Quick Guide to Alloys and Their Medical Applications
Figure 3. Sneak peak of this medical alloys resource
If you’re pining for a medical heat treat quick resource in our “off-season,” we have a resource for you. Whether you are a seasoned heat treater of medical application parts or not, you know that the alloy composition of the part will greatly determine the type of heat treat application that is suitable. Before you expand your heat treat capabilities of medical devices, check out this graphic to quickly pin-point what alloys are in high-demand within the medical industry and what end-product they relate to.
The alloys addressed in this graphic are titanium, cobalt chromium, niobium, nitinol, copper, and tantalum.
Resource — Forging, Quenching, and Integrated Heat Treat: DFIQ Final Report
How much time and energy does it take to bring parts through forging and heat treatment? Have you ever tried integrating these heat intensive processes? If part design, forging method, and heat treat quenching solutions are considered together, some amazing results can occur. Check out the report findings when Direct from Forge Intensive Quenching (DFIQTM) was studied.
Figure 4. Examples of DFIQ equipment
Forgings were tested, in three different locations, to see if immediate quenching after forging made a difference in a variety of steel samples. The report shares, “The following material mechanical properties were evaluated: tensile strength, yield strength, elongation, reduction in area, and impact strength. Data obtained on the mechanical properties of DFIQ forgings were compared to that of forgings after applying a conventional post-forging heat treating process.”
3 Top Tips for Brinell and Rockwell Hardness Tests
Figure 5. Testing hardness
Accurate hardness testing is a critical business for numerous industries, not least heat treatment. In this guide, evaluate “best practice” for getting the best possible reading for your hardness test with the most efficiency. These comprehensive tips include proper set up for test equipment and need-to-know information regarding the preparation and execution of both Brinell and Rockwell hardness tests.
In fact, while there are some practices that overlap, knowing the differences is critical to determine whether or not a piece has reached the appropriate hardness. For Brinell, grease may skew a reading so that “at 300 HBW the material may appear 20 HBW softer than it actually is.” On the other hand, the precision in measuring indentation depth (versus indentation width) makes it imperative to keep the surfaces clear of any contamination.
Trending Market Insights for Aluminum Thermal Processing
Figure 6. State of the North American aluminum industry
In this survey on recent and developing changes in the aluminum market, we asked industry players about the impact of trending technology and the overall state of the industry. Their responses to our questions in August 2023 described a steady and increasing melters’ demand; a limited, or lack of, business increase from additive manufacturing and 3D printing; the impact of — and response to — slow supply chains; the status of sustainability in the aluminum market; and how they plan to meet future market demand.
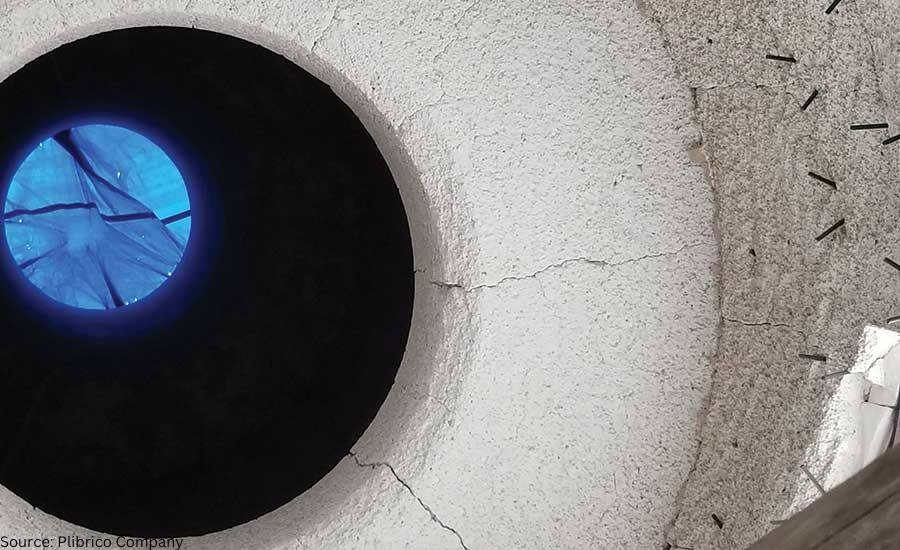
Heat treating aluminum presents a unique concern due to the operating conditions of high temperature, chemical corrosion, mechanical abrasion, and temperature variation. Guest columnist Roger M. Smith, director of technical services at Plibrico Company, LLC, examines the critical role the refractory lining plays in the success of manufacturing aluminum, why a refractory is susceptible to cracking under extreme conditions, and how to select and prepare refractory linings to achieve a longer service life.
A significant concern when manufacturing aluminum metal is the practical service life of the furnace. The service life is driven by the refractory lining’s ability to resist the various operating conditions within the furnace, such as high temperature, temperature variation, chemical corrosion, and mechanical abrasion. Ideally, a single refractory composition would be capable of withstanding all these conditions and readily available at a low price. Unfortunately, this is rarely the case.
Proper refractory selection is often about finding the best balance between price, properties, and performance for the given application and operating conditions. A refractory capable of high strength and abrasion resistance is often susceptible to cracking caused by extreme temperature variations, commonly referred to as thermal shock. However, a material capable of withstanding thermal shock without catastrophic cracking may be vulnerable to chemical corrosion. Finding the best balance of material properties for each zone in each furnace is important for maximizing the service life of a furnace.
Figure 1. Schematic showing refractory lining in an aluminum furnace
Refractory Under Attack — Requirements for Melting Aluminum
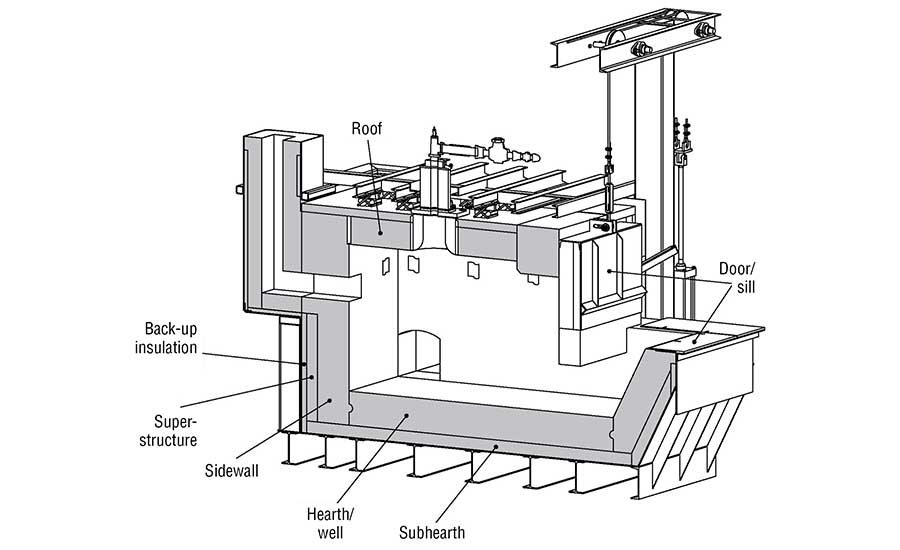
The refractory lining in an aluminum furnace (Figure 1) must endure various chemical reactions that occur while the furnace is in operation. There are three separate regions to consider: above, below, and at the melt line. Above the melt line, the refractory must withstand attack from various alkali vapors. Alkali vapors can be produced from flux used in the aluminum and from the combustion products used to heat the furnace. Below the melt line, the refractory must withstand molten aluminum. At the melt line, the region commonly referred to as the bellyband area, there is a triple point where the refractory, atmosphere, and aluminum interact.
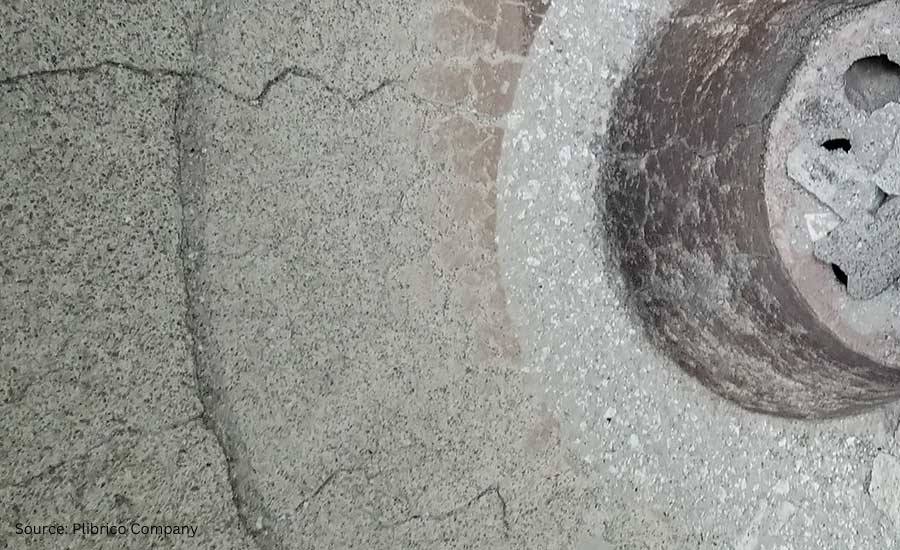
The refractory below the melt line comes in direct contact with liquid aluminum when the furnace is in operation. This contact can create a chemical reaction zone where oxides on the surface of the refractory can be reduced, such as silica (SiO2) to form silicon. Conversely, aluminum can penetrate into the refractory lining either through the same redox reactions or through infiltration due to capillary forces.
Aluminum forms corundum (Al2O3) when it oxidizes. This results in a change of the crystal structure from face-centered cubic to hexagonal, which causes a significant volume expansion. When corundum is formed inside the refractory lining, the change in volume creates cracks, which lead to more infiltration and more cracks until the refractory lining ultimately fails.
Wetting the Refractory
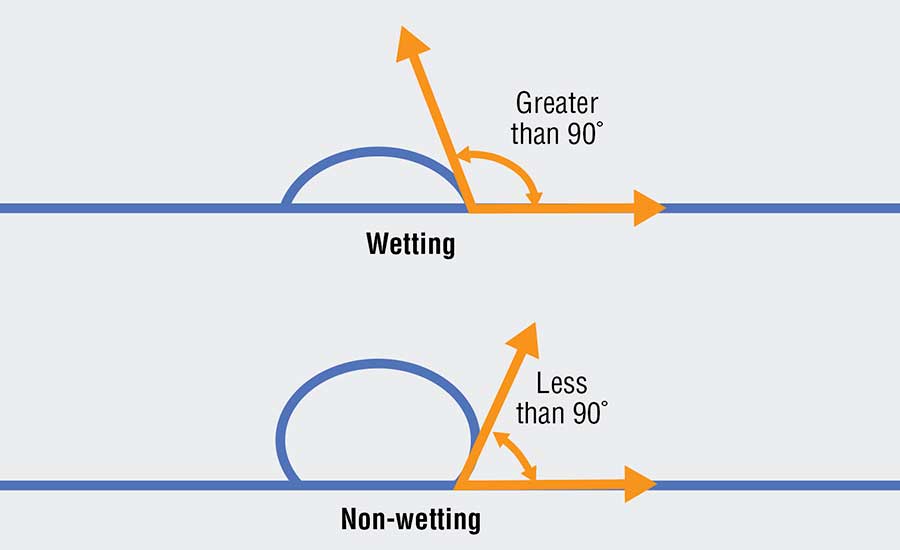
One method for reducing the reaction zone is to prevent the aluminum from “wetting” the refractory (see Figure 2). A liquid’s ability to “wet” a surface is defined by the contact angle of the liquid. When the contact angle between the liquid and the surface is greater than 90 degrees, then the liquid is said to wet the surface. When the contact angle is less than 90 degrees, the liquid does not wet the surface. A liquid that does not wet the surface is analogous to water beading on a car that has been freshly waxed. When aluminum does not wet a refractory, it is not able to react with the refractory and is not able to penetrate the lining.
Figure 2. Contact angle of the liquid demonstrating wetting vs. non-wetting
Various additives can be used to reduce aluminum’s tendency to wet a refractory. Some of the most used additives include barium, boron, or fluoride. They modify the surface chemistry of the refractory and reduce aluminum’s ability to react and penetrate. Using additives such as these greatly extends the effective service life of a refractory lining.
While non-wetting additives can be beneficial to extending the service life in areas where there is contact with molten aluminum, there are no benefits when not in aluminum contact. They do not protect from alkali attacks above the melt line. They do not enhance the abrasion resistance of the material. They do not improve the thermal shock resistance of the material. Furthermore, these additives are volatile. When exposed to temperatures above 1700°F (927°C), they begin to lose their effectiveness because they chemically react with other materials in the refractory and change. The additives can also be costly, which raises the price of the refractory compared to one with the same composition but without the additive.
The presence of non-wetting additives can have some negative effects on a refractory. Tests have shown that a 1% addition of a fluoride additive in a conventional castable can reduce the hot modulus of rupture (HMOR) by as much as 30% at 2000°F (1093°C). The effect can be even more significant in a low-cement castable. The loss in hot strength is likely attributed to the formation of a glassy phase induced by the additive. Fluoride and boron are both well-known glass formers and will form a glassy phase at the grain boundaries at high temperatures, which reduces the bond strength between individual grains and the overall strength of the bulk material.
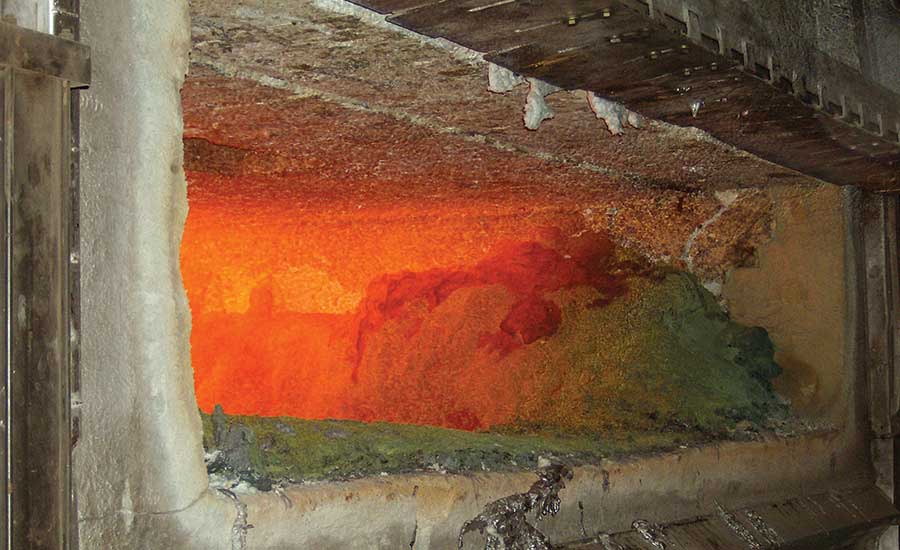
Figure 3. Refractory lining
Balancing Refractory Properties
The advantages and disadvantages of a refractory material should be considered when selecting materials for an aluminum furnace. The sidewalls of a furnace all come in direct contact with molten aluminum.
The upper sidewalls must be scraped to remove aluminum that splashes up to prevent corundum growth. The refractory selected for its sidewalls should be abrasion resistant to protect from mechanical scraping and non-wetting to protect from corundum growth. The hearth and well are submerged in aluminum, but they do not see the same level of abrasion as the sidewalls. The sub-hearth may see some molten aluminum but must also provide support, so a strong, non-wetting refractory should be used.
The door and sill will experience temperature fluctuations every time the door is opened, and they will be exposed to abrasion as the furnace is charged. Materials that are resistant to thermal shock and abrasion should be selected. The roof and superstructure need to be strong and resistant to alkali vapors. Backup insulation should be selected to reduce heat loss, but it should be of a composition that has moderate resistance to molten aluminum in case of refractory failure at the hot face.
In all these zones, the operating conditions of the specific furnace must be considered, and the balance of properties must be adjusted case-by-case. The primary failure modes must be identified, and materials should then be adjusted accordingly.
The Key to Refractory Selection
The operating conditions in an aluminum furnace require a refractory lining with different benefits in different zones. At the furnace door, the refractory can experience drastic fluctuations in temperature that can cause cracking. The upper sidewalls will develop scale that has to be scraped off, so the refractory needs to be abrasion resistant.
The lower sidewalls come in direct contact with molten aluminum and need to resist chemical attacks and aluminum penetration to avoid corundum growth. Finding a cost-effective refractory that can meet all these requirements is very difficult, but it can be done with sufficient research. Careful material selection that considers the needs and operating conditions of a particular furnace is important for maximizing the service life of a refractory lining.
About the Author:
Roger M. Smith Director of Technical Services Plibrico Company, LLC Source: Plibrico
Roger Smith is a seasoned professional in the refractory industry. With a master’s degree in Ceramic Engineering from the University of Missouri – Rolla, Roger has over 15 years of experience in the processing, development, and quality assurance of both traditional and advanced ceramics. He has a proven track record in developing innovative ceramic formulations, scaling up processes for commercial production, and optimizing manufacturing operations.
In this episode of Heat TreatRadio,Doug Glenn discusses the hardenability of materials with guest Michael Mouilleseaux, general manager at Erie Steel LTD. Michael walks us through how to interpret hardenability charts and provides detailed insights on reading these charts, including addressing the importance of understanding the nuances of complicated part geometry.
Below, you can watch the video, listen to the podcast by clicking on the audio play button, or read an edited transcript.
The following transcript has been edited for your reading enjoyment.
Understanding a Hardenability Chart (01:59)
Doug Glenn: What I’d like to do is talk through this chart and learn how to read this a little bit better. And I’d like to ask questions about it because I’m not familiar with this, and I’m sure there are going to be some listeners and viewers who aren’t familiar with it. This will be just a quick tutorial on how to read these charts.
Go to the upper, right-hand corner. First off, SAE 4320H is the grade of the steel that we’re talking about?
The Heat Treat Lunch & Learn crew: Doug Glenn, Publisher of Heat Treat Today; Michael Mouilleseaux, General Manager at Erie Steel LTD.; Bethany Leone, Managing Editor of Heat Treat Today Use this chart to follow along with the conversation. Source of chart: Erie Steel, Ltd.
Michael Mouilleseaux: Correct.
Doug Glenn: Then the table right below that you’ve got percentage C (carbon). Is Mn manganese?
Michael Mouilleseaux: Manganese.
Doug Glenn: Thank you very much. Silicon, nickel, chrome, moly. My question is about those ranges. Is this basically saying the percentage carbon on the far left in 4320H goes anywhere from 0.17–0.23?
Michael Mouilleseaux: That is correct.
Doug Glenn: Okay. So that’s variability right there. All of those are basically telling you what the ranges are in those alloys in this grade of steel?
Michael Mouilleseaux: That is correct.
Doug Glenn: Then you go down to the top columns of this table below, and it says “Approximate diameter of rounds with same as quenched HRC in inches.” Right?
Approximate diameter of rounds with same as quenched HRC in inches Source: Erie Steel, Ltd.
Michael Mouilleseaux: Yeah. Essentially, the first three rows are for water quenching. And the bottom three are for oil quenching.
Doug Glenn: If you go over to the second major column called “Location in round,” what’s the size of the round we’re working on here?
Michael Mouilleseaux: It can vary. Go down to where it says, “Mild Oil Quench,” then left to “Surface,” then left then go to “2 inches.” Then, go straight down to the bottom, and that’s approximately J5. So, the “Distance from Quenched End — Sixteenths of an Inch” is Jominy position 5.
Michael Mouilleseaux: If you go to Jominy position 5 on the left-hand chart, you can see the hardness limits for that; the maximum is Rockwell C 41, and the minimum is Rockwell C 29. So, the chemistry can vary provided the hardenability at J5 is 29–41.
Doug Glenn: That’s the acceptable range?
Michael Mouilleseaux: That’s the acceptable range. That’s one way of looking at it. The chemistry would allow you to do that.
Now, go back to the chart on the right-hand side and to “Surface,” move down one row to “¾ radius from center,” and go left to two inches. Moving down from there you see that is Jominy position 8. So, the surface of a two-inch round is Jominy position 5, and the ¾ radius is Jominy position 8.
If you go to the hardness chart on the left-hand side, that says that if you had a two-inch round of 4320H, and it was oil quenched, and you check the hardness at ¾ radius, then the expectation is that it would be 23–34.
Now, go back to the same chart that we were just at, and go to the “Center” row of “Mild oil quench.” Continue left to two inches, and that’s J12. Go back to the left-hand chart, and J12 is 20–29 in the center of the part.
So, the surface of the part could be 41, ¾ radius, center of the part would be 34, and the center of the part would be 29.And that would all meet the criteria.
Doug Glenn: The maximum for J5 would be 41.But at J12 you could get a 20 in the middle.
Michael Mouilleseaux: Right. That is one way to look at this chart. But there is another way.
Notice that it says “rounds.”There are some nuances to having flats and rectangles because, if you think about it, for the cross-sectional area of a rectangle, the hardenability is going to be determined by the direction that it is thinnest, not by the direction that it is thickest.
Take a gear tooth, for example: in the chart that we just made up the gear teeth, the root of the gear was about a half inch, just slightly more; and if we go to this same chart, go to “Center” of “Mild oil quench,” and then go to a “0.5 inch,” and when you go straight down, that’s the J3.
Is a gear necessarily a round? Of course, the answer to that is no. So, in complex shapes you can use this data, but you have to interpolate it in order to understand it.
To some extent, the first time you run this, you’re going to say, “I have a gear, and the root is a half inch across. And I know that the J3 is 40. And I’ll run this part, and I’ll section it and I’ll measure it and it’s 40. And I’ll say that’s a good approximation of that.” And experientially, you build confidence in this, that is, it’s your operation, your quenching operation, and your components. It allows you to interpolate these, and they become extremely useful.
So, is it definitive? No. Is it useful? Yes.
Doug Glenn: It gives you a ballpark, right? I mean, it’s giving you something, maybe guardrails.
Michael Mouilleseaux: It gives you a ballpark; it gives you guardrails. And I can tell you that after having run gear product in the same equipment for ten years, I can say that it’s definitive. I can say that if I have this hardenability, and I get this hardenability number for this heat, and these gears are made from this heat of steel, and it has a J3 of 42. If I’m at 38, I know something is going on other than just hardenability. And, at that point, I would suspect my heat treat operation.
Doug Glenn: Yeah. I have one more question about this chart: On the bottom right part of the graph there are two plot lines on there. What do those represent? I was thinking one represented the water quench and the bottom one represents the oil quench.
Plot lines representing maximum hardenability and minimum hardenability Source: Erie Steel, Ltd.
Michael Mouilleseaux: The top one represents the maximum hardenability. And the lower the lower one represents the minimum hardenability.
Doug Glenn: That’s your band. Okay. Those are basically your values over on the left-hand side then. Very good.
I don’t know about you, but I found that helpful. I really didn’t ever know how to read these tables. So, maybe someone else will find that useful. Thanks, Michael. I appreciate your expertise.
Michael Mouilleseaux: It’s been my pleasure.
About The Guest
Michael Mouilleseaux General Manager at Erie Steel, Ltd. Sourced from the author
Michael Mouilleseaux is general manager at Erie Steel LTD. Mike has been at Erie Steel in Toledo, OH, since 2006 with previous metallurgical experience at New Process Gear in Syracuse, NY, and as the Director of Technology in Marketing at FPM Heat Treating LLC in Elk Grove, IL. Having graduated from the University of Michigan with a degree in Metallurgical Engineering, Mike has proved his expertise in the field of heat treat, co-presenting at the 2019 Heat Treat show and currently serving on the Board of Trustees at the Metal Treating Institute.
Understanding abrasion can be the key to extending the life of your refractory lining. The following article provided by Plibrico Company examines abrasion resistance, its role in choosing a refractory solution, and what factors to take into consideration when assessing counter-measures.
Refractory material is designed to be very durable, withstand extreme service conditions and defy mechanical abuse in many different types of thermal-processing operations. However, severe conditions that cause abrasion in the form of high levels of mechanical scraping and airborne particulate matter can challenge refractories, shortening their service lives.
Abrasion resistance is one of the most critical and possibly the most misunderstood considerations when choosing a refractory solution. A clear understanding of what abrasion is and, perhaps more importantly, what it is not can prevent needless repair costs and lead to significant savings. This is especially important when evaluating refractory designs for a new application or when considering upgrades for an existing one.
What Abrasion Is
Abrasion is the destructive process that causes a material to wear away through mechanical scraping or scratching. Anyone who has ever grated cheese or sanded wood has experienced the abrasion encountered in everyday life. As abrasion continues, thin layers of the abraded material are removed, leaving the object thinner and usually making its surface smoother.
The same process can be observed in the refractory world. Refractory linings are abraded by high-velocity airborne particulate, cleaning tools and fuel/process materials that pass through the unit and come into contact with the lining. The telltale sign of abrasion is a refractory lining that has steadily become thinner while its surface has become smoother. The surface may even shine as if it had just been polished, which is not surprising when we consider that polishing is another common form of abrasion.
Fig. 1. Abrasion damage to the refractory bottom of a choke ring of a thermal-oxidizer unit
What Abrasion is Not
Abrasion is considered a type of mechanical abuse, but it is not the only type of mechanical abuse to which refractory linings are subjected. Equally common is impact: the sudden, forceful collision between the refractory lining and a moving object. Impact can come from a variety of sources. The moving object may be a cleaning tool, a piece of process material, a chunk of fuel or a dislodged mass of refractory or slag, depending on the application. Impact with such objects typically results in chips and cracks in the refractory lining.
Refractory materials designed for abrasion resistance tend to have increased strength and hardness compared to those found in traditional refractories, and these abrasion-resistant materials may provide some resistance to impact. Abrasion-resistant properties can also lead to increased brittleness. This is because if the impact exceeds the strength of the material, chipping and cracking could potentially be worse than in traditional refractories.
Compression and tension are also forms of mechanical abuse and can be caused by changes in the shape of the refractory lining as it is heated or cooled or by movements of the furnace shell itself – by intentional design or otherwise. Here again the increased strength and corresponding brittleness of the material could potentially result in a negative effect on the refractory lining.
All types of mechanical abuse can cause thinning of the refractory lining, so it is important to conduct a detailed investigation into the destructive mechanism before drawing any conclusions. Refractory solutions designed to resist abrasion may not be helpful against damage caused by impact, compression or tension.
Similarly, solutions designed to address other types of mechanical abuse may be ineffective against abrasion. For example, stainless steel needles are commonly incorporated into refractory linings to extend service life when impact resistance is required. The needles bridge cracks formed as a result of the impact, making it more difficult for these cracks to grow and connect. This helps the refractory lining hold together longer. The bridging provided by needles has no effect in an abrasion situation, however, since crack growth is not caused by the abrasion process.
Meeting Abrasion-Resistance Demands
Once abrasion is identified as the main mode of failure, there are several options to counter it. Selecting a refractory material based on a raw material hard enough to resist the abrasion is a common technique. For one material to abrade another it must be harder than the material being abraded. For instance, a diamond can be used to scratch glass, but glass cannot be used to scratch a diamond.
It follows that refractory materials based on very hard raw materials, like silicon carbide, can be used to resist abrasion and extend the life of the lining. It should be remembered, however, that a refractory lining is made up of many different materials, not just the main constituent raw materials. Clay, cement, silica and other softer components will still be exposed and abraded even if abrasion of the main aggregate is stopped completely.
Another option is to investigate the source of the abrasion and make adjustments to the process. Can a less-abrasive cleaning tool be used? Is there a way to limit the contact of the abrading process materials with the refractory lining? Is it possible to adjust the angle between the refractory lining and the incoming airborne particulate?
A seemingly minor change in the process, with minimal cost and no downsides to the operation, can save in refractory replacement costs. When changes to the process are not an option, it is best to consider the abrasion resistance of the lining as a whole and select a specifically designed abrasion-resistant solution. A qualified, knowledgeable refractory solution expert with genuine experience will help you make the best decision for your specific application, taking into consideration the following:
Speed of installation
Service life
All-in price
Fig. 2. Airborne particle matter has contributed to the abrasion damage seen in the refractory of a thermal-oxidizer choke ring. Notice on the left side of the photo how the abrading of the refractory lining becomes worse.
Abrasion-Resistance Testing
The most common measure of holistic abrasion resistance used to compare refractory solutions is the ASTM 704 test. This test exposes refractory lining materials to a stream of abrasive particulate that cause a portion of the sample to be abraded over time. By keeping sample size and shape constant – along with particle velocity, particle material and test duration – various refractory materials can be compared on an apples-to-apples basis.
This testing can be performed by any qualified refractory testing lab and most reputable refractory manufacturers. Test results are recorded based on the volume of material lost from the sample during the test and are reported in cubic centimeters. Products with excellent abrasion resistance consistently test at 5 cc of loss or less, while elite materials can score less than 3 cc of loss.
Products designed specifically for abrasion resistance will report ASTM 704 results on their material technical data sheets. It is important to remember that the abrasion-loss numbers reported on material technical data sheets are based on samples prepared in a lab under controlled conditions. Achieving these same properties in the field under real-world, job-site conditions would require a high-quality refractory installer partnered with a world-class refractory manufacturer.
Fig. 3. Severe conditions lead to abrasion damage in the refractory lining of this dry-ash hopper. Notice the abrasion damage goes past the anchor line, leaving the bottom-left anchors exposed.
Conclusion
The thinning of a refractory lining due to abrasion is a source of frustration for many thermal-processing operations and is one of the most common modes of failure encountered in the refractory world. But, by taking the time to understand the failure mechanism and learn about the options available, you can realize significant savings by avoiding needless costs in the future.