The heat treating industry has been closely watching federal energy and environmental policy shifts under the new administration. In this guest column, Michael Mouilleseaux of Erie Steel, Ltd. explores how executive orders, new legislation, and the potential rescission of the 2009 EPA Endangerment Finding are shaping the industrial decarburization landscape — and what heat treaters must do to ensure lasting, practical policy change.
This informative piece was first released inHeat Treat Today’sOctober 2025 Ferrous & Nonferrous Heat Treatments/Mill Processing print edition.
In previous articles for Heat TreatToday (March, April, June 2024), we described the Biden Administration’s efforts to restrict greenhouse gas emissions (GHGE) from U.S. industry in general, and the heat treating industry in particular.
Their Industrial Decarburization Roadmap established regulations requiring an 85% reduction in GHGE by 2035 and net zero (GHGE) by 2050. This was to be achieved through the unproven technologies of low-carbon fuels, carbon capture technology, and ultimately (green) electrification. Keeping in mind, heat treating represents 0.04% of total U.S. GHGE.
We estimated the prospective cost of energy to our heat treating community be six to fifteen times the current cost, noted a reduction in our energy security, and referenced the plight of German industry with its nine times reduction in output in the last seven years as the template for our future.
Where Are We Today?
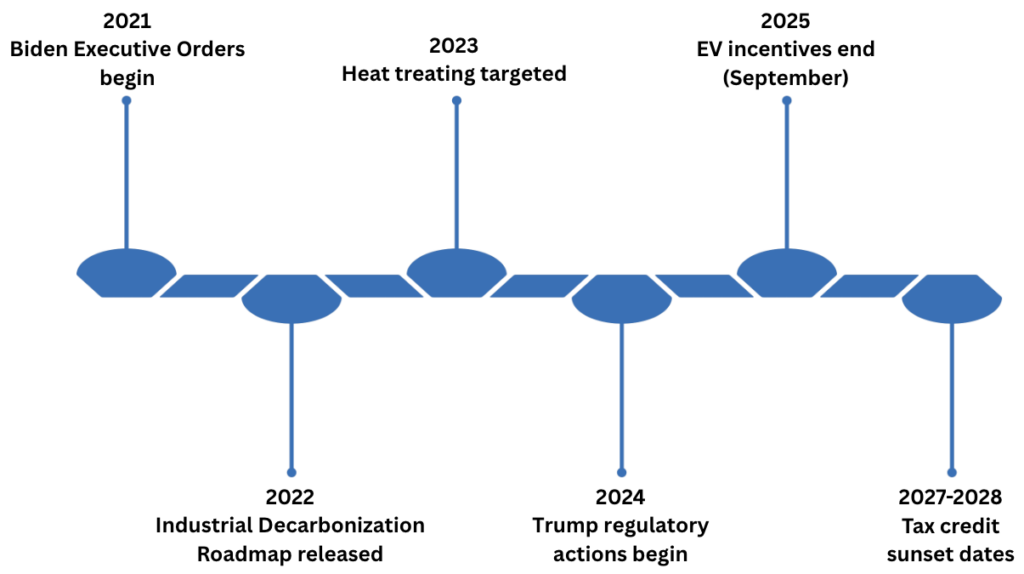
In January 2025, the Trump Administration issued several executive orders (EO) rescinding previous EO regulations related to industrial decarbonization and terminated the funding for decarburization projects. (Read more in my February 2025 print column.)
On July 4, 2025, the DOE cancelled tax credits for clean energy, carbon capture technology, clean hydrogen production, and the advanced manufacturing production credit for both solar and wind energy through the One Big Beautiful Bill (OBBB). More than six programs were cancelled or defunded, including the DOE Office of Clean Energy Demonstrations and the Greenhouse Gas Reduction Fund.
In August 2025, the EPA initiated the effort to revoke the holy grail of decarbonization, the 2009 EPA Endangerment Finding. This finding has provided the rationale for the regulation of GHGE, even though GHGE was never specifically stipulated in the Clean Air Act of 1970.
Where Are We Headed?
The revisions achieved through EOs are decisive, quick, and have provided immediate relief. The revisions achieved through the OBBB are more comprehensive but have time horizons of less than ten years. Neither are permanent, and the former are as fleeting as the next presidential election. Permanence can only be achieved through legislation, and we must hold our elected federal officials in both the House and Senate accountable. We need them to pass legislation that codifies a practical environmental policy that achieves the goals of clean air and clean water utilizing proven technology within an achievable timeframe.
The rescission of the 2009 EPA Endangerment Finding offers the opportunity to change the regulatory landscape; however, it will be difficult work and will require a protracted multi-year effort. This effort will need to pass the rigors of the Administrative Procedures Act that make the threshold for changing an existing regulation higher than that for the formulation of a new regulation. The scientific basis for the original finding, although highly flawed, can only be overturned with a preponderance of scientific data that will need to be vigorously defended.
This effort will then need to successfully navigate the myriad of lawsuits being contrived by the Environmental Industrial Complex. They constitute a formidable force composed of thousands of intertwined NGOs with over $100B in assets, the ability to raise over $25B annually, and populated with partisans who believe in their cause and consider those who disagree to be underinformed.
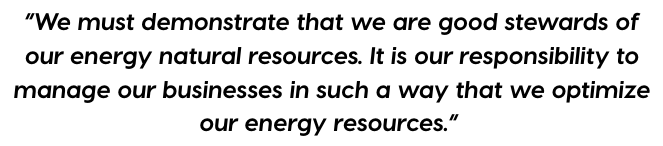
We are in a much better place than we were in August of 2024. We have clarity regarding the sourcing, security, and prospectively the cost of our energy for the near to midterm. We must demonstrate that we are good stewards of our energy natural resources. It is our responsibility to manage our businesses in such a way that we optimize our energy resources. These practices are not just good business practices because they are cost effective, but they are demonstrably the right thing to do.
We need to take advantage of the current political climate and support those in government who see us as critical to the future of American Manufacturing. Now is not the time to rest, now is the time to be heard.
About The Author:
Michael Mouilleseaux General Manager Erie Steel Ltd.
Michael Mouilleseaux is general manager at Erie Steel, Ltd. He has been at Erie Steel in Toledo, OH, since 2006 with previous metallurgical experience at New Process Gear in Syracuse, NY, and as the director of Technology in Marketing at FPM Heat Treating LLC in Elk Grove, IL. Michael attended the stakeholder meetings at the May 2023 symposium hosted by the U.S. DOE’s Office of Energy Efficiency & Renewable Energy.
In this episode of Heat TreatRadio, Doug Glenn sits down with Michael Mouilleseaux of Erie Steel Treating to examine U.S. energy initiatives and their implications for the heat treating industry. Mouilleseaux, who also chairs the Metal Treating Institute Regulatory Task Force, provides context on energy costs, emissions data, and the practical challenges associated with electrification and alternative fuels in industrial heating. The discussion explores how policy decisions affect energy reliability and day-to-day manufacturing operations, and whether current approaches align with the operational realities of heat treating.
Below, you can watch the video, listen to the podcast by clicking on the audio play button, or read an edited transcript.
The following transcript has been edited for your reading enjoyment.
Introduction
Doug Glenn: Today, we are welcoming back a guest that we’ve had on Heat Treat Radio several times: Michael Mouilleseaux from Erie Steel Treating in the Toledo, Ohio area. We are going to be discussing energy policies that are impacting captive heat treaters, commercial heat treaters, heat treating industry suppliers, all of those folks — should be a pretty interesting conversation.
Doug Glenn (host on the left) and Michael Mouilleseaux of Erie Steel Ltd (right)
Greenhouse Gas Emissions By the Numbers (2:00)
Doug Glenn: Michael has some pretty interesting statistics about pollution, sustainability, and energy. Could you share some of those stats with us?
Michael Mouilleseaux: The United States represents about 11% of the total greenhouse gas emissions — total. China represents 30%. India is almost equivalent with us. They are just under 10%. 2007 is said to be the peak year for greenhouse has emissions worldwide. Since 2007, the U.S. has reduced its greenhouse gas emissions 15%. During that time, we have increased our energy production by 45%. Obviously, we’re doing something right.
In that same timeframe, the rest of the world has increased their greenhouse gas emissions 20%. When we talk about what is it that the U.S. is doing and what more do we need to be doing — we are doing more than anyone else.
In the U.S., what are the component parts of these greenhouse gas emissions? They are transportation, electric generation, and industry, and they are all about 25% or 30%.
Heat treating as a small part of industry represents 0.3% of the U.S. greenhouse gas emissions.
Doug Glenn: Is that across all of the component parts?
Michael Mouilleseaux: That is across everything, 0.3%. And yet, we are going to have the conversation, “Why us?”
Fuel Costs (4:07)
Michael Mouilleseaux: In the U.S., natural gas costs less than $3 per million BTU. In Germany, it’s $12 per million BTU.
Doug Glenn: Which is four times the rate.
Michael Mouilleseaux: Correct, four times the rate. Now, there was a time in the U.S. when gas was that expensive, and I remember that. That was not a fun time to be in the heat treating industry.
When we say gas cost $3 million BTU and $12 million BTU, that’s the commodity cost — that doesn’t include transportation. Electricity in the U.S. for industrial customers averages a little over 8 cents a kilowatt hour. Germany is the largest economy in the European Union. In Germany, electricty costs over 30 cents a kilowatt hour.
A couple of interesting facts as we talk about what the legislation is and how it affects us: 40% of the U.S. Congress members are lawyers. Less than 2% of the members are engineers. Here, we have this highly technical discussion about clean air, thermodynamics, and these models that are used to generate the information that the industry is being held accountable for. Yet less than 2% of the members of Congress even understand it.
Learn how the DOE identified heat treating as a target for decarbonization efforts. Click on the image above to read Michael Mouilleseaux’s original analysis of what this means for the industry.
So how did this whole thing get started? It goes back to the Clean Air Act of 1970, which was a national air quality standard that named six pollutants and covered the United States only. We’re going to come back to this point because it’s significant.
In 1990, the Clean Air Act was amended by Congress, and now included 180 pollutants.
Doug Glenn: So it went from 6 to 180 pollutants.
Michael Mouilleseaux: Do we remember what the seventies were like? If you do, you can remember seeing televisions shots of Southern California — you could not see anything because the smog was so bad. So, was this legislation justified? I would say that it absolutely was.
Doug Glenn: That and the Cuyahoga River being on fire.
Michael Mouilleseaux: Exactly, so it was very important. MTI has this initiative in California. Why have we focused on a single state? It was the clean air acts in California in the 1960s that spurred the U.S. Congress to generate the Clean Air Act, which now has nationwide application.
Doug Glenn: I’ve heard it said that what starts in California spreads to the rest of the nation and the rest of the world.
Michael Mouilleseaux: It absolutely does. So we have the Clean Air Act. Secondly, in 2007 — we have gone from 1970 to 2007 — the Obama Administration made decisions based on two pieces of information: a Supreme Court ruling, and information that was generated by what’s called the IPCC, which is the Intergovernmental Climate Change Panel.
Doug Glenn: Okay.
Michael Mouilleseaux: In this panel — a highly politicized body, by the way — they came up with the information that said that with a certain amount of CO2 in the atmosphere, the earth is going to heat up. If it heats up, the solar ice caps will melt. Sea levels will rise, we are going to have monsoons. A very catastrophic scenario was presented by this panel.
Based upon that, the Obama Administration EPA had what they called an endangerment finding. Endangerment is not a scientific term, it’s non-engineering term. It’s a legal term. It means risk of harm, not actual harm, but a risk of harm. The EPA took this information and said there’s a risk of harm to the U.S. population, and as a result of that, we are going to implement legislation.
The first legislation that came down the pike was the Clean Power Plan Act. EPA mandated that the states had to regulate the CO2 emissions of the power plants. At that time, the regulation mandated that by 2030, the greenhouse gas emissions had to be reduced 30%. That’s 23 years from 2007 to 2030. It seems almost reasonable.
Doug Glenn: Just to be clear, they said you need to reduce it by 30%, not to 30%. In other words, you don’t need a 70% reduction, you just need to reduce it 30%.
Michael Mouilleseaux: Correct.
Now we fast forward to 2021, and the Biden Administration comes in, it’s difficult to describe this and not sound political, but the years are what they are, and the people that were in power are who they were — this is the result of that. In 2021, just as Biden comes into office, he issues an executive order mandating a clean energy economy.
He charged the EPA, the Environmental Protection Agency, and the Department of Energy to develop a plan to further the reduction in greenhouse gases. In effect, it affected all three segments of the U.S. economy that generate greenhouse gases. With the previous Power Plant Act, greenhouse gases had to be reduced 30% by 2030. Under the Biden Administration, that regulation was changed to an 85% reduction, and you had to have net zero emissions by 2050.
This applied to the power plants. It applied to automobiles, the transportation sector. That’s where you saw all of these incentives that are in place. There was a huge push for electric cars. If you recall, 40% of the vehicles sold by 2030 were to have been electric vehicles, and by 2050, it was supposed to be an all-electric economy. Same thought process going into play there as it applies to the industrial sector.
There were five segments of the industrial sector: iron and steel, manufacturing, chemical processing, petroleum processing, and food and beverage. All five of these segments of the industrial sector were subject to the same mandate. Thatis, that by 2030, an 85% reduction in greenhouse hases and net zero by 2050.
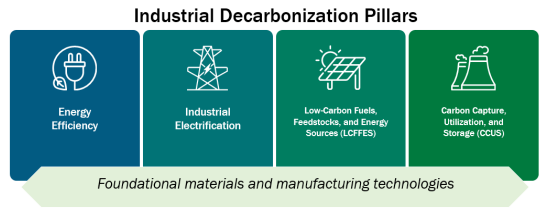
Four Pillars of Mitigation (13:09)
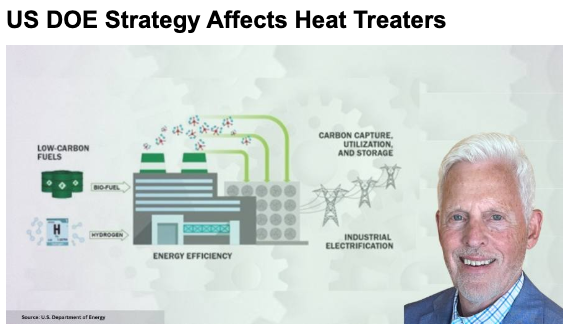
Michael Mouilleseaux: That administration came up with what they call the Four Pillars of Mitigation. The pillars of mitigation were energy efficiency, the use of low carbon fuels, carbon caption, and electrification.
Source: U.S. Department of Energy
We ask then, “Why heat treating?” As we mentioned, it’s only 0.3% of greenhouse gas emissions across the five target areas. Where did heat treating come into play? Well, there was a symposium held by the Department of Energy in the summer of 2023. In that symposium, they further defined the segments within these five areas that I spoke of, and in the iron and steel industry, they made the determination that 63% of the energy that’s used in the iron and steel industry is in process heating. Then they further segmented it, and they said heat treating is a significant sector in process heating.
Why is an industry responsible for just 0.3% of U.S. greenhouse gas emissions in the crosshairs? Click on the image above to read the full analysis.
So almost as an afterthought, heat treating got pulled into this.
Doug Glenn: Quick clarification question on that. When they talk about process heating and the iron steel, are they talking about steel making or everything downstream from it?
Michael Mouilleseaux: Both.
Doug Glenn: Okay, alright.
Michael Mouilleseaux: It’s all inclusive.
Pillar One: Energy Efficiency (14:46)
Michael Mouilleseaux: How do the mitigating pillars apply to heat treating? Let’s look at energy efficiency. I had a conversation with several furnace manufacturers and my question to them was, “if we looked at equipment that’s 20 or 25 years old and compared it today, how much more efficient is the equipment today?” We are talking state-of-the-art equipment. How much more efficient is that equipment than what we had that’s 20 years old? The answer is that the maximum would be 20%.
Doug Glenn: 20% more efficient.
Michael Mouilleseaux: 20% more efficient at maximum, not average. That’s the absolute maximum. So we’re not going to get our 85% reduction in greenhouse gases by a 20% improvement in efficiency.
Pillar Two: Low Carbon Fuels (15:40)
Michael Mouilleseaux: The next element was low carbon fuels.
Doug Glenn: That’s pillar number two.
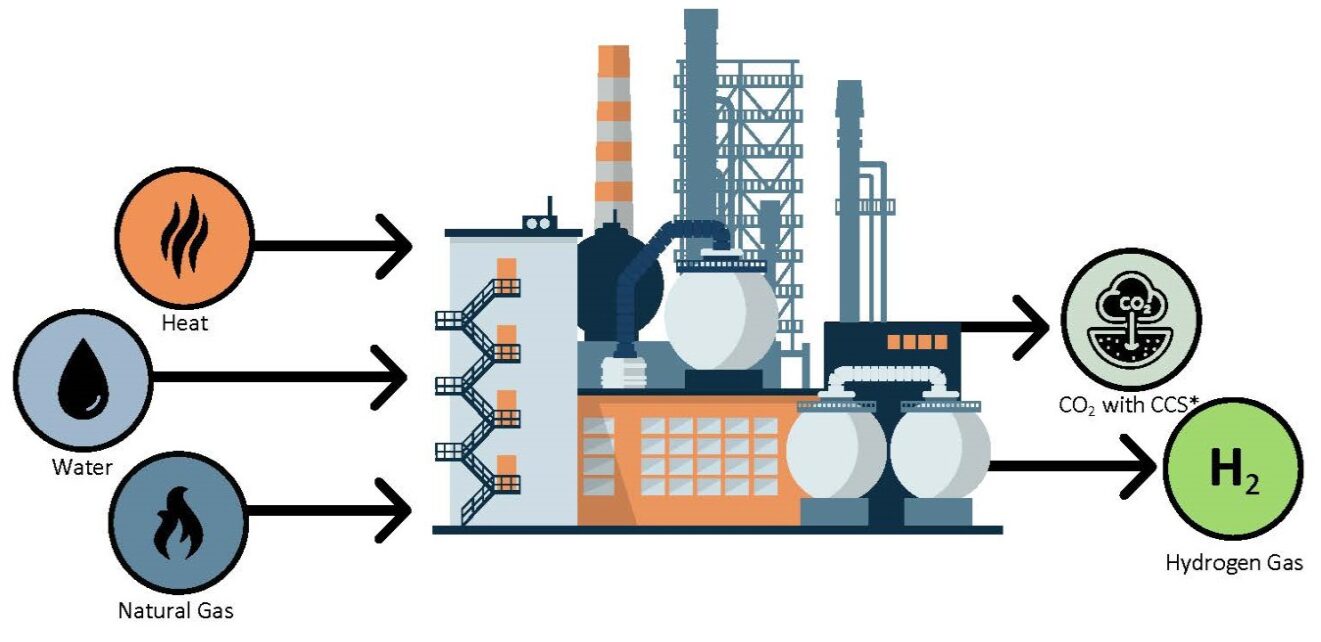
Michael Mouilleseaux: Pillar number two. After you make your way through what they were talking about — and there’s some discussion about biofuels and things of that nature — at the end of the day, it’s all about hydrogen. Their goal was to utilize hydrogen in place of natural gas as fuel source. Is that technically feasible? The answer to that is yes. Where you run into the problem is how practical is it?
Firstly, is there a distribution center, a methodology for hydrogen? Could you just put it in in the natural gas pipelines and use it? Not as they’re currently configured; it would require some work.
Steam methane reforming / Source: U.S. Department of Energy
Secondly, how are you going to generate all of this hydrogen? Today the way that hydrogen is generated is a method called steam methane reform in which you take methane, which is natural gas, and you heat it by using natural gas, and then you inject steam. In doing so, you strip away the hydrogen. Steam H2O and you strip away the hydrogen from the oxygen. The oxygen you can put back in the atmosphere, and the hydrogen you capture and that’s what you’re going to sell.
The cost of that today is about $15 per million BTUs.
Doug Glenn: Regular natural gas we said was less $3 per million BTUs. So it’s a five times increase in cost.
Michael Mouilleseaux: There we go. Now the other thing is you are using 2.5 million BTUs of methane or natural gas to make 1 million BTUs of hydrogen. So, if you’re not an engineer, you are just fine with that. But to those of us that that can do a little bit more than just add and subtract, it makes no sense. It’s nonsensical.
In addition, there are no facilities that could generate the amount of hydrogen that we’d be needed to supply industry.
Doug Glenn: You’re using two times the fuel to make it, but also, doesn’t hydrogen have like a quarter of the BTUs of natural gas?
Michael Mouilleseaux: There we go. Now the other thing is you are using 2.5 million BTUs of methane or natural gas to make 1 million BTUs of hydrogen. So, if you’re not an engineer, you are just fine with that. But to those of us that can do a little bit more than just add and subtract, it makes no sense. It’s nonsensical.
In addition, there are no facilities that could generate the amount of hydrogen that we’d be needed to supply industry.
Doug Glenn: You’re using two times the fuel to make it, but also, doesn’t hydrogen have like a quarter of the BTUs of natural gas?
Michael Mouilleseaux: There is another way of generating hydrogen, and that is electrolysis. You take water with a sufficient amount of electrical input. You can strip the hydrogen off the oxygen, you can use a membrane sieve, you can separate them out. This is a well-known, well-established method that has been done for quite a long time.
Two considerations with this method. Firstly, where does the electricity that you use come from? In this country today, 40% of our electricity is generated from natural gas. So if you are going to say that we are going to reduce the CO2 output and you’re utilizing natural gas to generate electricity, there is an issue there. The second consideration is the cost. The cost today of electrolysis-generated hydrogen is about $60 per million BTUs.
Doug Glenn: In summary, it’s $3 per million BTUs for natural gas, $15 per million BTUs for methane separated, and $60 per million BTUs for electrolysis separated.
Michael Mouilleseaux: Correct, that’s today. The industrial roadmap that the Biden Administration came up with determined we would use green energy — wind turbines and solar panels. We all know that those energy sources are free because the wind blows for nothing and the sunlight comes out and graces us with its presence every day. The administration wanted to get a million BTUs of hydrogen, and the cost of that to be half of what the current cost of natural gas is.
Doug Glenn: Which would mean about a dollar and a half.
Michael Mouilleseaux: If that isn’t irrational exuberance, I don’t know what is.
Doug Glenn: You’re right.
Pillar Three: Carbon Capture (21:16)
Michael Mouilleseaux: The third pillar is carbon capture. Carbon capture is a technology where you would take the CO2 that’s emitted from a combustion process or other processes, and in utilizing molecular sieves and such, you would trap that. Sometimes they will generate dry ice out of it. Other times, you might just inject it into the into the crust of the earth. Today there are 54 carbon capture operations operating worldwide. Worldwide. In the United States, it’s less than 10. All of these things have to do with petroleum processing. They’re taking natural gas wells, let’s say, and burn the natural gas. This will generate the energy that can be used to generate these sequestration efforts. That’s how it’s paid for.
There is nothing available today on a level that you would be using in a heat treating operation. The carbon capture plants take up acres. This is not a small confined operation.
Doug Glenn: So once again, doable but not practical.
Michael Mouilleseaux: Correct.
Pillar Four: Electrification (22:57)
Michael Mouilleseaux: The last pillar is electrification. We all know there are electric furnaces today. We have had many presentations by furnace manufacturers over the years. Most recent that I have seen is that an electric furnace equivalent to a gas fired furnace probably costs 10% less.
You might make the case that the maintenance on that would be less because you don’t have as many moving parts and gas trains, etc. But the operating cost might be three or four times what the operating cost is for a gas-fired furnace. As such, it’s an economic issue.
Doug Glenn: Why do we say three to four times the cost? Is that based on the cost of electricity?
Michael Mouilleseaux: The cost of electricity, yes. It’s three or four times as much. We talked about the fact that the average cost of industrial electricity is around 8.5 cents in the U.S. It varies from 5 to 25 cents. We are just looking at the average.
In addition, if you take all of the gas-fired equipment in this country and power it with electricity, how much would you need? The answer to that is that you would need a significant amount, and we do not have that amount of electricity available.
Click on the image above to dive deeper into how the Four Pillars of Mitigation impact heat treating operations. Discover the practical challenges facing commerical and captive heat treaters.
Doug Glenn: Considering that the hot topic of the day is the data processing centers, they are going to be sucking up a lot more electricity than we have even now. So it’s not like the electricity is going to be readily available within the next five years or so.
Michael Mouilleseaux: Precisely. You look at these data processing centers and predominantly they are using natural gas-fired turbines to generate the electricity for them. Many of them have their own power plants. They have micro grids. There are two or three of them that have made applications to the NRC to use small modular nuclear reactors. These individuals are from Silicon Valley who typically have been green. Yet they recognize that green is not going to be the key to success.
Even in their case, the practicalities of dependable cost-effective power trumps the need to be green or at least appear to be compliant with all of our climate requirements.
Effects on the Industry (26:06)
Michael Mouilleseaux: What are the effects that these initiatives have on industry? If you think about what we’ve discussed so far, we are talking about destabilizing our industry, as a result of trying to use unproven technologies. Other than electric-powered furnaces, none of these methods currently exist today, either on a scale or are cost effective, that we could use to replace the power that we use in the heat treating industry.
So when we say a five times or a twenty times increase in cost, power is typically about 10% of the cost of a heat treating operation.
Those numbers come from an annual MTI survey. We talk about what costs are involved in the heat treating operation and power is always the second or third cost. From the MTI survey, it averages 10%.
If I have a captive operation, it’s different. I happened to have some experience in the captive industry. I ran what was arguably the largest captive heat treating operation in North America, in Syracuse, New York. We had 15 multi roll pushers. To those people, would it matter if the cost of energy went up five times or more? It absolutely would. Power was a huge concern and we made many efforts in attempts to reduce the amount of power that we needed to do.
Doug Glenn: You were probably happy if you could get it down a percent or two.
Michael Mouilleseaux: Yes, and that was one of those installations where efficiency was the way that we went about doing that. When you have a heat treating operation that’s supporting a large manufacturing operation, the heat training operation is never the pinch point in getting out production. It’s always the manufacturing operations. We ran extremely inefficiently to support those operations.
We talked about destabilizing these things. The implementation schedule that we’re talking about is unrealistic — achieving an 85% reduction in greenhouse gas in 10 years and none of these technologies that we’ve talked about is going to achieve that.
It’s destabilizing because it’s unproven, it’s destabilizing because the implementation schedule is unrealistic, and it’s destabilizing because of the increase in cost.
Doug Glenn: There are some who have done this, like in Europe, for example. I believe they have moved in this direction. You were talking about the price of energy over there. What about their efforts?
Michael Mouilleseaux: I’m going to reference Germany, because Germany is 25 or 30% of the European economy. We know that their electric power is four times what it is here. We know that gas is similar. German industry is an absolute powerhouse, or at least it had been.
In recent years, subsequent to the pandemic, their economy went down. They recovered, and since then they have lost industrial output 2% to 3% per year. Right now they are 10% below where they were.
Doug Glenn: Where they were at the bottom of the pandemic?
Michael Mouilleseaux: Not at the bottom, prior to the pandemic. What are the reasons for that? In Germany, do they make the best cars? They certainly think they do. Do they have the best machine tools? They definitely think that they do. Do they have the best chemical processing plants? They definitely think that they do. I know for a fact that BASF, which is a large German chemical processing business, the last two chemical processing plants that they built were in Louisiana, and I don’t believe Louisiana is within the German Democratic Republic.
European heat treaters are already navigating these challenges. Click on the image above to read about how one German company is investing €40M in electric furnace technology for decarbonization.
When you look at that, the German Central Bank, the European Central Bank have all taken a look at these changes. They issue annual reports on the various members of the EU, and every report that has come out in the last three to four years has specifically stated that it’s the high cost of regulation and it’s the high cost of energy that has been the cause for the diminishment in German industrial output.
Doug Glenn: That’s very interesting.
Michael Mouilleseaux: Additionally, when we talk about renewables, you have to understand that there’s a risk of interruption of service. How many interruptions or blackouts have there been in California? We really don’t hear of them in this part of the country because it really doesn’t affect us. But I believe that the number of blackouts in California last year exceeded 100. W do not know the length of these blackouts, but when you have an industrial process that’s going on, it doesn’t take much of an interruption to where everything has to be reset. The potential to have damaged equipment, certainly damaged product, that has to be taken into consideration.
Let’s also consider Portugal, another European country. I believe that 70% of Portugal’s energy is generated by wind power. Earlier this year, Portugal had a two-day blackout nationwide, and it all had to do with the fact that the power is generated by a wind turbine. Neither wind turbines nor solar panels generate alternating current. They all generate direct current. You have to put it through an inverter and it has to be cleaned up. Here in the U.S. we have 60 cycles per minute. This is our alternating current. In Europe, it’s 50 cycles. There’s not a tremendous amount of variability that’s allowed in that. So when things become off cycle, it shuts down the entire grid, and that’s essentially what happened in Portugal. It took them two days to restart the country.
Consequently, there’s a cost there. I understand what the goal is. I’m just questioning the methodology and how you get there.
Doug Glenn: And the practicality, once again, the practicality of it. If Europe is teaching us anything, they’re showing us the outcomes, whether intended or unintended, of moving in that direction.
Michael Mouilleseaux: In all fairness, it’s moving in that direction too quickly. I don’t think that there are any of us who say that this goal is not admirable or that it’s not something that we want to accomplish. The question becomes how do you go about doing that?
Doug Glenn: Thinking about what’s going on nowadays, there may be different reasons why they’re moving too quickly. I could see in Europe, especially Eastern Europe, why they may be moving quickly away from gas with the whole Russia and Ukraine conflict and the fact that they get most of their gas from there. I can see that and that I would consider to be somewhat of a market effect, even though it’s based on war. It’s not something that was imposed by authorities. It’s an outcome of an event.
You can see why they’d be moving quickly that way. The rest of the country, and the fact that we’re trying to convert so quickly to electricity is self-inflicted by regulation primarily.
Recent Changes in the States (36:00)
Doug Glenn: I know there’s some changes here recently in the states. Can you discuss those?
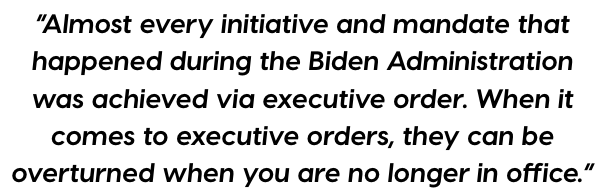
Michael Mouilleseaux: Almost every initiative and mandate that we have mentioned that happened during the Biden Administration was achieved via executive order. When it comes to executive orders, they can be overturned when you are no longer in office.
I recently looked at a paper that was done by the Institute for Energy Research, and they said that the Trump Administration, through September, had 20 regulatory actions or executive orders that were related to energy production.
Most of them overcame, overturned, rescinded what was in that industrial decarbonization roadmap. There were a couple of initiatives that were actually codified during the Biden administration. Those were codified in the IRA, the Inflation Reduction Act. In the IRA, they implemented an investment tax credit and a production tax credit concerning renewable energy. The investment tax credit relative to renewable energy gave you a 30% tax break on all investments that were in renewable energy, and the production tax credit gave you a credit for every kilowatt hour of energy that you produced.
If I have a wind turbine that’s generating 200,000 kilowatts, and I’m getting back from the government 3 or 4 cents, and I’ve purchased that equipment at 70% of what it costs, all of a sudden I have the ability to undercut what the current power plants are asking for for the power that they’re generating.
First of all, this is a tremendous displacement of capital. People are going to say, where am I going to put my money? If I put it into this and I’m buying it for 70 cents on the dollar, that’s a pretty good investment and I’m guaranteed that I’m going to get so much money from the federal government for the energy that I generate.
Doug Glenn: This is not the excess energy that you produce. It could be energy that you produce and you use. You’re getting paid by the government to produce your own energy.
Michael Mouilleseaux: This is on an industrial scale. The huge wind farms that you see — they are put in place simply to sell energy to the grid.
The other consequence is that when they are generating electricity, the base load plants using natural gas, they’re not able to sell their power. They have to curtail or shut down. The issue becomes when the wind stops blowing, or the sun is not out, where does that energy come from?
Doug Glenn: The base load.
Michael Mouilleseaux: It has to come from those base load plants. These plants are typically going to run for 80% of the time. If I can run 80% of the time, I know that I can generate this amount of power. I have these costs and this is what we’re going to sell it for. Now all of a sudden, if you’re telling me that I have to do it for 20% of the time, the cost structure changes.
These are all public utilities that are regulated not just federally, but in each state. The regulations are onerous and difficult to understand.
One of the things that you see is that for those of us that purchase power for industrial use, the peak cost of electricity has risen dramatically. The reason for that is they have to have some way that they can recapture these costs.
Doug Glenn: And make up for the fact that they’re not producing the same amount of electricity all the time.
The incentives for electric cars ended at the end of September 2025. It will be interesting to see what’s going on there. The Europeans have some experience with that. The Germans ended their tax credit and they cut the electric car market in half.
Doug Glenn: We know Elon Musk was not very happy about that.
Michael Mouilleseaux: The investment tax credit and the production tax credit were sunsetted in 2028. But by executive order, the bill did something else — it changed the eligibility requirements for the credits. Previously, under the prior administration, if you had 5% of a project completed, then you were eligible to receive these tax credits. You could have a plan and you could have a place that you wanted to do it. But you did not even need to have purchased the land, you did not need to have purchased the equipment. You just had to have a good idea and you were going to get money for it.
Policy Reversal Timeline
This changed to where the project had to be 20% completed. So now you have to have purchased land. You have to know where you are going to put it. You have to have contracts for equipment. Although the bill didn’t achieve exactly what we were hoping to see, it was successful in that regard.
The last thing this current administration has done, and it may well end up being the most significant, is that the EPA has made a plan to rescind the 2000 endangerment finding.
As we mentioned, the endangerment finding identified greenhouse gases. The original charter of the EPA named 6 pollutants, and this 2007 endangerment finding identified greenhouse gases and specifically CO2 as a pollutant. The reason that I mentioned that the original finding applied to the continental United States is that this finding, the 2007 finding, references global warming, global climate change. One of the things that they are going to use to attempt to overturn this is on the basis that the EPA has simply overreached the original charter.
It’s complicated. In 2014, the activist Supreme Court that we had at that time, did find that it was within the purview of the EPA to control greenhouse gases. On that basis, they said, we have a green light and this is what we’re going to do, and you can see what’s transpired. There was a finding by this current Supreme Court, and it was called the Major Questions Doctrine. And the Major Questions Doctrine says that a regulatory agency cannot dictate policy above and beyond what is in their original charter.
When I said that they are going to go after this agency on the basis that they’re claiming that CO2 should be controlled because it leads to global warming, that is not in the original charter. The original charter says only what happens within the United States.
In addition, the science that was used in the original 2007 endangerment finding was reviewed by this international organization, the IPCC Intergovernmental Panel on Climate. This pane did not have singular findings. They had groups of findings. It was science based upon scientific models. The panel said, if this happens, then it would lead to this amount of increase in temperature. If that happens, it could lead to this. There were scenarios within that were many and varied.
The Obama Administration chose not the average scenario, but the worst case scenario. Based upon the worst case, this has been done. The current administration is reviewing that science and they’re saying that there is evidence now that the models that you used did not come to fruition. That’s pretty condemning evidence in and of itself. There’s also new evidence that says that we do not have anywhere near the issue that previously thought. One thing that was never taken into consideration is the resilience of people. For example, if there’s an increase in sea level, maybe people move to higher ground.
There were so many perspectives that were never taken into consideration and we can now see how people react to their environment. That it is nowhere near the difficulty that we thought.
Doug Glenn: We are not going to stand on the seashore and drown as the water creeps up over our nose in over a five-year span. We are going to move.
Michael Mouilleseaux: Having said that, this rescission process is going to take two or three years. The environmental industrial complex is going to do everything within their power to make sure that legally that this doesn’t go through.
Get the latest on how the new administration is reshaping industrial decarbonization policy. Click on the image above to read updates on executive orders and regulatory changes.
The environmental industrial complex is a 100 billion dollar industry composed of thousands of NGOs that are interlocked, intertwined, and there are a hundred thousand people that are involved in this. This is not just the guy on the street corner with a sign that says “save the planet.” This is an industry and it has all of the machinations that would go on, and their self-preservation is number one.
Doug Glenn: They are going to do all they can to maintain the level of crisis in order to keep their business afloat.
Michael Mouilleseaux: Right. If this effort is successful, this will change forever what the EPA will and will not be able to.
It’s very important. As consumers and members of this republic, it’s incumbent upon us to make sure that our representatives support this effort so that they know that, although they are up against a significant foe here, they have the support of the people.
What Can We Change in the Short Term? (50:55)
Doug Glenn: Any concept of what we need to do in the short term, over the next couple years or so?
Michael Mouilleseaux: I think that we really need to recodify the EPA charter. If this endangerment finding is overturned, that is one way that this situation could be turned around. The other would be if Congress were to revisit what the mandate for the EPA is and state it in legislation, because if it were stated in legislation, then this this finding is of no consequence at all.
Of course, the difficulty there is that you may get through the house, but you do not have a filibuster-proof Senate. That’s obviously the challenge that we face on this.
Is There a Rational Policy for Transitioning to Non-Fossil Fuels? (51:49)
Michael Mouilleseaux: Is there a rational policy for transitioning to non-fossil fuels? First of all, it’s not a question of should we do this. Global warming is a fact; there’s no denying it. The effects of global warming have yet to be determined. What climate experts do not want to tell us is that the increase in CO2 in the atmosphere also enhances farming.
Doug Glenn: It also enhances plant growth.
Michael Mouilleseaux: Exactly. That’s not something that they want to talk about at all. Climate is something that happens over a series of decades. The fact that it’s a hundred degrees today is of no consequence whatsoever or the fact that you’ve had a five-inch rainfall. Just recently in this past spring, you saw on the news that we had monsoons in Pakistan. There was flooding and people died. I happened to be old enough to remember seeing that on the news in the 1960s.
This isn’t something that’s new, the flooding of those deltas, the receding. It’s just part of the cycle of life in that part of the world.
Do renewables have a place in our power system? They absolutely do, but not as a primary source. The other thing about renewables is that, there’s an aphorism that’s used in the industry, and it’s called “dispatchable generation.” Dispatchable generation is what backs up renewable energy when it is not working.
Doug Glenn: It’s the more steady-state energy producers.
Michael Mouilleseaux: Correct. We decided we would do this with batteries. Today, for as many battery plants that have been put in place to back up renewable energy systems, there are still twice as many that utilize water pumping. You pump water to an elevation that’s higher from where there is a hydro plant. Then when you need it, you drain the water through the hydro plant and you generate electricity.
How does that work out? Let’s say I have a renewable power, and I’m going to run a pump to pump water uphill, and then I’m going to allow it to flow down. I’m probably going to have to pump it because you’re not going to get enough gravitational fall in this thing to generate this hydro plant. What are the energy losses in that? 20% or 30% or 40%? Those are the kinds of concepts that you struggle to answer, “how do you make it work?”
Doug Glenn: It’s certainly doable. How do you make it doable and practical?
Michael Mouilleseaux: If an average natural gas power plant generates 800 megawatts, and it takes up 30 acres, that’s stereotypical. 800 megawatts of wind energy takes up about 100,000 acres. That’s a 150 square miles. Some say this land can be used for something else, possibly farmland.
What you can’t use it for is grazing land because those wind turbines negatively affect the animals. I learned that in the early 2000s in Germany when I had work that took me back and forth. The Germans had onshore wind farms and they had discovered that negative effect on the animals at that point in time.
Doug Glenn: The human species also would be driven crazy by them.
Michael Mouilleseaux: Wind farms also denude the land. If you have ever been proximate to a wind farm, how do you live with it? The people that are putting these wind farms in do not live approximate to them.
That’s a wind farm. For 800 megawatts of solar, it’s 10 square miles of land, 30 acres. With the solar panels, you don’t have as much open land at that point, so it really is difficult to use that land for anything.
Final Thoughts (57:22)
Click on the image above to explore Michael Mouilleseaux’s comprehensive analysis of industrial decarbonization policy under the new administration, originally published in Heat Treat Today’s October print edition.
Doug Glenn: Is there anything else, like a near term policy, that could help us out?
Michael Mouilleseaux: In my mind, it’s all about codifying what we’ve done at this point; we cannot leave it to executive orders because those are reversible.
Doug Glenn: Right, and codifying is going to be very difficult, as you already mentioned. We could probably get it through the House at this moment, but probably not the Senate, so it’s going to be difficult.
About the Guest
Michael Mouilleseaux General Manager Erie Steel, Ltd
Michael Mouilleseaux is the general manager at Erie Steel, Ltd. He has been at Erie Steel in Toledo, OH since 2006 with previous metallurgical experience at New Process Gear in Syracuse, NY, and as the director of Technology in Marketing at FPM Heat Treating LLC in Elk Grove, IL. Michael attended the stakeholder meetings at the May 2023 symposium hosted by the U.S. DOE’s Office of Energy Efficiency & Renewable Energy.
Heat Treat Todaypublishes twelve print magazines a year and included in each is a letter from the editor. This letter is from the October 2025 Ferrous & Nonferrous Heat Treatments/Mill Processingprint edition. In today’s letter,Bethany Leone, managing editor at Heat Treat Today, shares her insights on where artificial intelligence stands in the heat treating industry nine months into 2025.
In January 2025, the heat treat industry was envisioning operational improvements thanks to leaps in artificial intelligence (AI) developments. Now, nine months later, are we still searching for AI?
Managed by AI
Daniel Llaguno, President of NUTEC Bickley
For many industry players, AI has started in the office before the furnace. This can look like creating manuals, writing emails, and reading contracts to interpret legal language.
Daniel Llaguno, president of NUTEC Bickley, calls this the early stages of AI adoption. His company has leveraged AI for onboarding and training new employees — a low-risk, high-value application.
Like many suppliers, they are exploring how AI could eventually reshape furnace development, likely on an open-loop system first (versus a closed-loop where AI receives furnace information and immediately sends back direction to the furnace controls on how to respond).
The Furnace Floor
Jason Orosz, President of Global Heat Treating Services
The next step is already visible: integrate AI into existing IIoT platforms that manage floor operations. Platforms that you may already have considered are QMULUS by NITREX, PdMetrics by Ipsen, and Edge Process Management (EPM Data) by Eurotherm, a Watlow company. These are just a sampling of advanced management systems on the marketplace, and ones that are at different stages of incorporating AI and machine learning for process optimization.
QMULUS has already deployed across all North American Heat Treating Services locations, according to Jason Orosz, president of Global Heat Treating Services. He says AI has been useful in “helping with analysis, troubleshooting, and quality control” — themes you will hear repeatedly in early AI applications.
Evolving To Meet Expectations
Michael Mouilleseaux, General Manager of Erie Steel, Ltd
What should AI integration into furnace operations look like? Michael Mouilleseaux, general manager at Erie Steel, has commented that heat treat AI should help the industry shed its “black magic” reputation. He envisions advanced analysis that could, for example, “correlate intergranular oxidation (IGO) results with furnace integrity checks (i.e., leaks), eventually establishing hard limits for allowable leak rates.”
Still, obstacles remain. “I think it’s going to be a while before commercial heat treaters can relinquish furnace control over to an AI,” Orosz added, specifically commenting on maintaining furnace parameters. This makes sense due to the need for commercial heat treaters to conform to client specifications. Rather, he says in-house heat treat operations “are likely going to be the first movers in that area since they can make their own rules.” For readers of this publication — who primarily are coming from these types of operations — that should be an encouragement: you have a key role to innovate.
Lee Rothleutner, Manager of Materials R&D, The Timken Company
One other key factor for this integration to occur within operations comes with acknowledging the heavy digital capacity that AI requires. Lee Rothleutner, manager of Materials R&D at The Timken Company, commented on this very point, writing to me that for high-quality digital data, the heat treat industry needs to commit not just to the investment but to maintaining a robust data collection and storage infrastructure. He also foresees one pathway of AI integration beyond preventative maintenance, noting, “AI applications can extend to process optimization, quality control, and energy efficiency improvements.”
What To Do Now
For successful integration of AI technology, the common denominator is that management teams are being encouraged to constantly try new ways to innovate with AI.
The first thing you need to do is open an email and send me your AI integration story. Just kidding. (Not really.)
Finally, if you are attending ASM Heat Treat 2025 this month, bring your AI to the table … literally, if you have a booth. Showcase what you’ve been doing at your location or become a part of the conversation. Lee Rothleutner, quoted above, will be participating in a panel discussion on this very topic in the afternoon of Tuesday, October 21.
The Heat TreatToday booth is #944. Not everyone is accustomed to the rapid pace of tech adoption; we want to help one another understand the risks and potential that AI brings, and your stories are critical. I look forward to talking with you.
References
Glenn, Doug, and Llaguno, Daniel. 2025. Interview by Heat Treat Today. Private recording, February.
Loepke, Mike. 2025. “Digitalization Propels Heat Treating to Industry of the Future.” Heat Treat Today 7 (8).
The heat treating industry is under pressure to reduce its greenhouse gas emissions (GHGE), and the response has been a noble effort to attain sustainability. In 2024, Heat Treat Today published a series of articles by guest columnist Michael Mouilleseaux, general manager at Erie Steel, Ltd., regarding the U.S. Department of Energy’s initiative related to the decarbonization of industry and its potential impact on the heat treating industry.
This update was first published in Heat Treat Today’s February 2025 Air & Atmosphere Heat Treating Aerospace print edition in response to recent changes in the U.S. administration.To catch up on previous columns by Mike, check these out: “US DOE Strategy Affects Heat Treaters“ appeared in the March 2024 Aerospace print edition; “U.S. DOE Strategy: Ramifications for Heat Treaters” appeared in the May 2024 Sustainability print edition; and “US DOE Strategy: Why the Heat Treating Industry?” appeared in the June 2024 Buyer’s Guide print edition.
As described in previous articles, President Joe Biden issued an executive order in 2021 that committed the federal government through the Department of Energy (DOE) and the Environmental Protection Agency (EPA) to reduce GHGE attributable to “process heating” by 85% by 2035 and attain net zero CO2 emissions by 2050.
These goals were to be achieved by implementing four largely unproven technologies:
Energy efficiency
Industrial electrification (using green electricity)
Adoption of low-carbon fuels (e.g., hydrogen), feedstocks, and energy sources (LCFFES)
Carbon capture, utilization and storage at the generated source (CCUS)
On www.heattreattoday.com/factsheetDOE, you can utilize the one-page resource to let governmental officials know what our industry is, who we are, who we employ, and the effect this effort has in regulating us out of business.
We further described the negative effect the implementation of these efforts would have on the heat treating industry — specifically, an increase in energy costs from 4x to 15x, with a companion reduction in energy reliability. This is not the combination that portends success in business.
In November of 2024, the people of the United States made a statement. They decided the direction of the country for the past four years was not what they wanted and chose another path, a path they chose based on what they had experienced from 2017 through 2020. As it pertains to industrial policy, they knew that reduced regulation and policies favorable to business growth were the guiding principles.
What may we reasonably expect from a Trump administration relative to this Industrial Decarbonization Effort?
At a minimum, we should expect a sober understanding of the issues and agreement that any low-carbon replacement energy technologies will come with the assurance they are cost competitive with current sources, and that they will be reliable and secure.
Is this to say that all efforts toward the achievement of a reduction in greenhouse gas emissions (GHGE) should be abandoned? Absolutely not, however, they should not be implemented with a religious zeal that places implementation above practicality. We need to recognize that if our way of life is to be maintained, these changes will be evolutionary — not revolutionary.
Should we anticipate this effort to revise the “timing” of GHGE reductions will be easy to achieve? It will not; the Biden administration has made every effort to obligate a maximum amount of the funding from the IRA earmarked for “clean energy,” understanding any funds not so obligated can be rescinded. Additionally, a concerted effort to place these funds in Republican states was made to make any recission as politically painful as possible for the incoming administration.
The incoming administration has made it clear they will scrutinize all existing funding sources that support those clean energy initiatives that distort and undermine energy independence and reliability. They have stated they intend on immediately pausing all regulatory activities until they have the opportunity to review them. They intend on rescinding all executive orders that further the clean energy agenda.
Do we have a part in this? Yes, our industry, although crucial to the manufacturing community and national security, has very little visibility. Now is the time to act and to let our representatives and senators know how important it is to pause, if not reconfigure, this Industrial Decarbonization Initiative to assure our businesses remain vibrant and vigorous.
Attend the 2025 SUMMIT to find out more about the DOE’s actions for the heat treat industry.
About the Author:
Michael Mouilleseaux General Manager Erie Steel, Ltd
Michael Mouilleseaux is general manager at Erie Steel, Ltd. He has been at Erie Steel in Toledo, OH since 2006 with previous metallurgical experience at New Process Gear in Syracuse, NY, and as the director of Technology in Marketing at FPM Heat Treating LLC in Elk Grove, IL. Michael attended the stakeholder meetings at the May 2023 symposium hosted by the U.S. DOE’s Office of Energy Efficiency & Renewable Energy.
Industry experts agree: 2025 is a year of significant, high-tech developments. In this Technical Tuesday, hear from three heat treat industry consultants on current and incoming technological advances, from miniaturization and customization to artificial intelligence.
Michael Mouilleseaux, general manager at Erie Steel, Ltd, opens the discussion by asking what role AI has in a perfect world of heat treating; Thomas Wingens, president of Wingens Consultants, predicts six major technologies to look for in 2025; and Dan Herring, a.k.a. The Heat Treat Doctor® and owner of The HERRING GROUP, Inc., points out how the trend toward smaller is affecting the heat treat industry.
This informative piece was first released inHeat Treat Today’sJanuary 2025 Technologies To Watch in Heat Treating print edition.
AI’s Place in Heat Treating?
by Michael Mouilleseaux
The benefits of AI are purported to be the ability to reduce the time required to complete complex tasks, such as data analysis, while reducing human error and providing both unbiased decision making and data-driven system enhancements … and by the way, it can operate 24/7 without breaks!
Does AI have a place in heat treating?
Here’s what I would want my heat treat AI (HT AI) to be able to do with a gas-fired atmosphere furnace.
Combustion System:
My HT AI will continuously monitor the free oxygen of all the burners and keep them at a perfect ratio, thereby optimizing performance and gas consumption. It will track these changes and provide analysis of any trends that it “perceives,” so to speak.
My HT AI will continuously monitor combustion air pressure and message me in time to have the air filters changed before it affects performance. It will track this and provide historical and prescriptive information.
My HT AI will periodically perform a “tube check,” whereby it will shut off combustion in a tube and monitor the free oxygen, recognizing that any diminishment from “atmospheric” O2 levels indicate the potential of a tube leak. It will track this and provide analysis of any trends that it perceives.
My HT AI will track when system thermal stasis is achieved, monitor gas consumption for each discrete heat treat cycle, provide analysis of trends that it perceives, and recommend thermal cycle changes to optimize these cycles.
My HT AI will facilitate the optimization of the critical human assets in process engineering, product quality and equipment maintenance.”
Michael Mouilleseaux
Atmosphere Control System:
My HT AI will continuously monitor the atmosphere flows required to achieve the requirements for each heat treat cycle. It will track “atmosphere recovery” and provide analysis of any trends that it perceives (i.e., increased usage as a precursor to a furnace leak).
My HT AI will periodically perform a furnace check, whereby it compares the composition of the Endo gas in the furnace to that exiting the generator, providing a measure of furnace integrity. It will track this and provide analysis of any trends that it perceives.
My HT AI will confirm “tube check” data (see above) with atmosphere usage to evaluate its potential effects on process integrity and make actionable recommendations. It will track these incidents and provide analysis of any trends that it perceives.
My HT AI will provide assurance of system performance and actionable information.
Shoot for the Moon:
My HT AI will have the unique ability to integrate metallurgical results with process information and thereby provide the ability to optimize the heat treating process AND metallurgical results.
My HT AI will allow me to input material chemical and hardenability data and, by comparing actual results with the calculated, or prospective results, provide confirmation of the thermal and quenching segments of the process.
My HT AI will be able to correlate IGO results with furnace integrity checks (i.e., leaks) and over time establish hard limits for allowable leak rates.
My HT AI will be able to correlate actual retained austenite levels in carburized case with furnace carbon potential and make data-driven process modifications to optimize this.
My HT AI will be able to correlate the shape of the case depth curve with the carburizing cycle and the material type, and it will make data-driven process modifications to optimize this.
My HT AI will have the ability to develop new heat treat thermal cycles specific to my furnaces extrapolated from existing data.
My HT AI will provide a level of system performance heretofore not achieved, that not only assures adherence to established standards but provides a clear path of continuous improvement via data analysis and actionable actions. Product results will be validated by total process control, and total process control will assure attainment of product results.
My HT AI will facilitate the optimization of the critical human assets in process engineering, product quality and equipment maintenance.
In short, my HT AI will afford the heat treating community the ability to finally jettison the mantle of “black art” and join the community of high-tech engineered processes.
About the Author:
Michael Mouilleseaux General Manager Erie Steel, Ltd
Michael Mouilleseaux has been at Erie Steel in Toledo, OH, since 2006 with previous metallurgical experience at New Process Gear in Syracuse, NY, and as the director of Technology in Marketing at FPM Heat Treating LLC in Elk Grove, IL. Having graduated from the University of Michigan with a degree in Metallurgical Engineering, Michael has proved his expertise in the field of heat treat, co-presenting at the 2019 Heat Treat show and currently serving on the Board of Trustees at the Metal Treating Institute.
2025 will be the year of invention and application. There are six major technologies to be looking out for: AI management software, giga casting for the EV industry, high-pressure quench furnaces, thermal processing specialty materials, processing for steel enrichment, and practices for cleaning consistency.
AI Management Software
Some new heat treat shop management software is now available. It utilizes artificial intelligence to save labor while documenting all processes in real time. The software easily adapts to the way we work and is much easier to learn and implement than the software of the past. I see this as the number one investment item for commercial heat treaters in 2025, as it is the cheapest and easiest way to automate with a great ROI while increasing quality and customer service.
Giga Casting
With Tesla as the main driver, very large so-called “GIGA” H13 aluminum dies of 3 to 8-ton weight have really taken off in the last years, in particular for new electric car models, and the demand for very high pressure quench furnaces is increasing in the U.S. (more to come in a later article).
Vacuum Oil Quenching
However, even with the most advanced designs and high-pressure efforts, gas quenching with nitrogen has its limits, and the use of helium is not considered anymore because of its immense cost, even with a recycling system in place. Vacuum oil quenching has become a viable alternative in recent years not only in combination with LPC (low-pressure carburizing) but also with the use of materials like AISI 52100 that would be typically heat treated in atmosphere integral quench furnaces but show lesser distortion with the variation of pressures over the oil bath, which can shift the oil boiling phase peak to lower temperatures (e.g., from 650°C (1200°F) at atmospheric pressure to 400°C (750°F) at 1 mbar pressure). Some new modern vacuum oil quench furnace designs have recently entered the market, showing excellent surface cleanliness and distortion results. Aside from the better quality, they offer a much safer, cleaner and more pleasant work environment.
Specialty Materials
In general, we see a higher demand for the thermal processing of specialty materials; for example this is seen with the hydrogen decrepitation of titanium, tantalum, niobium, or rare earth element materials, powder processing or sinter processes, and surface diffusion processes.
Steel Enrichment
Enriching stainless steel with nitrogen is not new, but it is gaining momentum and more applications. One method for\ low-temperature processes on austenitic stainless steels around 370°C (690°F) is called S-phase case hardening, and the high temperature version around 1100°C (2010°F) is called solution nitriding. Both processes were initially established in the early 90s in Europe but seem to be gaining momentum and more comprehensive applications worldwide over the last years.
Figure 1. For 2025, “We see more fully enclosed vacuum solvent cleaning in heat treat shops to ensure a higher standard and consistency of the surface cleaning results compared to the fading of water cleaners.” – Thomas Wingens, WINGENS CONSULTANTS
Cleaning Consistency
Speaking of surface processes: The cleaning of components has been a thankless process, especially in commercial heat treatment, as it is seen as a necessity that is not necessarily paid for by the clients but is necessary to have uniform dissociation on the surface of a part to ensure a uniform case (e.g., nitriding case). There are well-defined standards for temperature uniformity and hardness testing, but cleaning consistency needs to be addressed, as it can be very impactful. We see more fully enclosed vacuum solvent cleaning in heat treat shops to ensure a higher standard and consistency of the surface cleaning results compared to the fading of water cleaners.
About the Author:
Thomas Wingens President WINGENS CONSULTANTS
Thomas Wingens has been an independent consultant to the heat treat industry for nearly 15 years and has been involved in the heat treat industry for over 35 years. Throughout his career, he has held various positions, including business developer, management, and executive roles for companies in Europe and the United States, including Bodycote, Ipsen, SECO/WARWICK, Tenova, and IHI-Group.
Everywhere we turn today, the products we use are getting smaller, more compact and more powerful. This is true across all industries, from aerospace to automotive, from medical to electronics, and from energy to semiconductors to name a few. Today, miniaturization, portability and customization have become major design objectives for almost all manufacturing segments.
These trends are irreversible and are, or will be, found even in the most unlikely of places — both in mining of resources taking place deep under the ocean floor and eventually on other planets. The key question then becomes, how will all of this influence our heat treating operations?
Miniaturization, Portability and Customization Today
Given the ever-increasing demand for higher performance in a smaller footprint, we have often focused our energies on taking existing products and adapting them for use. But in the long term, this is not sustainable. For example, not only is gear noise reduction critical in our submarines, but the medical and robotics markets are continuously searching for smaller, more efficient, more application specific and more intelligent drive systems and motors with increased torque density.
Heat treatment will experience a metamorphosis and emerge more broadly as thermal treatment. The age of metals as we have known it has become the age of materials: ceramics, composites, powder materials, glasses, polymers, fiber-reinforced plastics, and even nanomaterials.
Dan Herring, The Heat Treat Doctor®
Another example, although not new, is miniaturization in vehicle electronics, especially as it relates to data collection where demand is high for smaller, more powerful and, yes, cheaper components. Integration into the electronic control units via on-board power systems has seen the need for more cables in vehicles and positioning connectors, which means more contacts/connections on the electronic components without significantly increasing the installation space.
Similarly, there is a huge demand for portability. This is true not only in our electronics (just think about how cell phones or computers have changed over the last ten years), but there is a growing need for portable medical devices so that medical care can be brought to the patient rather than the other way around. For example, longer battery life and lighter weight are critical for devices such as portable oxygen concentrators.
What Does This Mean for the Heat Treatment Industry?
Looking ahead, we will see both short and long-term changes to our industry. Happening today and continuing in the near term, heat treaters are working closer than ever with design and manufacturing engineers as they focus on products that reduce environmental impact, are produced at lower unit cost, and with improved part quality. Still, the era of mass recalls must come to an end. And the cost of heat treating is less than it was even a decade ago. But as manufacturing demand evolves due to consumer expectation, process and equipment flexibility will become keys to meeting the highest quality standards in an on-demand world.
Historically, changes in the heat treat industry has been evolutionary and incremental in both nature and effect. There have been notable exceptions such as the invention of the oxygen probe or low pressure vacuum carburizing. But to meet the manufacturing demands of the future, change will need to be more revolutionary and abrupt in nature, a game changer.
Given the ever-increasing demand for higher performance in a smaller footprint, we have often focused our energies on taking existing products and adapting them for use. But in the long term, this is not sustainable. For example, not only is gear noise reduction critical in our submarines, but the medical and robotics markets are continuously searching for smaller, more efficient, more application specific and more-intelligent drive systems and motors with increased torque density.
Dan Herring, The HERRING GROUP, Inc.
Heat treatment will experience a metamorphosis and emerge more broadly as thermal treatment. The age of metals as we have known it has become the age of materials: ceramics, composites, powder materials, glasses, polymers, fiber-reinforced plastics, and even nanomaterials. As a result, we will find ourselves needing, for example, to expand our heat treat capability and equipment to deal with such items as process temperature ranges from -200°C to 1850°C (-330°F to 3360°F) or greater or at pressure/vacuum levels heretofore only achievable in laboratories or specialty applications.
As product sizes decrease, load sizes will become smaller out of necessity. And as a result, our heat treat equipment must be small lot capable with tighter controls to achieve higher quality along with tremendous process flexibility.
Final Thoughts
History’s enduring legacy is that change is inevitable. Just think back to how the heat treatment industry has evolved, from the campfire to the blacksmith to the modern heat treater, from the artisan to the era of mass production, from the art of heat treating to the science of heat treatment. The lesson is that to adapt, one must constantly innovate and invent. Miniaturization, portability and customization in whatever form they take are here to stay. Perhaps even teleportation (the ultimate miniaturization?) isn’t that far off after all, considering flight was unheard of a little over a century ago.
About the Author:
Dan Herring (The Heat Treat Doctor®) The HERRING GROUP, Inc.
Dan Herring has been in the industry for over 50 years and has gained vast experience in fields that include materials science, engineering, metallurgy, new product research, and many other areas. He is the author of six books and over 700 technical articles.
In this episode of Heat TreatRadio,Doug Glenn and guest Michael Mouilleseaux, general manager at Erie Steel LTD, continue their discussion of case hardness, delving into the hardening ability of materials, focusing on case hardening and effective case depth. Michael explains the differences between total and effective case depth, the impact of core hardness, and the role of material chemistry. They also discuss practical applications for heat treaters, emphasizing the importance of understanding material properties.
Below, you can watch the video, listen to the podcast by clicking on the audio play button, or read an edited transcript.
The following transcript has been edited for your reading enjoyment.
The Influence of Core Hardness on Effective Case Depth Measurement (01:03)
Doug Glenn: Today we are going to talk about a pretty interesting topic, and some interesting terminology, that has to do with hardness and hardenability of metals. For people who are not metallurgists, this may seem like a strange topic because isn’t all metal hard?
But we are going to talk more in depth about hardness of metal, hardenability of metal, and effective case depth. What we want to do is get a run down on the influence of core hardness on effective case depth measurements.
Michael Mouilleseaux: We are going to get a little bit into the weeds today on some things specific to metallurgy.
Those who are involved in high volume production carburizing know that consistency of results is extremely important. It is not just important in that we have the process centered in that the results are that way, but ultimately it has something to do with the dimensional control.
Specifically with gears, if the output from the process is not consistent, then one of the things that is going to suffer is going to be the dimensions. So, we’re going to be talking about effective case depths today.
Effective Case Depth vs. Total Case Depth (02:23)
Effective case depth is a little bit different from total case depth. Total case depth is the total depth that carbon is diffused into a part. That is very much a function of time and temperature. And there are some nuances with grain size and alloy content, but it is essentially a time and temperature phenomena.
Effective case depth vs total case depth (02:59)
Effective case depth is a little bit different. If we look at this graph, the x axis is the distance to the surface, and the y axis is hardness in Rockwell C.
If you look at the green line, this is a micro hardness traverse of a carburized part. It tells us many things. If you look at the left-hand side of the line at .005 in depth, the hardness there is 60 Rockwell C. Then it diminishes as we go further into the part: 0.010, 0.020, 0.040, 0.050.
We get to the end of that line, and we see that is the core strength. The core is a function of the material hardenability.
So, what is the effective case depth? If we look at the second vertical blue line on the right, it says “Total Visual Case.” So that’s exactly what that is. If we were to look at this part and etch it — I am presupposing that everybody understands that we would section the part — we would mount it, we would polish it, and then we would look at it in the microscope at 100x. Then, we would see a darkened area, which would be the total depth of carbon diffusion into the part. That is not a function of the material grade; there are some nuances there.
But the effective case depth is a measurement. And in North America’s SAE Standard J423, we say that we measure the case effective depth to Rockwell C 50. The surface hardness is 60, we measure the hardness in increments, and when we reach this hardness the depth that hardness achieves is 50 Rockwell. That is the effective case depth. If we look at the core hardness on that part, we can see that on this particular sample it is somewhere between 45 and 50.
Finding Material Hardenability (05:17)
Hardenability band graph (14:26)
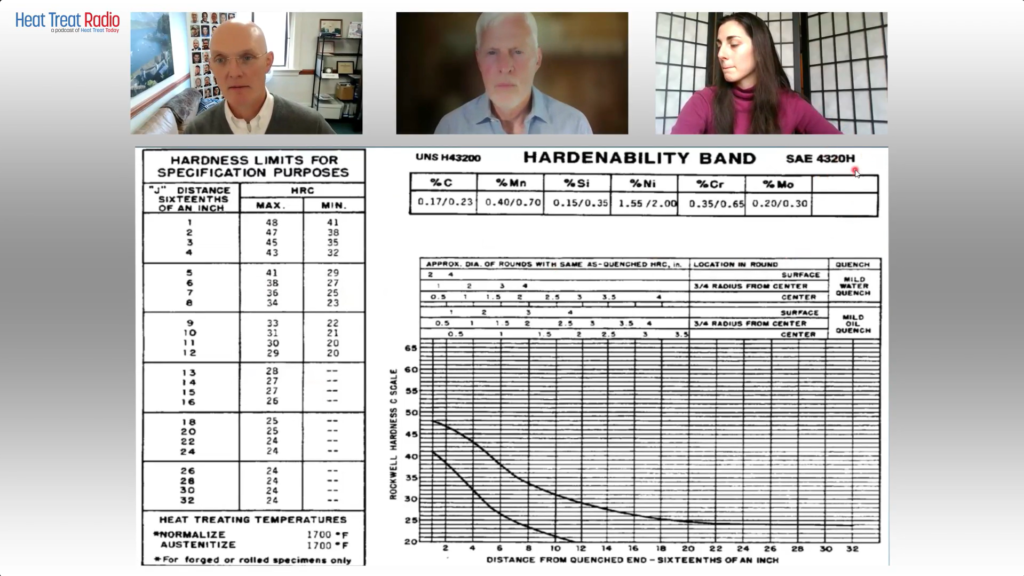
What causes this core hardness? It has to do with the hardenability of the material.
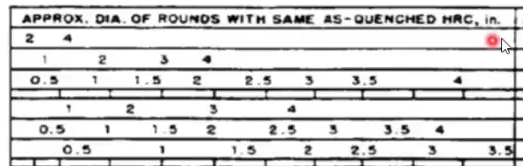
Here we are looking at an SAE chart J1268. It is for H band material for 4320, a common gear material. This tells us a lot. It has the chemistry on it, below that it has some information for approximate diameters, and then it has, on the far right side of the diameters, we see specs for cooling in water or cooling in oil.
And between them there is the surface, the three-quarter radius, and the center. If we look at the surface of an oil quench at two inches, it has a distance from the surface of something like 4 or 5. So, if you go over the chart on the left-hand side, go to 4/16” or 5/16”, which has an HRC of 29 to 41. Even though this is a hardenability guaranteed material, for a two-inch round you would expect to have something between 29 and 41 for the surface hardness.
Now let’s look at what you would get at three-quarter radius in an oil quench. If you look at two inches, the Jominy position is [eight]. You can see that at three-quarter radius on a two-inch bar, that is an inch and three quarters, I believe, the hardness is going to be something between 23 and 34. In the center of that bar for a two-inch round, it is going to be J12, which has a hardness of 20 to 29.
That is the definition of hardenability. It is the depth that a material can be hardened. And it’s totally a function of chemistry. Davenport and Bain did the algorithms for this in the 1920s leading up to World War II.
Effect of Core Hardness (07:20)
If we are going to evaluate the effect of core hardness, we are going to look at parts that are heat treated in the same furnace to the same cycle in the same basket under all of the same conditions — the only thing different is going to be the hardenability of the material.
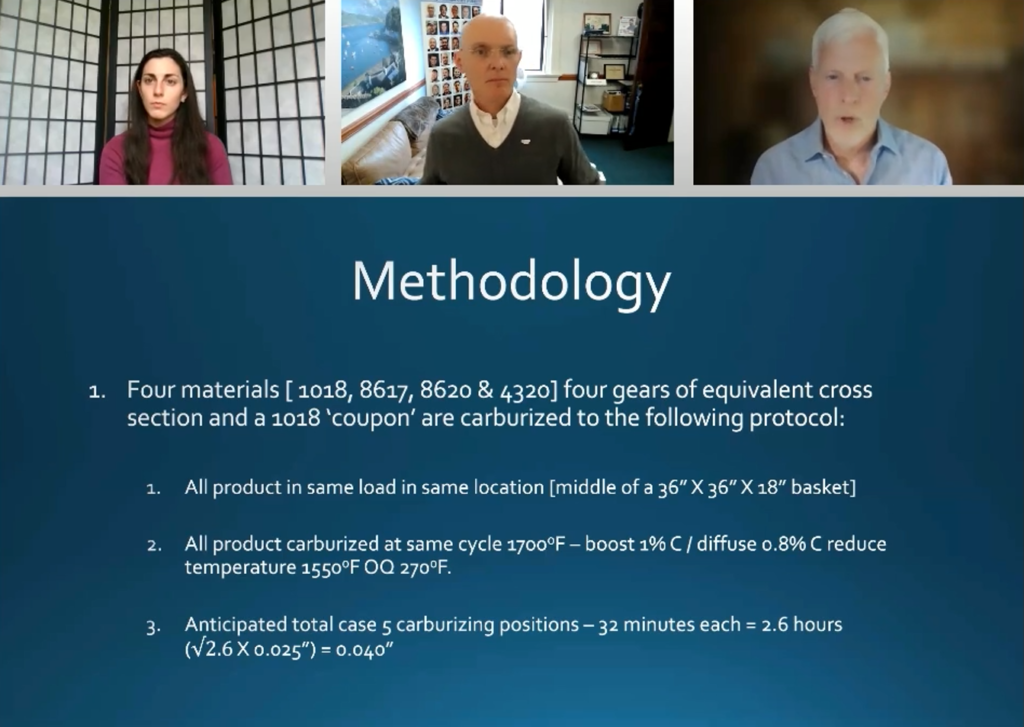
Methodology Slide (07:37)
Go all the way down to number three on this “Methodology” slide. The anticipated total case is going to be about 0.040 for all of these samples.
Hardenability samples measured (08:43)
This data graph has four samples on there. The red line is the measurement of Rockwell C 50. If we look at the highest hardenability sample, the blue sample has the highest core hardness and also the deepest effective case depth. And as the core hardness is reduced, you can see that where the line crosses the plane of Rockwell C 50, that is reduced as well.
Doug Glenn: Am I correct in thinking the yellow line here at the bottom has the lowest core hardness or hardenability?
MichaelMouilleseaux: Both. You’re correct.
Doug Glenn: That’s why it is crossing the red line much earlier than the others.
Michael Mouilleseaux: Yellow also has the lowest effective case depth.
Tabular data (10:22)
If we look at this in a tabular form, this is the data, and what you looked at were the microhardness traverses, per the standard using an MT-90: the hardness was (the effective case depth was) measured to Rockwell C, the total case depth was determined visually on these things, and, you’re going to say, that Michael, you’ve got four different materials there. That is correct. We also have four different hardenabilities.
In answer to the question, if these were all the same heat, would we have these same results? We would with the exception of the bottom one at 1018. There is no way that we could take an alloy steel and reduce the hardenability of that amount.
Here is what we are talking about: We know that they were all run at the same process when we look at the total enrichment on this; it’s within the margin of error 0.038 to 0.042.
We look at the effective case depth, interestingly, we have quite a variation there. The first one has the highest core hardness at 46, and the effective case depth is 0.039. Second, we have a sample where the core hardness is 44, and the effective case depth is 0.036. Third, we have a sample where the core hardness is Rockwell C 39, and we have 0.029 effective case depth. And finally, there’s the 1018 sample that was put in there just as a reference. The core hardness on that was 24 with 0.015 effective case depth.
There is a direct proportion between the core hardness and the effective case depth that you are going to be able to achieve.
Referencing back to that hardenability chart that we looked at (the very bottom, half inch section quench in moderately agitated oil), it has a Jominy position of 3. If we look at J3 on the chart, we can see that at the lower end of the chemistry composition, we could have a core hardness as low as 35, and at the upper end of the chemistry composition we could have a core hardness as high as 45.
Tabular data (10:22)
Let’s go back to the tabular data. That column for J3 is the data that was provided to us by our client from the steel mill.
When they melt a sheet of steel, it is a high value part. So, they use what is called SBQ (special bar quality). Special bar quality is subject to a lot of scrutiny and a lot of controls. One of the things provided, in addition to things like the chemistry and the internal cleanliness in the steel certification, is the hardenability of that specific heat.
You can see that the 8620, the first line, had a J3 of 44. We actually had a 46. The way to understand that is that when you’re going to melt 200 tons of steel, 100 tons of steel, or whatever amount it’s going to be, it’s not all done at one time in a single pour. It’s multiple pours out of a tundish.
The chemistry and the hardenability numbers that you got in a steel certification is going to be very close to an arithmetic average of what you would get when they test the first pours and the middle pours and the end pours. They’re going to average out.
Applying the Data (12:44)
When we’re using this data internally, we say we want to be plus or minus two points Rockwell C within the steel certified hardenability data. I can say that experientially over the years, Gerdau, SDI, Nucor (the domestic sources of SBQ bar )are very consistent in the way they make this stuff, and this is something that we can depend upon.
You could use this as a check for what you’re doing. If the steel that you have has a hardenability of 44 and if you’re not plus or minus two, you have to ask yourself why. There are only a couple of reasons that it would be outside those limits. If it’s above you, it probably is not the heat that it’s purported to be. If it is lower, it could either not be the heat that it’s purported to be, or there could be an issue with the heat treating.
As I said at the outset, we’re going to assume in this discussion that the reason that we have these numbers — the differential and core hardness — is not attributable to heat treating; it’s solely attributable to the chemical composition of the material or the hardenability.
We can use this information if we are an in-house or captive operation and are purchasing the material. We have an opportunity to define in our purchasing practice what the hardenability of the material is going to be.
As I mentioned before, the domestic sources are very consistent in the material that they produce. To produce a heat of 4320°F that has a J3 of 40 or 42 or 44, there is no cost penalty to that (in my experience involved in a major automotive supplier). It is a definition of what you want.
They are not making heats by randomly selecting chemistries for these heats and selling them. They make a recipe for a specific client. And my experience has been that they hold very true to that recipe.
If you are introducing a lot of variation into your process, not only is the output from that variable, but the cost of handling that is variable as well. A material such as this, to specify a J3 of 42 to 44, is something that is eminently doable. My experience is that the steel companies have been able to do that over time with a great amount of consistency.
Now, for those who are not involved in high volume production and do not have control of the source of the material, this chart remains usable. If someone is running a job shop or shorter term things who does not have furnace load sizes of parts, the key is to be able to mix and match things into specific processes. At least in carburizing, if we understand what the hardenability of the material is, then we have a much better opportunity of taking multiple parts and putting them into a load and determining ahead of time whether or not we are going to have consistent results.
Just one more thing that we would like to look at here is this next graph — the Caterpillar hardenability calculator. This is available from Caterpillar, and they readily share it with most all of their suppliers. I have been involved in numerous businesses and have never been refused this. You have to ask them for a copy of it.
SAE Chart J1268, which measures hardenability band for 4320 (05:47)
Michael Mouilleseaux: Using this calculator you import the chemistry of a heat, and then it automatically calculates the hardenability of that heat.
If you recall the J3 on the 4320 material that we looked at, the hardenability guaranteed it had a ten-point range. If you look at this particular heat, and this is what we call the open chemistry, this would not be a hardenability guaranteed material. The upper limit is higher than what you would see on a hardenability guaranteed material, and the lower limit is lower than what you would see. So the variation in a “Standard SAE J 48620” is going to be much wider – it will be much different.
If we look at that same J3 position, we are looking at 25 to 45, a 20-point swing in core hardness. If we go back and revisit the results we had, 39 to 46 with a seven-point swing, we had a 0.010 difference in effective case stuff. If we had a 20-point swing, you could imagine it is going to be significantly greater than that.
Two things, if you have the lower hardenability grade of material, it allows you to modify your process ahead of time to compensate for the fact that the core hardness is going to be lower in this part. Vice versa, if you have an extremely hot heat or it is high hardenability, similarly, you may be able to reduce some time and not put as much total case on the part in order to achieve what specified as effective case.
The hardenability charts are great guides in helping to establish a process and then to evaluate the consistency of that process.
One other comment about the chart is this is not a full-blown Lamont chart, which has various quench severities for different sizes. And that can be utilized to help pinpoint this. As you can see on the SAE chart, you essentially have two different quench rates. You have mild oil and water.
There are a lot of different types of quenchants that are available. The moderate quench rate that is on this chart very closely mimics what we at Erie have been able to achieve modified marquenching. Therefore, I’m able to use this chart without any offset.
Now, if you had a fast oil — petroleum-based oil is very fast — and a heat that had a J3 of 40 in which you are consistently seeing 44 out of it, then in your specific instance, your quenchant is more aggressive than what this chart was built to simulate. However, you can continue to use the chart. It’s just that you must use your experience in doing it.
So again: The strategy to control it is getting the hardenability data so that you can utilize that ahead of time — understanding what your specific heat treating operation is and, more specifically, what your quenching operation allows you to achieve.
Then, knowing that a typical section size of X in this furnace is going to give a Jominy position of Y, you can take that information and say over time, “If I have a variation here, it’s going to be an effective case depth. Is that variation attributable to the core hardness?” If it is, there is a strategy which will possibly change and tighten up the purchasing practice. If it is attributable to something else, then that gives good information to say, “There’s something in my heat treating process that I should be looking at that is attributable for this variation in case depth.”
Conclusion (22:14)
So, we waded into the weeds, and hopefully we have found our way out.
Doug Glenn: I think that explanation is going to be especially good for those who already know a little bit of metallurgy and know those charts.
Bethany Leone: Michael, for in-house heat treaters, how often do they need to be aware of the materials coming into their operations, testing it, or asking about changes that could be happening?
Michael Mouilleseaux: Hopefully this would give heat treaters worth their salt a reason to pause if they previously assumed the material does not come into play.
The next thing would be in high valued components — gears, shaft, power transmission, those kinds of things — heat lot control is typically mandated by the end user. If you have heat lot control and the unique data that goes with that, utilizing the strategy we just talked about is going to give you the ability of evaluating variation. If the primary source of variation is the material, that needs to be addressed. If the material is very consistent and yet you continue to have variation, there is obviously something in the heat treating process that needs to be addressed to reduce that variation.
Doug Glenn: Thanks for listening and thanks to Michael for presenting today. Appreciate your work, Michael.
About The Guest
Michael Mouilleseaux General Manager at Erie Steel, Ltd. Sourced from the author
Michael Mouilleseaux is general manager at Erie Steel LTD. Michael has been at Erie Steel in Toledo, OH, since 2006 with previous metallurgical experience at New Process Gear in Syracuse, NY, and as the Director of Technology in Marketing at FPM Heat Treating LLC in Elk Grove, IL. Having graduated from the University of Michigan with a degree in Metallurgical Engineering, Michael has proved his expertise in the field of heat treat, co-presenting at the 2019 Heat Treat show and currently serving on the Board of Trustees at the Metal Treating Institute.
In this episode of Heat TreatRadio,Doug Glenn discusses the hardenability of materials with guest Michael Mouilleseaux, general manager at Erie Steel LTD. Michael walks us through how to interpret hardenability charts and provides detailed insights on reading these charts, including addressing the importance of understanding the nuances of complicated part geometry.
Below, you can watch the video, listen to the podcast by clicking on the audio play button, or read an edited transcript.
The following transcript has been edited for your reading enjoyment.
Understanding a Hardenability Chart (01:59)
Doug Glenn: What I’d like to do is talk through this chart and learn how to read this a little bit better. And I’d like to ask questions about it because I’m not familiar with this, and I’m sure there are going to be some listeners and viewers who aren’t familiar with it. This will be just a quick tutorial on how to read these charts.
Go to the upper, right-hand corner. First off, SAE 4320H is the grade of the steel that we’re talking about?
The Heat Treat Lunch & Learn crew: Doug Glenn, Publisher of Heat Treat Today; Michael Mouilleseaux, General Manager at Erie Steel LTD.; Bethany Leone, Managing Editor of Heat Treat Today Use this chart to follow along with the conversation. Source of chart: Erie Steel, Ltd.
Michael Mouilleseaux: Correct.
Doug Glenn: Then the table right below that you’ve got percentage C (carbon). Is Mn manganese?
Michael Mouilleseaux: Manganese.
Doug Glenn: Thank you very much. Silicon, nickel, chrome, moly. My question is about those ranges. Is this basically saying the percentage carbon on the far left in 4320H goes anywhere from 0.17–0.23?
Michael Mouilleseaux: That is correct.
Doug Glenn: Okay. So that’s variability right there. All of those are basically telling you what the ranges are in those alloys in this grade of steel?
Michael Mouilleseaux: That is correct.
Doug Glenn: Then you go down to the top columns of this table below, and it says “Approximate diameter of rounds with same as quenched HRC in inches.” Right?
Approximate diameter of rounds with same as quenched HRC in inches Source: Erie Steel, Ltd.
Michael Mouilleseaux: Yeah. Essentially, the first three rows are for water quenching. And the bottom three are for oil quenching.
Doug Glenn: If you go over to the second major column called “Location in round,” what’s the size of the round we’re working on here?
Michael Mouilleseaux: It can vary. Go down to where it says, “Mild Oil Quench,” then left to “Surface,” then left then go to “2 inches.” Then, go straight down to the bottom, and that’s approximately J5. So, the “Distance from Quenched End — Sixteenths of an Inch” is Jominy position 5.
Michael Mouilleseaux: If you go to Jominy position 5 on the left-hand chart, you can see the hardness limits for that; the maximum is Rockwell C 41, and the minimum is Rockwell C 29. So, the chemistry can vary provided the hardenability at J5 is 29–41.
Doug Glenn: That’s the acceptable range?
Michael Mouilleseaux: That’s the acceptable range. That’s one way of looking at it. The chemistry would allow you to do that.
Now, go back to the chart on the right-hand side and to “Surface,” move down one row to “¾ radius from center,” and go left to two inches. Moving down from there you see that is Jominy position 8. So, the surface of a two-inch round is Jominy position 5, and the ¾ radius is Jominy position 8.
If you go to the hardness chart on the left-hand side, that says that if you had a two-inch round of 4320H, and it was oil quenched, and you check the hardness at ¾ radius, then the expectation is that it would be 23–34.
Now, go back to the same chart that we were just at, and go to the “Center” row of “Mild oil quench.” Continue left to two inches, and that’s J12. Go back to the left-hand chart, and J12 is 20–29 in the center of the part.
So, the surface of the part could be 41, ¾ radius, center of the part would be 34, and the center of the part would be 29.And that would all meet the criteria.
Doug Glenn: The maximum for J5 would be 41.But at J12 you could get a 20 in the middle.
Michael Mouilleseaux: Right. That is one way to look at this chart. But there is another way.
Notice that it says “rounds.”There are some nuances to having flats and rectangles because, if you think about it, for the cross-sectional area of a rectangle, the hardenability is going to be determined by the direction that it is thinnest, not by the direction that it is thickest.
Take a gear tooth, for example: in the chart that we just made up the gear teeth, the root of the gear was about a half inch, just slightly more; and if we go to this same chart, go to “Center” of “Mild oil quench,” and then go to a “0.5 inch,” and when you go straight down, that’s the J3.
Is a gear necessarily a round? Of course, the answer to that is no. So, in complex shapes you can use this data, but you have to interpolate it in order to understand it.
To some extent, the first time you run this, you’re going to say, “I have a gear, and the root is a half inch across. And I know that the J3 is 40. And I’ll run this part, and I’ll section it and I’ll measure it and it’s 40. And I’ll say that’s a good approximation of that.” And experientially, you build confidence in this, that is, it’s your operation, your quenching operation, and your components. It allows you to interpolate these, and they become extremely useful.
So, is it definitive? No. Is it useful? Yes.
Doug Glenn: It gives you a ballpark, right? I mean, it’s giving you something, maybe guardrails.
Michael Mouilleseaux: It gives you a ballpark; it gives you guardrails. And I can tell you that after having run gear product in the same equipment for ten years, I can say that it’s definitive. I can say that if I have this hardenability, and I get this hardenability number for this heat, and these gears are made from this heat of steel, and it has a J3 of 42. If I’m at 38, I know something is going on other than just hardenability. And, at that point, I would suspect my heat treat operation.
Doug Glenn: Yeah. I have one more question about this chart: On the bottom right part of the graph there are two plot lines on there. What do those represent? I was thinking one represented the water quench and the bottom one represents the oil quench.
Plot lines representing maximum hardenability and minimum hardenability Source: Erie Steel, Ltd.
Michael Mouilleseaux: The top one represents the maximum hardenability. And the lower the lower one represents the minimum hardenability.
Doug Glenn: That’s your band. Okay. Those are basically your values over on the left-hand side then. Very good.
I don’t know about you, but I found that helpful. I really didn’t ever know how to read these tables. So, maybe someone else will find that useful. Thanks, Michael. I appreciate your expertise.
Michael Mouilleseaux: It’s been my pleasure.
About The Guest
Michael Mouilleseaux General Manager at Erie Steel, Ltd. Sourced from the author
Michael Mouilleseaux is general manager at Erie Steel LTD. Mike has been at Erie Steel in Toledo, OH, since 2006 with previous metallurgical experience at New Process Gear in Syracuse, NY, and as the Director of Technology in Marketing at FPM Heat Treating LLC in Elk Grove, IL. Having graduated from the University of Michigan with a degree in Metallurgical Engineering, Mike has proved his expertise in the field of heat treat, co-presenting at the 2019 Heat Treat show and currently serving on the Board of Trustees at the Metal Treating Institute.
The heat treating industry is under pressure to reduce its greenhouse gas emissions (GHGE), and the response has been a noble effort to attain sustainability. In two previous articles in this continuing series, guest columnist Michael Mouilleseaux, general manager at Erie Steel, Ltd., discussed the U.S. Department of Energy’s initiative related to the decarbonization of industry and its potential impact on the heat treating industry.
The endeavor to reduce greenhouse gas emissions (GHGE), albeit noble in intent, begs the question: Why is the heat treating industry being asked to reduce its greenhouse gas emissions?
Some background:
The United States’ GHGE account for approximately 14% of the total worldwide emissions.
According to the U.S. DOE, U.S. industry accounts for approximately 23% of the total U.S. GHGE.
According to the U.S. DOE, “process heating” accounts for approximately 43% of the total GHGE generated by U.S. industry.
According to the U.S. DOE, heat treating accounts for approximately 2.8% of the GHGE they have attributed to process heating.
In sum, heat treating accounts for 0.3% of the total U.S. GHGE (23% x 43% x 2.8%), and 0.04% of the worldwide GHGE (14% x 23% x 43% x 2.8%).
Why is the Department of Energy imposing natural gas restrictions on an industry that they have calculated to be responsible for 0.3% of the country’s total emissions?
Second, this administration has spent something between several hundred billion and a trillion U.S. dollars to incentivize power, transportation, and industrial sectors in their effort to stem global warming. Years from now, we will look back at this as one of the greatest capital reallocations in our history. If we can accept that the “past is a prologue,” we have a storied history of government failures to determine the future of the agricultural, aircraft, and financial sectors. This is already happening in Western Europe: Power is substantially more expensive, and industrial output has dropped nearly 6% for the past two years — the European Investment bank attributes the reduction in industrial output to “elevated energy costs.”
Perhaps it’s time for us to take notice and slow down this effort until such a time that we have the technology in place to accomplish decarbonization without eviscerating our industrial, transportation, and power industries. A greatly overused term today is “existential threat” — but our livelihood, our national security, and our way of life are, in fact, on the line.
Attend the SUMMIT to find out more about the DOE’s actions for the heat treat industry.
On www.heattreattoday.com/factsheetDOE, you can utilize the one-page resource to let governmental officials know what our industry is, who we are, who we employ, and the effect this effort has in regulating us out of business.
I want to thank Surface Combustion, Gasbarre, and Super Systems Inc. for the guidance they provided me with in navigating the technology of this subject matter.
Any errors contained herein are mine and mine alone.
About the Author:
Michael Mouilleseaux General Manager at Erie Steel, Ltd. Sourced from the author
Michael Mouilleseaux is general manager at Erie Steel, Ltd. He has been at Erie Steel in Toledo, OH since 2006 with previous metallurgical experience at New Process Gear in Syracuse, NY, and as the director of Technology in Marketing at FPM Heat Treating LLC in Elk Grove, IL. Michael attended the stakeholder meetings at the May 2023 symposium hosted by the U.S. DOE’s Office of Energy Efficiency & Renewable Energy.
As heat treaters strive for a sustainable future, pressure mounts to make the right choices while running commercially viable operations. In this Technical Tuesday installment of a continuing series, guest columnist Michael Mouilleseaux, general manager at Erie Steel, Ltd., explores the potential ramifications of the DOE effort for industrial decarbonization in the heat treating industry. The first installment, “US DOE Strategy Affects Heat Treaters”, appeared on April 10, 2024, in Heat Treat Today, as well as in Heat Treat Today’s March 2024 Aerospace print edition.
This informative piece was first released inHeat Treat Today’s May 2024 Sustainability Heat Treat print edition.
As regulatory agencies set industrial decarbonization goals aimed at achieving net zero greenhouse gas emissions (GHGE) by 2050, heat treaters should prepare for action. But where do heat treatment technologies stand today, and what is the path going forward?
Background
President Biden’s 2021 executive order calling for a “clean energy economy” led the U.S. Department of Energy (DOE) and the Environmental Protection Agency (EPA) to develop “The Industrial Decarbonization Roadmap,” a strategic plan for reducing industrial emissions. The plan identified five sectors — chemical, petroleum, iron and steel, cement, and food and beverage production — as targets for mitigation efforts. According to “The Roadmap,” process heating operations within these five industries represent the greatest opportunity to apply what were established as four pillar technologies:
Energy efficiency
Low carbon fuels, feedstocks, and energy sources (LCFFES)
Carbon capture, utilization, and storage (CCUS)
Industrial electrification using green electricity
In May 2023, heat treating was specifically named as a target process for reducing GHGE during the DOE’s Office of Energy Efficiency & Renewable Energy’s Low Carbon Process Heating Forum.
A Closer Look at the Technology Pillars
To determine the path forward, it’s important to understand where heat treatment technology stands today regarding the four pillars.
Energy Efficiency: Among energy efficiency opportunities are furnace insulation, controls, and burner design. According to furnace and controls manufacturers that I have spoken with, advancements in insulation and heating system controls offer less than a 20% opportunity in efficiency improvement over
LCFFES: In the U.S., the primary hydrocarbon fuel for heat treating is natural gas, which has an average (commodity) cost of $2.57/MMBTU. Hydrogen has been endorsed as the preferred replacement. Hydrogen manufacturing and distribution issues aside, hydrogen has a 2023 (commodity) cost ranging from $14.00 to $40.00 per MMBTU, and a carbon footprint of 30–130% that of natural gas. “Green hydrogen” is “under development.”
CCUS: Carbon capture, utilization, and storage is currently relegated to natural gas production operations where the captured CO2 is injected into existing wells to “enhance” production. Although the DOE suggests development of advanced CO2 capture technologies are still underway, a 2023 Congressional Budget Office report states there are “fifteen CCS facilities . . . operating in the United States . . . [with] an additional 121 . . . in development.” It is fair to state there are no CCS (carbon capture and storage) facilities currently operating on the scale of a heat treating operation.
Electrification: For electrification to be impactful, electricity must be generated via green sources. Currently, 40% of the electricity generated in the U.S. comes from natural gas, 20% from coal, 19% from nuclear, 10% from wind, and 3% from solar. It is my opinion that, regardless of the incentives federal and state governments offer wind and solar energy operations, they will not reach the scale — and most certainly not the reliability — necessary to achieve the stated 2035 GHGE goals.
Cost also must be considered. The average U.S. cost for electricity was $0.086/KWH in 2023. In California, however, the cost for electricity generated with 40% renewables was $0.1819/KWH. In Germany, it was $0.289/KWH with 55% renewables. To put this into perspective, today the differential in (industrial) electricity (commodity) costs demonstrably increase as the percentage of that electricity is generated by “green” sources. To think that this trend is going to be reversed by federal mandate is paradoxical.
A Realistic Look at the “Road Map”
While industrial decarbonization targets called for an 85% reduction in GHGE by 2023 and net zero by 2050, the goals seem unreachable using currently available technology. Replacing natural gas with hydrogen will result in significant cost increases as the commodity is 5–15 times more expensive, the equipment will require retrofitting to accommodate hydrogen, and the national infrastructure will need to be modified for hydrogen.
Electrification of existing gas-fired processes will result in a cost increase of four times, according to DOE estimates; however, based on today’s cost trends, 7–9 times higher is more likely. Additionally, the cost of converting equipment to electric operation must be considered. Mitigation efforts suggested by the DOE include improvements in efficiency that rely on yet-to-be-developed technologies and cost reductions in electricity facilitated by the wholesale use of renewable energy.
Overall, decarbonization efforts are noble. The timeframe and methodology, however, are unrealistic as they are based on the use of still-conceptual technologies.
What Can Heat Treaters Do?
Following the lead of the automotive industry may be key. This sector reacted to the government mandates for GHGE reductions by going all in for electrification — with projections of 50% electric vehicles by 2030. A funny thing happened; these vehicles were not wholly accepted by the American public. The auto industry, led by the dealers, with the support of the UAW, and the car manufacturers petitioned their U.S. Representatives to “pause” these requirements. This political pressure caused the EPA to roll-back the implementation schedule.
Heat treaters must act now with a similar effort, but it must be aimed at preventing the promulgation of regulations that rely on still-conceptual technologies within an unachievable timeframe. Contact your local government leaders; let them know what we do means jobs and tax revenues. Contact your U.S. Representatives and Senators to let them know heat treaters are critical to our national security, the transportation system, and, in fact, the infrastructure of this country. What we do should not be outsourced, and we need to be given all the considerations of a critical industry.
The next column in this series will address the role of process heating in GHGE, analyze DOE assessments of GHGE for industry and process heating operations, and propose a fact sheet intended for use in our effort to set a realistic timeline for decarbonization goals In the next column, we’ll address potential ramifications of the DOE effort for industrial decarbonization in the heat treating industry to help you be better informed and prepared.
About the Author:
Michael Mouilleseaux General Manager at Erie Steel, Ltd.
Michael Mouilleseaux is general manager at Erie Steel, Ltd. He has been at Erie Steel in Toledo, OH since 2006 with previous metallurgical experience at New Process Gear in Syracuse, NY, and as the director of Technology in Marketing at FPM Heat Treating LLC in Elk Grove, IL. Michael attended the stakeholder meetings at the May 2023 symposium hosted by the U.S. DOE’s Office of Energy Efficiency & Renewable Energy.
For more information: Contact Michael at mmouilleseaux@erie.com.
Attend the SUMMIT to find out more about the DOE’s actions for the heat treat industry.
Find Heat Treating Products and Services When You Search on Heat Treat Buyers Guide.com
“The effort to stem global warming/climate change must be tempered by open discourse on the efficacy of proposed regulations. Until we have the technology in place to accomplish decarbonization without eviscerating our industrial, transportation, and power industries, we must slow down the indiscriminate steps that the U.S. Department of Energy has laid out for heat treaters.”
Michael Mouilleseaux, chairman of the Metal Treating Institute (MTI) Regulatory Impact Task Force, has written extensively on the topic of green energy regulations on the industry, raising questions for heat treaters to consider, like: Are your heat treat operations ready to eliminate natural gas by 2035? Can it afford revising the heating apparatus of every furnace and increased green energy costs by a factor of 15?
Now, he has provided a fact sheet to help concerned heat treaters take action. This resource highlights the scope of heat treat in U.S. industries and highlights the implications of standing DOE regulations on heat treaters to help heat treaters articulate the concerns to their congressmen.
Laying out what heat treat is, who it serves, how it impacts the national economy/workforce, and what the Industrial Decarbonization Initiative means for the industry, this resource exhorts government officials to slow down these regulations. It posits that without allowing time for affordable technology to develop, the regulations have the capability of “eviscerating our industrial, transportation, and power industries.”
This resource by Michael Mouilleseaux accompanies his 3-part series on the topic in Heat Treat Today’s print magazines. For more background on current DOE regulations on the industry, peruse Michael’s three-part series published by Heat Treat Today: “US DOE Strategy Affects Heat Treaters” in the March 2024 Aerospace Heat Treatprint edition; “US DOE Strategy: Ramifications for Heat Treaters” in the April/May 2024 Heat Treat Greenprint edition; and “US DOE Strategy: Why Target the Heat Treating Industry?” in the June 2024 Buyers Guide Issueprint edition.
Find Heat Treating Products And Services When You Search On Heat Treat Buyers Guide.Com