
Heat Treat Radio #115: Lunch & Learn: Decarbonization Part 2
In this episode of Heat Treat Radio, Doug Glenn and guest Michael Mouilleseaux, general manager at Erie Steel LTD, continue their discussion of case hardness, delving into the hardening ability of materials, focusing on case hardening and effective case depth. Michael explains the differences between total and effective case depth, the impact of core hardness, and the role of material chemistry. They also discuss practical applications for heat treaters, emphasizing the importance of understanding material properties.
Below, you can watch the video, listen to the podcast by clicking on the audio play button, or read an edited transcript.


The following transcript has been edited for your reading enjoyment.
The Influence of Core Hardness on Effective Case Depth Measurement (01:03)
Doug Glenn: Today we are going to talk about a pretty interesting topic, and some interesting terminology, that has to do with hardness and hardenability of metals. For people who are not metallurgists, this may seem like a strange topic because isn’t all metal hard?
But we are going to talk more in depth about hardness of metal, hardenability of metal, and effective case depth. What we want to do is get a run down on the influence of core hardness on effective case depth measurements.
Michael Mouilleseaux: We are going to get a little bit into the weeds today on some things specific to metallurgy.
Those who are involved in high volume production carburizing know that consistency of results is extremely important. It is not just important in that we have the process centered in that the results are that way, but ultimately it has something to do with the dimensional control.
Specifically with gears, if the output from the process is not consistent, then one of the things that is going to suffer is going to be the dimensions. So, we’re going to be talking about effective case depths today.
Effective Case Depth vs. Total Case Depth (02:23)
Effective case depth is a little bit different from total case depth. Total case depth is the total depth that carbon is diffused into a part. That is very much a function of time and temperature. And there are some nuances with grain size and alloy content, but it is essentially a time and temperature phenomena.

Effective case depth is a little bit different. If we look at this graph, the x axis is the distance to the surface, and the y axis is hardness in Rockwell C.
If you look at the green line, this is a micro hardness traverse of a carburized part. It tells us many things. If you look at the left-hand side of the line at .005 in depth, the hardness there is 60 Rockwell C. Then it diminishes as we go further into the part: 0.010, 0.020, 0.040, 0.050.
We get to the end of that line, and we see that is the core strength. The core is a function of the material hardenability.
So, what is the effective case depth? If we look at the second vertical blue line on the right, it says “Total Visual Case.” So that’s exactly what that is. If we were to look at this part and etch it — I am presupposing that everybody understands that we would section the part — we would mount it, we would polish it, and then we would look at it in the microscope at 100x. Then, we would see a darkened area, which would be the total depth of carbon diffusion into the part. That is not a function of the material grade; there are some nuances there.
But the effective case depth is a measurement. And in North America’s SAE Standard J423, we say that we measure the case effective depth to Rockwell C 50. The surface hardness is 60, we measure the hardness in increments, and when we reach this hardness the depth that hardness achieves is 50 Rockwell. That is the effective case depth. If we look at the core hardness on that part, we can see that on this particular sample it is somewhere between 45 and 50.
Finding Material Hardenability (05:17)

What causes this core hardness? It has to do with the hardenability of the material.
Here we are looking at an SAE chart J1268. It is for H band material for 4320, a common gear material. This tells us a lot. It has the chemistry on it, below that it has some information for approximate diameters, and then it has, on the far right side of the diameters, we see specs for cooling in water or cooling in oil.
And between them there is the surface, the three-quarter radius, and the center. If we look at the surface of an oil quench at two inches, it has a distance from the surface of something like 4 or 5. So, if you go over the chart on the left-hand side, go to 4/16” or 5/16”, which has an HRC of 29 to 41. Even though this is a hardenability guaranteed material, for a two-inch round you would expect to have something between 29 and 41 for the surface hardness.
Now let’s look at what you would get at three-quarter radius in an oil quench. If you look at two inches, the Jominy position is [eight]. You can see that at three-quarter radius on a two-inch bar, that is an inch and three quarters, I believe, the hardness is going to be something between 23 and 34. In the center of that bar for a two-inch round, it is going to be J12, which has a hardness of 20 to 29.
That is the definition of hardenability. It is the depth that a material can be hardened. And it’s totally a function of chemistry. Davenport and Bain did the algorithms for this in the 1920s leading up to World War II.
Effect of Core Hardness (07:20)
If we are going to evaluate the effect of core hardness, we are going to look at parts that are heat treated in the same furnace to the same cycle in the same basket under all of the same conditions — the only thing different is going to be the hardenability of the material.
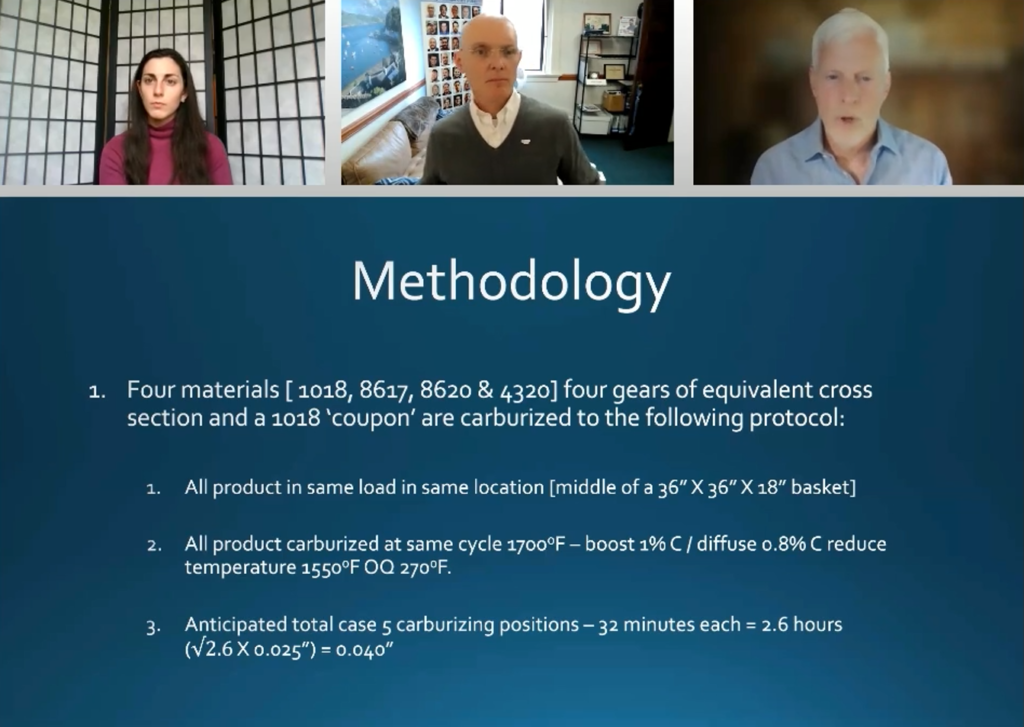
Go all the way down to number three on this “Methodology” slide. The anticipated total case is going to be about 0.040 for all of these samples.

This data graph has four samples on there. The red line is the measurement of Rockwell C 50. If we look at the highest hardenability sample, the blue sample has the highest core hardness and also the deepest effective case depth. And as the core hardness is reduced, you can see that where the line crosses the plane of Rockwell C 50, that is reduced as well.
Doug Glenn: Am I correct in thinking the yellow line here at the bottom has the lowest core hardness or hardenability?
Michael Mouilleseaux: Both. You’re correct.
Doug Glenn: That’s why it is crossing the red line much earlier than the others.
Michael Mouilleseaux: Yellow also has the lowest effective case depth.

If we look at this in a tabular form, this is the data, and what you looked at were the microhardness traverses, per the standard using an MT-90: the hardness was (the effective case depth was) measured to Rockwell C, the total case depth was determined visually on these things, and, you’re going to say, that Michael, you’ve got four different materials there. That is correct. We also have four different hardenabilities.
In answer to the question, if these were all the same heat, would we have these same results? We would with the exception of the bottom one at 1018. There is no way that we could take an alloy steel and reduce the hardenability of that amount.
Here is what we are talking about: We know that they were all run at the same process when we look at the total enrichment on this; it’s within the margin of error 0.038 to 0.042.
We look at the effective case depth, interestingly, we have quite a variation there. The first one has the highest core hardness at 46, and the effective case depth is 0.039. Second, we have a sample where the core hardness is 44, and the effective case depth is 0.036. Third, we have a sample where the core hardness is Rockwell C 39, and we have 0.029 effective case depth. And finally, there’s the 1018 sample that was put in there just as a reference. The core hardness on that was 24 with 0.015 effective case depth.
There is a direct proportion between the core hardness and the effective case depth that you are going to be able to achieve.
Referencing back to that hardenability chart that we looked at (the very bottom, half inch section quench in moderately agitated oil), it has a Jominy position of 3. If we look at J3 on the chart, we can see that at the lower end of the chemistry composition, we could have a core hardness as low as 35, and at the upper end of the chemistry composition we could have a core hardness as high as 45.
Let’s go back to the tabular data. That column for J3 is the data that was provided to us by our client from the steel mill.
When they melt a sheet of steel, it is a high value part. So, they use what is called SBQ (special bar quality). Special bar quality is subject to a lot of scrutiny and a lot of controls. One of the things provided, in addition to things like the chemistry and the internal cleanliness in the steel certification, is the hardenability of that specific heat.
You can see that the 8620, the first line, had a J3 of 44. We actually had a 46. The way to understand that is that when you’re going to melt 200 tons of steel, 100 tons of steel, or whatever amount it’s going to be, it’s not all done at one time in a single pour. It’s multiple pours out of a tundish.
The chemistry and the hardenability numbers that you got in a steel certification is going to be very close to an arithmetic average of what you would get when they test the first pours and the middle pours and the end pours. They’re going to average out.
Applying the Data (12:44)
When we’re using this data internally, we say we want to be plus or minus two points Rockwell C within the steel certified hardenability data. I can say that experientially over the years, Gerdau, SDI, Nucor (the domestic sources of SBQ bar )are very consistent in the way they make this stuff, and this is something that we can depend upon.
You could use this as a check for what you’re doing. If the steel that you have has a hardenability of 44 and if you’re not plus or minus two, you have to ask yourself why. There are only a couple of reasons that it would be outside those limits. If it’s above you, it probably is not the heat that it’s purported to be. If it is lower, it could either not be the heat that it’s purported to be, or there could be an issue with the heat treating.
As I said at the outset, we’re going to assume in this discussion that the reason that we have these numbers — the differential and core hardness — is not attributable to heat treating; it’s solely attributable to the chemical composition of the material or the hardenability.
We can use this information if we are an in-house or captive operation and are purchasing the material. We have an opportunity to define in our purchasing practice what the hardenability of the material is going to be.
As I mentioned before, the domestic sources are very consistent in the material that they produce. To produce a heat of 4320°F that has a J3 of 40 or 42 or 44, there is no cost penalty to that (in my experience involved in a major automotive supplier). It is a definition of what you want.
They are not making heats by randomly selecting chemistries for these heats and selling them. They make a recipe for a specific client. And my experience has been that they hold very true to that recipe.
If you are introducing a lot of variation into your process, not only is the output from that variable, but the cost of handling that is variable as well. A material such as this, to specify a J3 of 42 to 44, is something that is eminently doable. My experience is that the steel companies have been able to do that over time with a great amount of consistency.
Now, for those who are not involved in high volume production and do not have control of the source of the material, this chart remains usable. If someone is running a job shop or shorter term things who does not have furnace load sizes of parts, the key is to be able to mix and match things into specific processes. At least in carburizing, if we understand what the hardenability of the material is, then we have a much better opportunity of taking multiple parts and putting them into a load and determining ahead of time whether or not we are going to have consistent results.
Just one more thing that we would like to look at here is this next graph — the Caterpillar hardenability calculator. This is available from Caterpillar, and they readily share it with most all of their suppliers. I have been involved in numerous businesses and have never been refused this. You have to ask them for a copy of it.

Michael Mouilleseaux: Using this calculator you import the chemistry of a heat, and then it automatically calculates the hardenability of that heat.
If you recall the J3 on the 4320 material that we looked at, the hardenability guaranteed it had a ten-point range. If you look at this particular heat, and this is what we call the open chemistry, this would not be a hardenability guaranteed material. The upper limit is higher than what you would see on a hardenability guaranteed material, and the lower limit is lower than what you would see. So the variation in a “Standard SAE J 48620” is going to be much wider – it will be much different.
If we look at that same J3 position, we are looking at 25 to 45, a 20-point swing in core hardness. If we go back and revisit the results we had, 39 to 46 with a seven-point swing, we had a 0.010 difference in effective case stuff. If we had a 20-point swing, you could imagine it is going to be significantly greater than that.
Two things, if you have the lower hardenability grade of material, it allows you to modify your process ahead of time to compensate for the fact that the core hardness is going to be lower in this part. Vice versa, if you have an extremely hot heat or it is high hardenability, similarly, you may be able to reduce some time and not put as much total case on the part in order to achieve what specified as effective case.
The hardenability charts are great guides in helping to establish a process and then to evaluate the consistency of that process.
One other comment about the chart is this is not a full-blown Lamont chart, which has various quench severities for different sizes. And that can be utilized to help pinpoint this. As you can see on the SAE chart, you essentially have two different quench rates. You have mild oil and water.
There are a lot of different types of quenchants that are available. The moderate quench rate that is on this chart very closely mimics what we at Erie have been able to achieve modified marquenching. Therefore, I’m able to use this chart without any offset.
Now, if you had a fast oil — petroleum-based oil is very fast — and a heat that had a J3 of 40 in which you are consistently seeing 44 out of it, then in your specific instance, your quenchant is more aggressive than what this chart was built to simulate. However, you can continue to use the chart. It’s just that you must use your experience in doing it.
So again: The strategy to control it is getting the hardenability data so that you can utilize that ahead of time — understanding what your specific heat treating operation is and, more specifically, what your quenching operation allows you to achieve.
Then, knowing that a typical section size of X in this furnace is going to give a Jominy position of Y, you can take that information and say over time, “If I have a variation here, it’s going to be an effective case depth. Is that variation attributable to the core hardness?” If it is, there is a strategy which will possibly change and tighten up the purchasing practice. If it is attributable to something else, then that gives good information to say, “There’s something in my heat treating process that I should be looking at that is attributable for this variation in case depth.”
Conclusion (22:14)
So, we waded into the weeds, and hopefully we have found our way out.
Doug Glenn: I think that explanation is going to be especially good for those who already know a little bit of metallurgy and know those charts.
Bethany Leone: Michael, for in-house heat treaters, how often do they need to be aware of the materials coming into their operations, testing it, or asking about changes that could be happening?
Michael Mouilleseaux: Hopefully this would give heat treaters worth their salt a reason to pause if they previously assumed the material does not come into play.
The next thing would be in high valued components — gears, shaft, power transmission, those kinds of things — heat lot control is typically mandated by the end user. If you have heat lot control and the unique data that goes with that, utilizing the strategy we just talked about is going to give you the ability of evaluating variation. If the primary source of variation is the material, that needs to be addressed. If the material is very consistent and yet you continue to have variation, there is obviously something in the heat treating process that needs to be addressed to reduce that variation.
Doug Glenn: Thanks for listening and thanks to Michael for presenting today. Appreciate your work, Michael.
About The Guest

General Manager at Erie Steel, Ltd.
Sourced from the author
Michael Mouilleseaux is general manager at Erie Steel LTD. Michael has been at Erie Steel in Toledo, OH, since 2006 with previous metallurgical experience at New Process Gear in Syracuse, NY, and as the Director of Technology in Marketing at FPM Heat Treating LLC in Elk Grove, IL. Having graduated from the University of Michigan with a degree in Metallurgical Engineering, Michael has proved his expertise in the field of heat treat, co-presenting at the 2019 Heat Treat show and currently serving on the Board of Trustees at the Metal Treating Institute.
Contact Michael at mmouilleseaux@erie.com.

Publisher
Heat Treat Today

Managing Editor
Heat Treat Today
Search Heat Treat Equipment And Service Providers On Heat Treat Buyers Guide.Com
Heat Treat Radio #115: Lunch & Learn: Decarbonization Part 2 Read More »