


 In June, we spent a good deal of time discussing a simple pressure switch to emphasize the many considerations that are necessary for proper installation. Now we will expand the discussion to how the switch works and what steps we can take to detect a failure that is likely to occur sometime in the future.
This column appeared in Heat Treat Today’s 2021 Automotive August print edition. John Clarke is the technical director at Helios Electric Corporation and is writing about combustion related topics throughout 2021 for Heat Treat Today.

Technical Director
Helios Electric Corporation
Source: Helios Electric Corporation
A pressure switch is a Boolean device — it is either on or off — so how can we evaluate its performance in a manner where a potential failure can be detected before it occurs? The simple answer is time — how long does it take for the switch to respond to the condition it is intended to sense? What is the period between starting an air blower and the pressure switch closing? Has this time changed? Is a change in this time period to be expected, or does it portend a future failure?
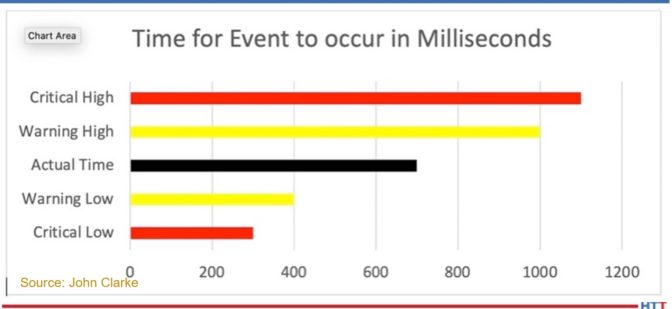
A simple approach to evaluating this pressure switch’s time is to create predetermined limits — if the switch responds either too rapidly or too slowly — an alarm is set and the operator is alerted. Graph 1 illustrates this approach.
In Graph 1, the black band represents the time between the action (the start of the air blower) and the pressure switch closing. There is a warning band (yellow) — both high and low — that provides the early warning of a system performance problem. There is also a critical band (red) — both high and low — that provides the point at which the feedback for the pressure switch is determined to be unreliable. If the switch is part of a safety critical interlock, the system should be forced to a safe condition (in the case of a combustion system, with the burner off and a post purge being executed) if required.
Graph 2 depicts when a switch closing time exceeds the warning level. It could be the result of a problem with the blower and/or the pressure switch, but the deviation is not sufficiently large as to undermine confidence in the switch’s ultimate function.
Programmatically, if the time exceeds the warning band, and an alarm is registered, the responsible maintenance person is notified. If that is in the warning band, it can be addressed as time allows.
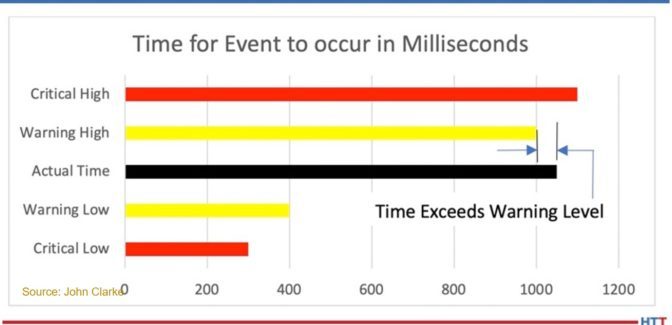
The warning bands give us the crystal ball to potentially see a problem before it causes a shutdown. As it is continuously monitored by the programmable logic controller (PLC), it may provide an increased level of safety, but that is dependent on a number of factors that are beyond the scope of this article.
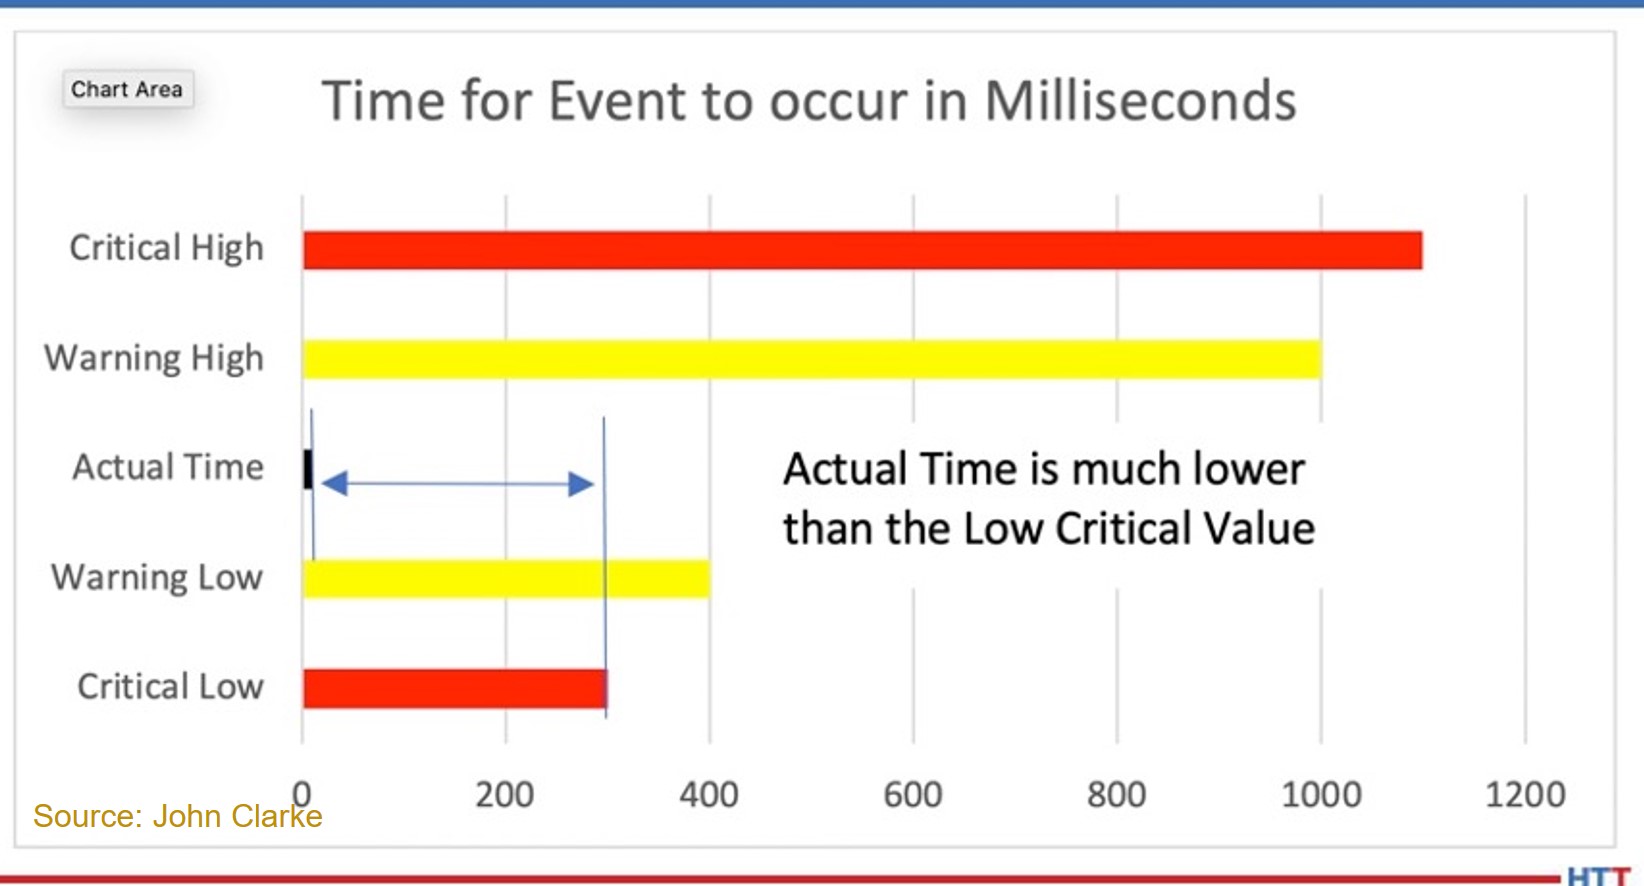
The switch can be not only too slow to respond: an unusually fast response is a reason to be concerned as well. It could be that the pressure switch setpoint has been set too low — so low that it no longer provides useful feedback. Graph 3 is an example with an unusually fast response.
If the time is less than the “Critical Low” preset value, the switch’s feedback is determined to be unreliable. In this case, the setpoint may have been changed during a maintenance interval or even worse — the switch may be jumpered (this assumes we have an interlock string wired in series). The critical values are NOT intended to provide forward looking estimates of required maintenance — they are simply an enhanced safety measure.
This scenario assumes that the response of a component is consistent. In our example of a pressure switch monitoring an air blower, we can assume the time the blower required to reach full speed, the time for a pressure rise time in the air piping, and the responsiveness of the switch is consistent. These time intervals may not be consistent. The air supplied to the blower could be sourced from outside the building (temperate climate), which could cause air density changes between a cool, dry day and a hot, moist day. In this instance, what can be done to detect a failure?
An approach where we see fluctuations in the timing even in instances where all the components are operating properly would be to run a moving average of the time based on the last n operations. Then we compare the moving average to the last time and confirm that any change falls within a specific range.
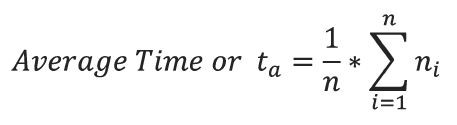
Step 1 would be to average the last n values for the time required for the switch to trip. Then compare this value (ta) to the last time and see if the deviation exceeds the preset values. Let us assume if the time varies by more than 20% a warning should be issued to the maintenance staff.
![]()
Now this method will accommodate rapid fluctuations – but if the performance of the component degrades in a near linear fashion, this formula will not detect a premature failure.
An alternate approach would be to execute this routine on the first n cycles, as opposed to continuously updating the average. Using this method, the performance of the specific component is captured. Or this averaging can be executed on demand or based on the calendar or Hobbs timer.
These concepts are far from new, and it has only been because of the recent expansion in PLC memory storage capacity and processing power that it has been reasonable to perform this analysis on dozens of components on a furnace or oven. Remember, it is a shame to waste PLC processing time and memory!
One or more of these approaches, or similar approaches analyzing time, can indeed be a crystal ball that gives us warning of any of a number of potential failures — warning before a system shutdown is required.
About the Author:
John Clarke, with over 30 years in the heat processing area, is currently the technical director of Helios Electric Corporation. John’s work includes system efficiency analysis, burner design as well as burner management systems. John was a former president of the Industrial Heating Equipment Association and vice president at Maxon Corporation.