


![]() Natural gas is the dominant energy source used by heat treaters and its price and availability is critical to all U.S. industry, so let’s look at the data and nail down some simple quantitative facts and maybe answer this pressing question: How will the war in Ukraine impact natural gas production and consumption?
Natural gas is the dominant energy source used by heat treaters and its price and availability is critical to all U.S. industry, so let’s look at the data and nail down some simple quantitative facts and maybe answer this pressing question: How will the war in Ukraine impact natural gas production and consumption?
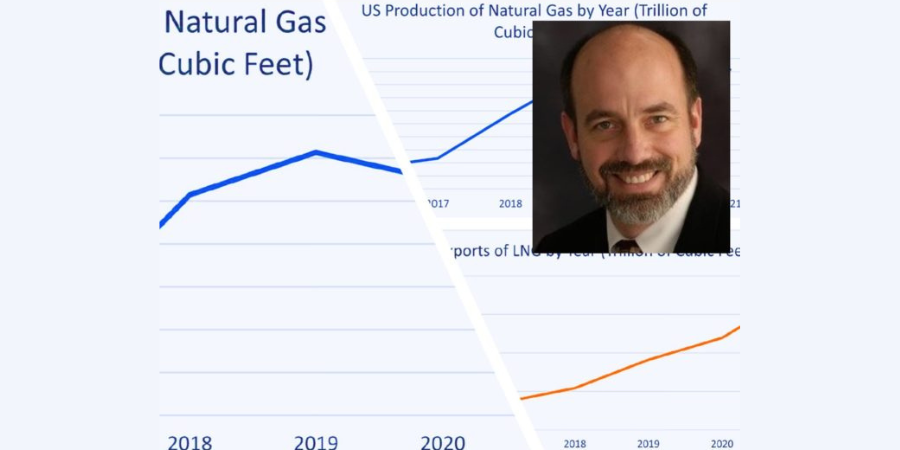
This column is a Combustion Corner feature written by John Clarke, technical director at Helios Electric Corporation, and appeared in Heat Treat Today’s May 2022 Induction Heating print edition.
If you have suggestions for savings opportunities you’d like John to explore for future columns, please email Karen@heattreattoday.com.

Technical Director
Helios Electric Corporation
Source: Helios Electrical Corporation
As political pundits seek to explain the cause and impact of the war in Ukraine, I am struck by the lack of quantitative information they use to support their opinions and analyses. Given the complexity of the U.S. energy market, with a myriad of imports and exports between countries (especially Canada and Mexico), it is no wonder that people can support any preconception they have by simply omitting this import or that export. As always, we will focus exclusively on natural gas.
Let’s start with some basic facts. FACT: 40% of our electricity in the U.S. in 2021 was generated using natural gas1 and 20% of electricity generated in Europe is from natural gas2 — so even a vacuum furnace runs on a substantial quantity of this fuel.
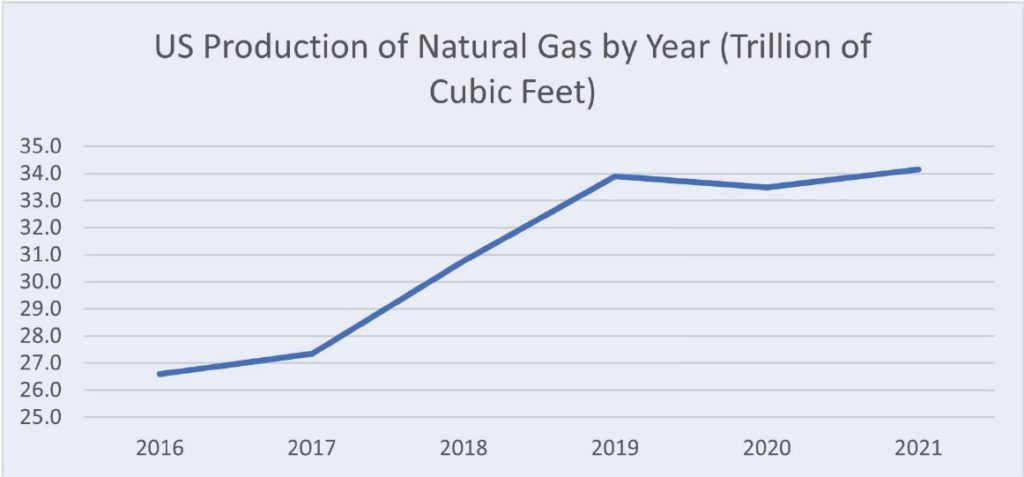
One of the challenges when discussing energy markets is the many different units of measure people use to describe production, consumption, and costs. Our preferred unit of measure for natural gas production and consumption will be trillion cubic feet or 1 quadrillion British Thermal Units (BTU)* per year (one cubic foot of natural gas contains 1000 BTU (HHV)). To put this in perspective, if we pay $4.70 per mmBTU** — one trillion cubic feet is valued at 4.7 billion dollars. In 2021, the United States produced 34.1 trillion cubic feet or roughly 161 billion dollars of dry natural gas.
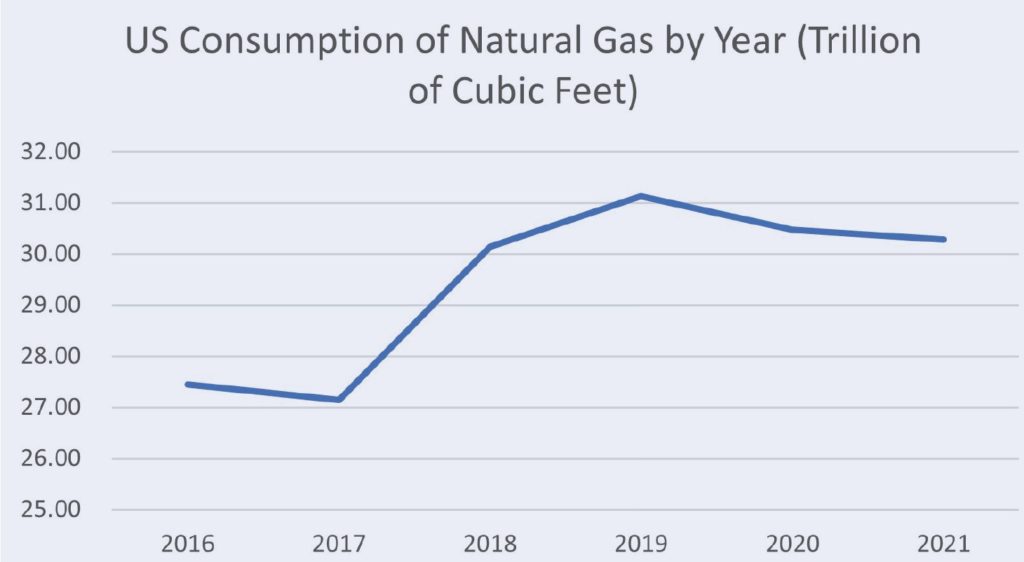
FACT: U.S. production of natural gas was at an all-time high in 2021 and is rising.3, 4 The U.S. is the largest producer of natural gas in the world by a significant margin. U.S. consumption has fallen over the last two years because of our COVID recession — but it is projected to rise in 2022.
Liquified Natural Gas (LNG) Exports
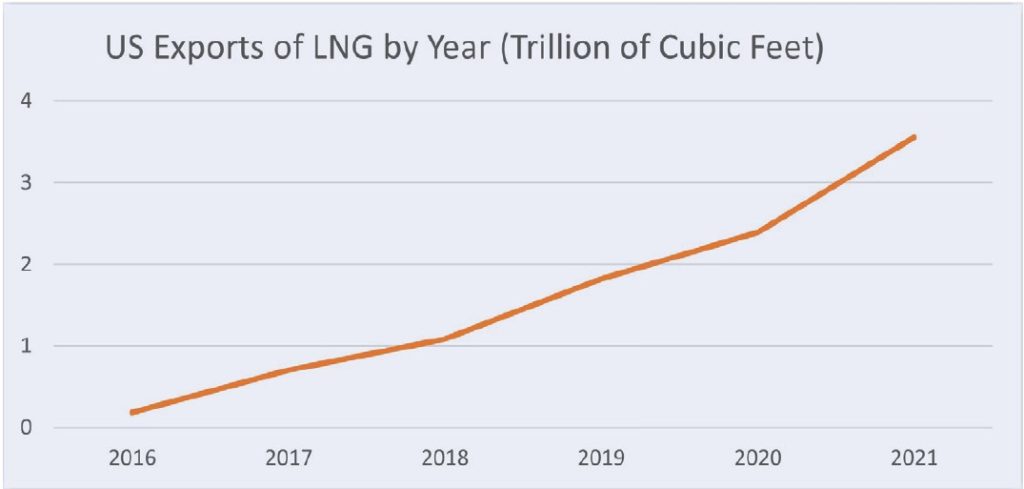
Natural gas can be exported via ship in its liquified state. The following graph shows the U.S. exports of LNG in recent years.5 Our ability to export LNG is limited by facilities that compress and cool the gas to its liquid state and the availability of tankers to move the gas across the ocean. Both ports and ships require significant capital investments and take time to construct — so there is a limit to the rate we can expand exports. Even as we export LNG, we continue to import some natural gas from Canada — but we are obviously a net exporter of natural gas by a considerable margin.
FACT: In 2021, the U.S. exported roughly 10% of the natural gas it produced as LNG. The U.S. is currently the largest exporter of LNG6 while Russia is the largest exporter of gaseous natural gas. Australia and Qatar are also major players in the LNG export market, and we may see these three countries vying for the top spot in the coming decade. The big advantage enjoyed by LNG is once liquified, it is a fungible source of energy — it can be exported to anywhere with a suitable port. Gaseous natural gas must travel through a pipe.
In 2021, the European countries in the Organization for Economic Co-operation and Development (OECD) together imported about 80% of the natural gas they use. Of this number, roughly 6.6 trillion cubic feet per year is imported from Russia, the largest importers of Russian gas include Germany — 1.70, Turkey — 0.95, Italy — 0.92, and France — 0.62 trillion cubic feet per year.
The U.S. has significantly expanded its LNG supplies to Europe in 2019—20217 to an annual rate of 1.86 trillion cubic feet in January of 2022,8 but LNG import capacity is still limited — with additional import facilities coming online in the next few years. Prior to 2019, Europe had little volume of LNG imports, so all the movement of natural gas was by pipeline.
While our price for natural gas in the U.S. has gone up considerably in the last year (approaching a mean of about $5.00 per mmBTU on the spot market), the price in Europe is running about six times as much — $30.00, with recent spikes as high as $60.00 per mmBTU. So, we load a typical LNG tanker with $15 million in natural gas in the U.S., and in 20 days, we lose 4% of the load to vapor, which we burn to power the ship, and offload $86 million at a port in Germany. Of course — this is an oversimplification, but the point is obvious. This price differential will continue to drive the market to invest in new production, LNG ports and ships — and apply upward pressure to our domestic price.
With or without the instability caused by the Russian invasion of Ukraine, we can expect a reliable supply of natural gas to fuel our furnaces and generate our electricity in the United States, but we can also expect higher prices to remain with us for the foreseeable future. Can the U.S. supplant Russia’s natural gas imports? The data indicates the answer is yes — but it will take time and investment. No matter what the outcome of the current war, the West will question the reliability of Russia as an energy supplier and explore all options to lessen their dependency on Russia’s oil and natural gas exports.
*1 BTU is the energy required to heat 1 pound of water, 1 degree Fahrenheit.
**Rough Henry Hub Price per mmBTU of natural gas at time of publication
References
[1] “Electricity explained: Electricity in the United States,” EIA.gov, March 18, 2021, https://www.eia.gov/energyexplained/electricity/electricity-in-the-us.php#:~:text=Natural%20gas%20was%20the%20largest,power%20plants%20use%20steam%20turbines.
[2] Statistical Review of World Energy — 2021. PDF File, 2021, https://www.bp.com/content/dam/bp/business-sites/en/global/corporate/pdfs/energy-economics/statistical-review/bp-stats-review-2021-eu-insights.pdf.
[3] Kirby Lawrence and Troy Cook, “EIA forecasts U.S. natural gas production will establish a new monthly record high in 2022,” EIA.gov, December 16, 2021, https://www.eia.gov/todayinenergy/detail.php?id=50678.
[4] “Natural Gas Summary,” EIA.gov, February 28, 2022, https://www.eia.gov/dnav/ng/ng_sum_lsum_a_EPG0_FPD_mmcf_a.htm.
[5] “Liquefied U.S. Natural Gas Exports,” EIA.gov, February 28, 2022, https://www.eia.gov/dnav/ng/hist/n9133us2A.htm.
[6] Mundahl, Erin. “We’re #1! U.S. Ends 2021 as World’s Largest LNG Exporter,” energyindepth.org, January 5, 2022, https://www.energyindepth.org/were-1-u-s-ends-2021-as-worlds-largest-lng-exporter/.
[7] Victoria Zaretskaya and Warren Wilczewski, “Europe relies primarily on imports to meet its natural gas needs,” EIA.gov, February 11, 2022. https://www.eia.gov/todayinenergy/detail.php?id=51258.
[8] EU-US LNG Trade: US liquefied natural gas (LNG) has the potential to help match EU gas needs, PDF File, March 2022, https://energy.ec.europa.eu/system/fi les/2022-02/EU-US_LNG_2022_2.pdf.
About the Author:
John Clarke, with over 30 years in the heat processing area, is currently the technical director of Helios Corporation. John’s work includes system efficiency analysis, burner design as well as burner management systems. John was a former president of the Industrial Heating Equipment Association and vice president at Maxon Corporation.
 Find heat treating products and services when you search on Heat Treat Buyers Guide.com