

![]() According to "Dr. O" – Dr. Steve Offley, product marketing manager at PhoenixTM – temperature control of the heat treatment application is critical to the metallurgical and physical characteristics of the final product, and hence its ability to perform its intended function. Explore today's Technical Tuesday article to find the light at the end of your mesh belt furnace tunnel.
According to "Dr. O" – Dr. Steve Offley, product marketing manager at PhoenixTM – temperature control of the heat treatment application is critical to the metallurgical and physical characteristics of the final product, and hence its ability to perform its intended function. Explore today's Technical Tuesday article to find the light at the end of your mesh belt furnace tunnel.
This article first appeared in Heat Treat Today’s February 2022 Air & Atmosphere Furnace Systems print edition.

Product Marketing Manager
PhoenixTM
Introduction – The Need for Accurate Product Temperature Measurement
Even though modern furnaces are supplied with sophisticated control systems, they are still not always capable of truly giving an accurate picture of the actual product temperature as it passes through the process. Temperature sensors positioned along the furnace give a snapshot of what the environmental temperature is possibly zone by zone. Furnace controllers, as the name suggests, can give confidence that the process heating is performed in a controlled manner but will never give an accurate view of what the actual product temperature is. When monitoring, it is important to be able to distinguish between process and product.
The challenge to any process engineer is understanding how the product heating cycle relates to the operation of the furnace. A furnace environment may be well controlled, but very different product temperatures can be experienced with variation in key properties such as product material, size, shape, thermal mass, and position/orientation in the furnace. Infrared (IR) pyrometers and thermal imagers can provide surface temperature measurements only and require line of sight, so they limit the areas of the product that can be measured. Setup can sometimes be complex considering surface characteristics (emissivity) and process background/atmosphere compensation. As with air sensors, being fixed, typically IR sensors only give information at that specific furnace location which prevents accurate calculation of soak times at critical temperatures. Without additional information, soak times and temperatures may need to be extended well beyond the target to guarantee the heat treat process is completed with confidence with an obvious compromise to throughput and energy conservation.
Product Temperature Profiling
To fully understand the operational characteristics of the heat treat process it is necessary to measure both the environment and product temperature continuously as it travels through the process. Such technique provides what is referred to as a “temperature profile” which is basically a thermal fingerprint for that product in that furnace process. This thermal fingerprint will be unique but will allow understanding, control, optimization, and validation of the heat treat process.
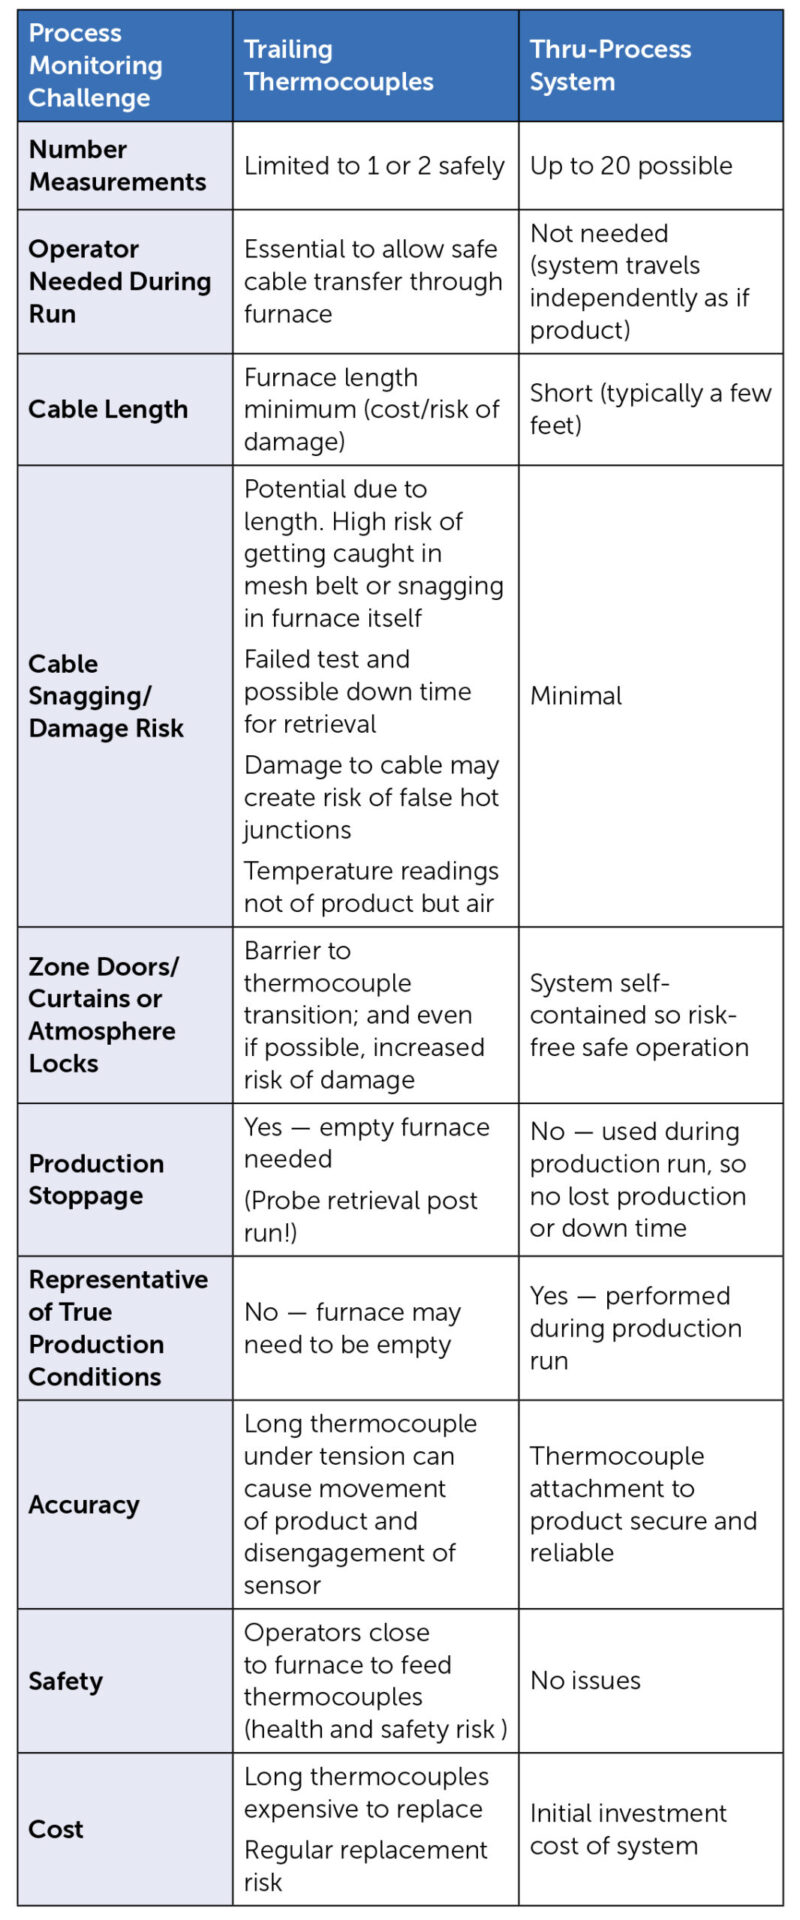
Historically, trailing thermocouples have been the go-to technique for product temperature monitoring. A very long thermocouple is attached to the product in the furnace. The data logger measuring the live temperature reading is kept external to the furnace. Although possible for static batch processes, the technique has significant limitations in a continuous/semicontinuous process, especially mesh belt furnaces (See Table 1).
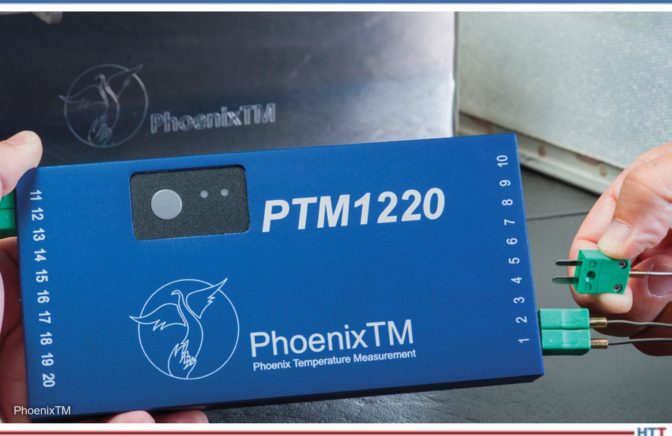
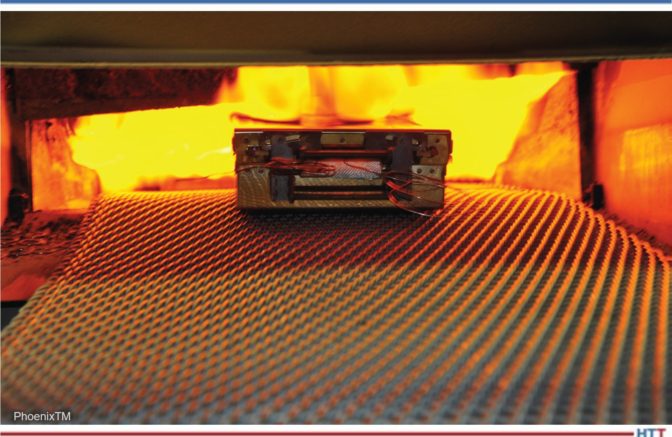
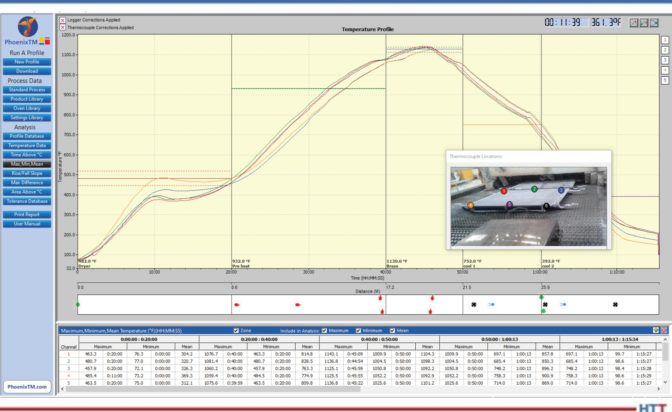
In thru-process temperature profiling the data logger travels with the product through the furnace. The data logger (Figure 1) is protected by an enclosure, referred to as a thermal barrier, which keeps the logger at a safe operating temperature (Figure 2). Temperature readings recorded by the data logger from multiple short length thermocouples can be retrieved post run. Alternatively, if feasible, the data can be read in real time as the system passes through the furnace using a two-way radio frequency (RF) telemetry communication option. The resulting temperature profile graph (Figure 3) provides a comprehensive picture — product thermal fingerprint — of the thermal process.
Monitoring Your Heat Treat Process Temperature at the Product Level
Applying thru-process temperature monitoring product temperature measurement can focus on the micro product level which at the end of the day is most important. Static control thermocouples give an environmental temperature of the furnace in a zone, but this only reflects the true temperature wherever the thermocouple is located. This may be some distance from the product and may give some bias to its position if located on one side of the furnace. The thru-process monitoring system allows simultaneous product and/or air temperature measurement directly at the mesh belt. Monitoring can be performed across the belt with thermocouple placement on and in the core of the product and can be made to identify areas of different thermal mass resulting in differing heating characteristics.
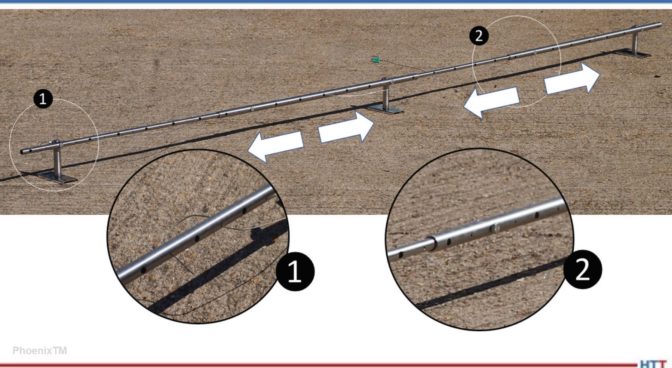
A useful strategy to use before looking at the product temperature is to thermally map the furnace. Thermocouples, connected to the data logger protected within the thermal barrier, are positioned across the mesh belt using a mount jig such as that shown in Figure 4. The jig guarantees reliable location of the measurement sensor run to run and adjustment means it can be adapted to different belt widths. Applying this principle, the thermal uniformity of air across the belt width through the entire furnace can be measured.
Such data can be compared with zone control thermocouples to see what temperature differential the product may be experiencing at the belt level. Temperature imbalances across the belt and hot or cold spots along the process journey can be identified.
 Furnace mapping can be further developed to satisfy either CQI-9/CQI-29 or AMS2750F pyrometry standards where a two-dimensional jig is constructed to perform the temperature uniformity survey (TUS).2 Employing the plane method, a frame jig is constructed to match the furnace work zone with the necessary number of thermocouples to satisfy the furnace cross section dimensions. Temperatures recorded over the working zone are compared to the desired TUS levels to ensure that they are within tolerance as defined in the standards.
Discover the True Root Cause of Your Furnace Problems
When it comes to product quality and process efficiency in any mesh belt furnace applications, temperature monitoring is only part of the story. Gaining an insight into what is physically happening in the product’s furnace journey can help you understand current issues or predict issues in the future, which can be corrected or prevented. To allow true root cause analysis of temperature related issues, it is sometimes necessary to “go to Gemba” and inspect what the product is experiencing, directly in the furnace. This is not always possible under true production conditions.
For a classic mesh belt furnace application such as controlled aluminum brazing (CAB), internal inspection of the furnace is not a quick and easy task. Operating at 1000°F, the cool down period is significant to allow engineers safe access for inspection and corrective action and then further delay to get the furnace back up to a stable operating temperature. Such maintenance action may mean one or two days lost production, from that line, which is obviously detrimental to productivity, meeting production schedules, satisfying key customers, and the bottom line.
In addition to process temperature problems there are many other production issues that can be faced relating to the furnace operation and safe reliable transfer of the product through the furnace. In the CAB process a day-to-day hazard is the build-up of flux debris. Flux materials used to remove oxides from the metal surface and allow successful brazing can accumulate within the internal void of the furnace. These materials are most problematic at the back end of the muffle section of the furnace where, due to the drop in temperature entering the cooling zone, materials condense out. Flux buildup can create many different process issues including:
- Physical damage to the conveyor belt or support structure requiring expensive replacement
- Reduction in belt lubricity creating jerky movement and causing unwanted product vibration
- Lifting of the mesh belt creating an uneven transfer of products causing possible excessive product movement, clumping, or clashing
- Reduction in inner furnace clearance creating possible product impingement issues and blockages
To prevent such problems, regular scheduled inspection and clean out of the furnace is necessary. This is not a pleasant, quick operation, and requires chipping away flux debris with pneumatic tools. Often requiring a furnace down time of 1 to 2 days, this task is only performed when essential. Leaving the clean-up operation too long can be catastrophic, causing dramatic deterioration in product quality or risk of mid-production run stoppages.
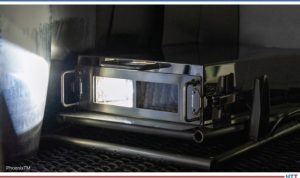
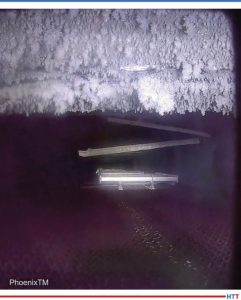
Figure 5. PhoenixTM Optical profiling ‘Optic’ System - Optical Profile View. System adaptable for both temperature and optical profiling.
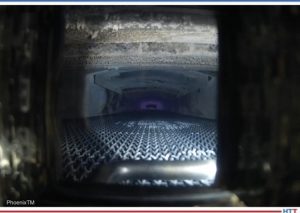
Optical Profiling – The Efficient Alternative
Optical profiling is a new complementary technique to that of thru-process temperature profiling. The innovative technology allows for the first-time process engineers to view the inner workings of the furnace under normal production conditions. Traveling through the furnace with the products being processed, the optic system gives a product’s eye view of the entire heat treatment journey. A thermal barrier, similar in design to that used in temperature profiling, protects a compact video camera and torch that are used to record a video of what a product would see traveling through the furnace (Figure 5). The principle is just like your car’s dash cam, the only difference being that your journey is being performed in a furnace at up to 1000°F. The resulting video, “Optical Furnace Profile,” shows process engineers so much about how their process is operating without any need to stop, cool, and dismantle the furnace. This allows safe routine furnace inspection without any of the problems of costly lost production and days of furnace down time.
Summary
Monitoring your mesh belt furnace from a temperature and optical perspective allows you to fully understand what truly happens in that black box. Understanding leads to better control, which helps you get the optimal performance out of your heat treat process from a quality, productivity, and energy efficiency perspective.
Don’t get left in the dark. Consider the power of temperature and optical profiling which will literally provide a light at the end of your furnace tunnel!
References:
[1] Steve Offley, “Unveiling the Mystery of Your Al Brazing Furnace with ‘Thru-Process’ Temperature Profiling," Heat Treat Today Magazine, June 2020, p40.
[2] Steve Offley, “Applying ‘Thru-process’ Temperature Surveying To Meet the TUS Challenge of CQI-9.” HeatTreatToday.com. June, 2019. https://www.heattreattoday.com/heat-treat-news/automotive-heattreat-news/applying-thru-processtemperature-surveying-to-meet-thetus-challenges-of-cqi-9/
About the Author:
Dr. Steve Offley, “Dr. O,” has been the product marketing manager at PhoenixTM for the last 4 years after a career of over 25 years in temperature monitoring focusing on the heat treatment, paint, and general manufacturing industries. A key aspect of his role is the product management of the innovative PhoenixTM range of ‘thruprocess’ temperature and optical profiling and TUS monitoring system solutions.
For more information, contact Dr. O at Steve.Offley@phoenixTM.com.