
A carbon emissions estimation tool specifically for heat treat furnaces combined physics-based furnace modeling with life cycle assessment. By revealing where emissions originate — from combustion and atmosphere gases to upstream energy sources — in this Technical Tuesday installment, Lakshmi Srinivasan and Fu Zhao, Ph.D., of Purdue University show how heat treaters can make data-driven decisions on efficiency improvements, electrification, and other decarbonization strategies.
This informative piece was first released in Heat Treat Today’s May 2026 Sustainable Heat Treat Technologies print edition.
Carbon Accountability in Heat Treatment
Heat treatment is a well-established, performance-critical step in metal component manufacturing. Today, as decarbonization pressures move up the manufacturing supply chain, the heat treat sector’s energy-intensive process heating faces scrutiny in industrial sustainability conversations.
Product carbon footprints, environmental product declarations, and life cycle assessments (LCA) have become more than just niche concerns for sustainability teams. Clients across automotive, renewable energy, and aerospace sectors are increasingly demanding process-specific, component-level emissions data that can be traced, verified, and compared. For heat treaters, that demand carries downstream accountability as carbon performance is becoming visible and increasingly factored into supply chain decisions. The requirement to measure and the pressure to decarbonize are converging.
Energy efficiency improvements, electrification, low-carbon fuel switching, and alternative furnace technologies are the principal pathways to reducing heat treat sector’s environmental footprint. Policy frameworks, client requirements, and voluntary net-zero commitments are pushing operators and OEMs alike to evaluate which of these investments deliver meaningful and cost-effective emission reductions.
Every heat treated part carries a carbon cost. Quantifying these emissions reliably and at the process level is imperative for informed decarbonization decision making.

Purdue’s Carbon Estimation Tool
Conventional carbon emissions accounting for industrial facilities relies on plant-level energy data, such as gas meter readings and utility bills, combined with standard emission factors. For legacy heat treating equipment, most instrumentation focuses on process control rather than energy or emissions measurement. These approaches produce estimates that are too rough to support product-level environmental impact or technology comparisons. Supply chain contributions of fuels, electricity, heat treat atmosphere gas generation, and furnace build need to be captured to characterize total emissions.
Standard LCA databases contain generic datasets for natural gas combustion and electricity generation but lack the data resolution needed to reflect heat treatment operations. Many associated process inputs, such as Endothermic atmosphere gas generation, have no dedicated LCA datasets.
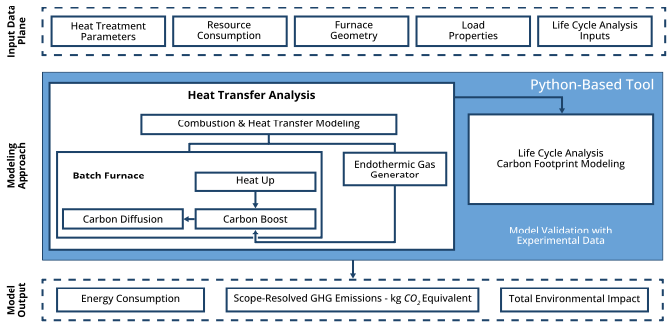
To address these gaps, a Python-based desktop GUI was developed that integrates physics-based furnace energy modeling with cradle-to-gate LCA (Srinivasan and Zhao 2025) (Figure 1). Cradle-to-gate assessment quantifies the environmental impact of a product or process across its entire supply chain, from raw material extraction through manufacturing, and follows the ISO 14040/14044 framework (International Organization for Standardization 2006a, 2006b).
The furnace energy model performs a detailed thermal analysis of a radiant-tube batch atmosphere furnace, computing heat transfer, combustion efficiency, and energy balance throughout the heat treat cycle. The energy model is solved as a function of furnace geometry, insulation, load size and properties, heat treat temperature, fuel type, and combustion properties. The model considers natural gas-fired radiant tubes with different tube shapes, orientations (vertical/horizontal), and burner configurations, as well as electric heating. Resolved energy sinks include load and fixture heating, insulation thermal storage, insulation conduction losses to surrounding environment, furnace atmospheric gas heating, and electric heating or recuperator-dependent flue-gas losses.
The LCA takes the energy and material flows produced by the furnace model and traces each through the corresponding upstream supply chain, using custom-developed life cycle inventory data.
Tool Capabilities and Applications
The tool is designed to answer these questions: Where do emissions come from in a heat treat cycle? What drives them? What actions will reduce them most effectively?
What the tool computes:
- Energy consumption per heat treat cycle, resolved by phase: heat-up, soak, diffusion
- Full scope-resolved carbon footprint: Scope 1, 2, and 3 emissions per cycle
- Life cycle environmental impact metrics: global warming potential, smog formation related to NOx from burners, ecotoxicity, and particulate matter formation
- Gas-fired vs. electric furnace emission performance under identical process conditions
- Emissions sensitivity to key process and design parameters: operating temperature, furnace size and insulation, load density, preheating, and burner configuration
Where it can be applied:
- Establishing a process-level emissions baseline for a specific furnace and recipe
- Generating inventory data for product carbon footprints and environmental product declarations
- Supporting Scope 1, 2, and 3 disclosures under GHG Protocol and EPA reporting frameworks
- Evaluating electrification decisions against regional grid carbon intensity
- Benchmarking emissions across competing furnace technologies for equivalent metallurgical outcomes
The sensitivity module enables operators and engineers to identify the dominant drivers of emissions and evaluate decarbonization options systematically. Burner configurations spanning non-recuperative, plug-in recuperative, and self-recuperative designs are evaluated through a combustion model that resolves chemical kinetics, tube temperatures, and emissions.
Heat distribution is computed on a per-surface basis using 3D Monte Carlo-based radiative view factors across the full furnace enclosure. Users can specify insulation material and thickness independently for each furnace wall, choosing from an extensive built-in material library.
Atmospheric gas contributions, such as Endothermic gas generation, nitrogen supply, and life-cycle amortized refractory materials, are included in the inventory.
Current model predictions are validated against instrumented industrial furnace data, with total cycle energy consumption within 5% of measured values from a well-maintained atmospheric furnace.
Emissions from a Carburizing Operation
Gas carburizing is selected to demonstrate tool results as a representative case for high-temperature, extended cycle time operations in preheated atmosphere-controlled industrial furnaces. The process requires a supply of externally generated Endothermic gas, which is an energy-intensive input with its own upstream footprint. What is true of carburizing in carbon accounting terms is broadly true of any thermochemical, atmosphere-controlled furnace process. The tool is built to accommodate the full range of heat treatment operations at various temperatures.
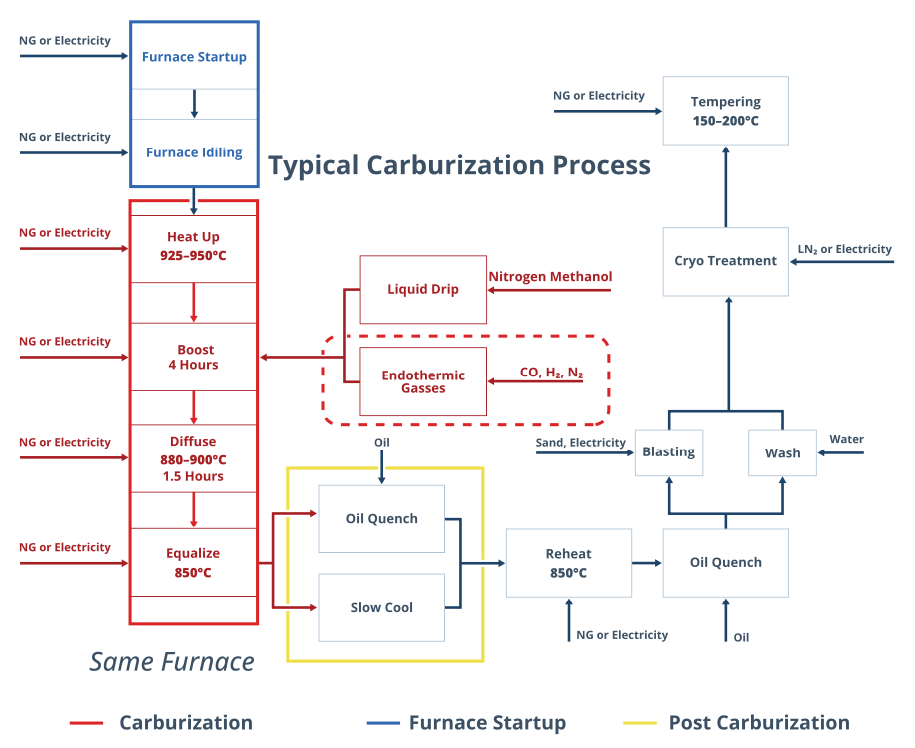
The carburizing system boundary encompasses the batch atmosphere furnace and all associated energy and material inputs from heat-up, carbon boost, diffuse and equalize phases (Figure 2). Endothermic atmosphere gas generation is included within the boundary, covering both the heat demand of the generator retort and the natural gas consumed as a chemical reactant.
Tracing emissions from a carburizing operation requires a structured accounting framework: the sources are multiple, and each contributes differently to the total footprint.
- Scope 1 covers direct emissions from on-site combustion: the natural gas burned in radiant tube burners and the Endothermic gas generator retort, plus spent atmosphere gas vented to the atmosphere at cycle end.
- Scope 2 covers indirect emissions from purchased electricity consumed by heating elements, circulation fans, quenching systems, and attached auxiliary equipment.
- Scope 3 captures everything upstream of the facility fence: the carbon embedded in the natural gas supply chain before it reaches the burner, the emissions associated with producing the Endothermic atmosphere gas, the embodied emissions in furnace construction and insulation materials, and the upstream footprint of nitrogen supply for purging and idling.
In a representative batch furnace carburizing cycle, direct natural gas combustion constitutes the dominant share of total greenhouse gas emissions (Figure 3).
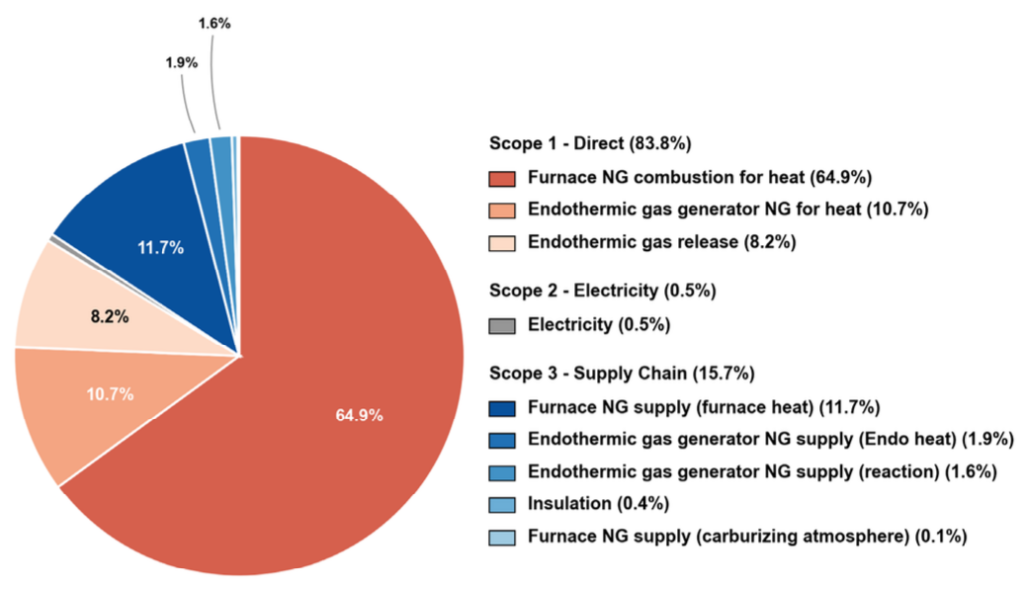
However, a significant share of total emissions originates from sources beyond the furnace burner and what the gas meter captures. These fall under two distinct categories.
Endothermic atmosphere gas generation and usage are carbon intensive. This includes the heat demand of the generator retort, the natural gas consumed as a chemical reactant, the upstream Scope 3 emissions from the natural gas supply chain, and the burn-off of spent atmosphere gas at cycle end. That burn-off is a direct Scope 1 release: the principal constituents of Endothermic gas are CO and H2, both combustible. They are oxidized through a flame screen or exhaust stack as the inner chamber and vestibule door open between cycles.
Upstream supply chain emissions for furnace fuels and infrastructure constitute the second category. This includes the carbon embedded in natural gas extraction, processing, and pipeline delivery before it reaches the facility fence, plus the embodied carbon in furnace insulation and refractory materials amortized over the furnace lifetime.
Electric vs. Gas-Fired Carburizing? Depends on Where You Plug In
An electric furnace is modeled as a direct retrofit replacing gas burners with an electric heating setup. Existing tubes are repurposed as resistive heating elements, controlled by an SCR/variable reactance transformer (VRT). Furnace size, insulation, tube geometry, and carburizing operation remain unchanged, enabling a direct, like-for-like comparison between electric and natural gas atmospheric furnaces. The modeled energy analysis shows a reduction of slightly over 25% in total energy consumed to meet the same process heat demand. This is attributable to the elimination of flue gas exhaust losses inherent to combustion-based heating.
Energy efficiency, however, does not translate directly to carbon efficiency. Under current U.S. average grid conditions, the electric furnace produces about 20% more emissions than a natural gas furnace. The electricity carbon intensity is derived from Ecoinvent 3.12 life cycle emissions, which account for upstream contributions across the full electricity supply chain. This includes fuel extraction, power plant construction, transmission infrastructure, and distribution losses, making these the appropriate basis for ISO-compliant LCA.
A direct grid carbon intensity factor, such as eGRID 2023, captures only emissions at the point of generation (Figure 4). On this basis alone, the electric furnace produces approximately 6.5% more emissions per cycle than the gas-fired baseline.
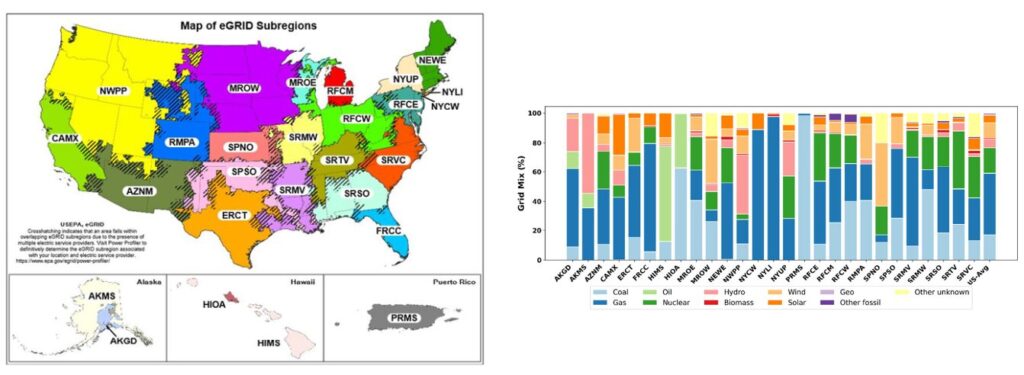
The carbon performance of an electric furnace is largely determined by the grid that powers it rather than by the heating equipment. In low-carbon grids such as CAMX (California), electrification delivers clear reductions. In coal- and gas-heavy regions such as MRO (Midwest Reliability Corporation) and RFC (Reliability First Corporation), electric furnaces produce emissions that exceed the gas-fired case by a considerable margin. National-average factors applied without regional context can produce directionally incorrect conclusions.
Expanding the Boundary: Furnace Idling and Quenching
Total greenhouse gas emissions increase by an average of 18% on expanding the system boundaries to account for integral quench operations and the nitrogen supply required for furnace purging and idling between cycles. Quenching is not thermally dominant, but the oil quench pump operates continuously, making it an electrically persistent load that accumulates over a production shift.
Nitrogen purging assumes five furnace volumes per cycle, and the associated emissions are highly source dependent. The carbon intensity of nitrogen supply varies significantly by delivery method. Cryogenic and compressed gas delivery systems have comparable and substantially higher upstream footprints than on-site alternatives. Liquefaction, compression, and transportation energy drive emissions from off-site nitrogen production. By contrast, on-site pressure swing adsorption produces nitrogen locally using only compression energy and carries roughly one-third of the emissions intensity of delivered alternatives.
For facilities operating continuous production schedules with frequent purge cycles, nitrogen source selection is a discrete decarbonization lever with a direct, quantifiable impact on total cycle emissions.
Conclusion
This tool provides a reliable, process-level method for the heat treat industry to engage with carbon emissions quantification. A complete LCA reveals that process heating accounts for two-thirds of total carburizing emissions in a natural gas-operated batch furnace. Endothermic gas and upstream supply chain emissions contribute to the rest. Matching furnace size to load is an immediately actionable and directly quantifiable decarbonization lever. The tool evaluates the emissions impact of electrification as a function of regional grid carbon intensity and accommodates a range of flexible batch furnace sizes and temperatures, quantifying each variable’s contribution to the total process carbon footprint.
About the Research: This research was conducted under the sponsorship of the Purdue Heat Treating Consortium. The computational tool and associated findings are available to current consortium members. For more details, please contact the authors.
References
International Organization for Standardization (ISO). 2006a. Environmental Management—Life Cycle Assessment—Principles and Framework. ISO 14040:2006. Geneva, Switzerland.
International Organization for Standardization (ISO). 2006b. Environmental Management—Life Cycle Assessment—Requirements and Guidelines. ISO 14044:2006. Geneva, Switzerland.
Srinivasan, L., and F. Zhao. 2025. “Quantifying Carbon Footprint in Industrial Heat Treatment Processes Through Life Cycle Assessment.” Proceedings of the ASME International Manufacturing Science and Engineering Conference (MSEC 2025) 89022. https://doi.org/10.1115/MSEC2025-155425.
U.S. Environmental Protection Agency (EPA). 2023. “Emissions & Generation Resource Integrated Database (eGRID).” https://www.epa.gov/egrid.
Wernet, G., C. Bauer, B. Steubing, J. Reinhard, E. Moreno-Ruiz, and B. Weidema. 2016. “The ecoinvent Database Version 3 (Part I): Overview and Methodology.” The International Journal of Life Cycle Assessment 21 (9): 1218–1230. http://link.springer.com/10.1007/s11367-016-1087-8.v
About the Authors:

Ph.D. Candidate in Mechanical Engineering
Purdue University
Lakshmi Srinivasan is a Ph.D. candidate in Mechanical Engineering at Purdue University, specializing in life cycle assessment, energy modeling, and decarbonization pathways for industrial and transportation applications.

Professor, School of Mechanical Engineering and the School of Sustainability Engineering and Environmental Engineering
Purdue University
Fu Zhao, Ph.D., is Professor in the School of Mechanical Engineering and the School of Sustainability Engineering and Environmental Engineering at Purdue University. His research integrates life cycle assessment, techno-economic analysis, recycling and circular economy strategies for critical materials and energy systems.
For more information: Contact Lakshmi Srinivasan at lsriniv@purdue.edu and Fu Zhao at fzhao@purdue.edu.