


When carbon-footprint assessment happens during material selection for CAE simulations and product design, the result is more informed and sustainable decisions. In this Technical Tuesday installment, Mariagrazia Vottari, chief technical officer at Total Materia AG, shows how informed material choices can identify lower-impact alternatives without compromising structural, mechanical, or physical requirements.
This informative piece was first released in Heat Treat Today’s May 2026 Sustainable Heat Treat Technologies print edition.
Introduction
Governments and industries worldwide are setting increasingly ambitious targets to reduce greenhouse gas (GHG) emissions and strengthen environmental responsibility across supply chains. New sustainability frameworks, mandatory reporting requirements, and carbon-pricing mechanisms are accelerating the shift toward low-carbon production, including stricter expectations for transparent environmental data and lifecycle assessments.
Consequently, global supply chains must adapt quickly, integrating sustainability considerations from the earliest stages of product design through manufacturing, distribution, and end-of-life management. Environmental performance, traceability, and responsible material selection are becoming essential elements of modern engineering and product-development strategies.
Materials themselves represent a major share of global GHG emissions, increasing from 5 to 11 global net anthropogenic GHG emissions (GtCO₂-eq) between 1995 and 2015, and rising from 15% to 23% of global totals. For most products, materials dominate the carbon footprint until manufacturing is complete.
Accurate material selection in early product design and CAE (computer aided engineering) simulations is critical. Beyond traditional factors, such as mechanical performance and cost, engineers must now consider carbon footprint, environmental impact, lightweighting, regulatory compliance, and supply chain optimization to reduce overall emissions.
Therefore, sustainable product design will incorporate Life Cycle Assessment (LCA) of materials using selected indicator(s) providing environmental impact to materials selection. For example, in the automotive industry, ranking (c) is often calculated as c = 0.4 × mass + 0.2 × cost + 0.4 × CF.
Other more complex decision-making models for materials selection have been proposed. This exemplifies the need for reliable and simplified calculation of carbon footprint (CF) value for thousands of diversified structural materials, from carbon and stainless steel to special alloys, nonferrous metals, and polymers, considering their manufacturing routes, processing, finish, and transport. A full LCA study is demanding in terms of both data collection efforts and user expertise requirements, while streamlined LCA often uses generic data related to the materials production, energy used for their processing, and transportation. Typically, streamlined LCA uses only a fraction of the inputs to estimate carbon footprint compared to the full LCA inventory. This article presents recent developments designed to help engineers in the CAE simulation field to cope with these challenges.
Streamlined LCA Methodology
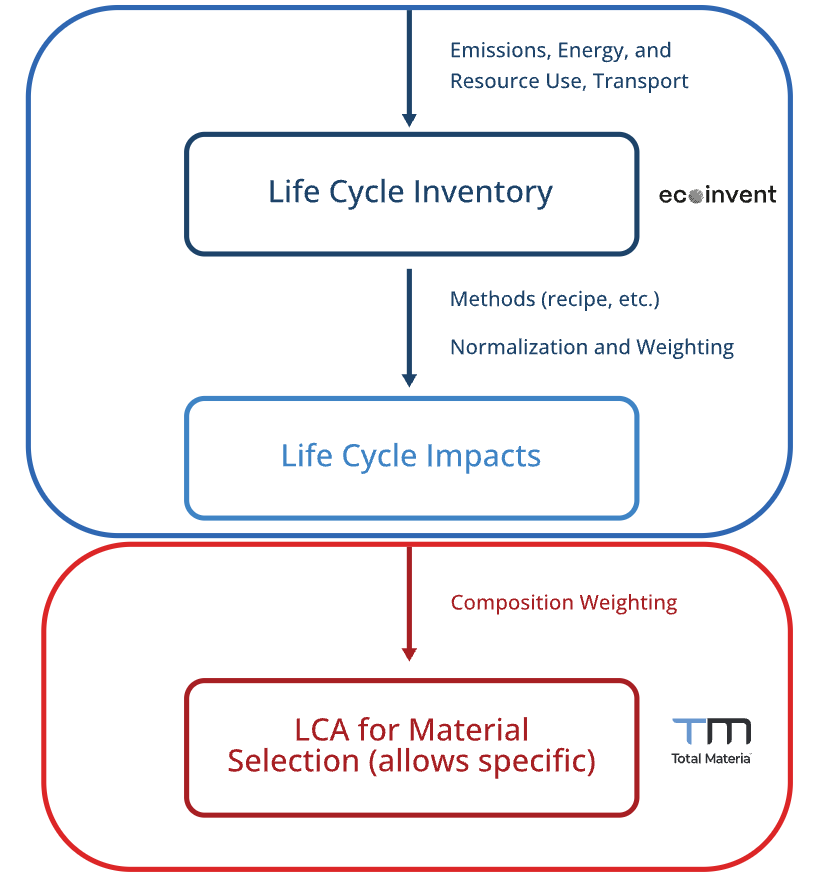
There are numerous simplification approaches in LCA; the following describes the approach that combines the composition of alloys with carbon footprint values of base metal and alloying elements production. The LCA tool described in the current study (Figure 1) can cover a variety of ferrous and non-ferrous alloys due to the use of:
- Chemical compositions from a large database containing structural material properties, which comprises more than 500,000 materials; and
- Country, manufacturing route, processing, and transport-specific life cycle inventory (LCI) collected from Ecoinvent v3.10, along with relevant data from scientific articles.
Goal, Scope, Functional Unit and System Boundaries
The aim of this LCA is to quantify the impact of steel and various non-ferrous alloys (Al, Cu, Mg, Ni, and Ti based) according to ISO 14040 standards, analyzing the influence of the composition on the carbon footprint.
The functional unit has been defined as 1 kg of produced material, considering the country of manufacturing and processing as well as transport to the buyer’s gate.
The scope of this study is to estimate the environmental impact of the production and the transport of materials (cradle to gate), accounting for raw materials extraction, manufacturing, and processing.
Inventory Data and Impact Category
Ecoinvent’s Life Cycle Inventory Assessment (LCIA) datasets were used where possible, including:
- Base metals
- Alloying elements, utilized in the manufacturing calculation through chemical composition weighting
- Processing, quantified in kg CO₂-eq per kg of material, per kg of removed material, or per m², varying with the type of processing
- The energy mix, allowing country-specific calculation
- Transport, covering a wide range of routes
Calculations are based on the cut-off system model, the IPCC 2021 no LT LCIA method, and the climate change Global Warming Potential (GWP100) indicator.
Additional sources were used from scientific literature for data not available in Ecoinvent. The calculation scope expanded with:
- Scrap content adjustment manufacturing contributions from various countries/regions
- Contributions from different manufacturing routes
- Various processes in different countries/regions
For intensive electricity-consuming processes, such as hot rolling, cold rolling, and stamping, electricity consumption data (measured in MJ/kg or kWh/kg) has been collected. This data, combined with the energy mix information from Ecoinvent, contributes to the final calculation.
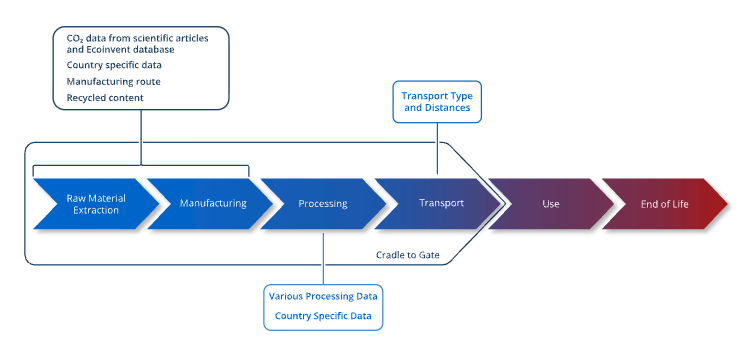
The final CO₂-eq score is the cumulative sum of contributions from material production (manufacturing), processing, and transport as shown in Figure 2, illustrating the system boundaries considered in the study.
Analysis CF Results
In this work, six different alloys that are commonly used have been selected for the carbon footprint analysis. The chemical composition of alloys is defined by specific standard, while details on studied alloys production are presented in Figure 3.
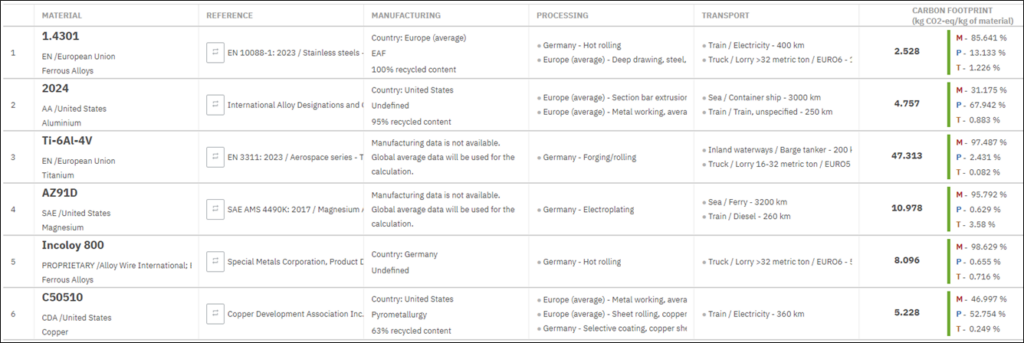
After specifying details on manufacturing (country, method, and recycled content), processing (country and processing applied), and transport (type and distance), the values of carbon footprint are determined for each alloy (Figure 3), providing the contribution of each stage of analysis.
The lowest environmental impact of all studied alloys was steel 1.4301 with a value of 2.5 kg CO₂-eq/kg. This is because a manufacturing route for the 1.4301 alloy was EAF (electric arc furnace) with 100% recycled content, where electricity is used to melt scrap steel and produce new steel, in contrast to BF-BOF (blast furnace-basic oxygen furnace) where extraction of iron ore is needed and relies heavily on coal or coke as a fuel source for the blast furnace, which emits significant amounts of CO₂ during combustion. Although numerous factors or variables play a role in determining the environmental impacts of metal production, one of the most significant parameters is recycled content.
Titanium alloy has the highest environmental impact of all studied alloys, emitting up to 47.3 kg CO₂-eq/kg of material. Ti-6Al-4V alloy was selected for this study even though it is very expensive and has a high energy consumption of production in the long and demanding Kroll process, because it is one of the most popular joint implant materials due to its biocompatibility, low density, and strength.
Although Al, Cu, and Fe-Ni-based alloys have similar CF values (4.7 to 8 kg CO₂-eq/kg), in the case of aluminum and copper alloys, the most significant contribution comes from the processing of those alloys (52 to 68%), unlike Incoloy in which processing contributes a modest 0.72%. The CF value for Incoloy 800 is three times greater than 1.4301 alloy. The high environmental impact of Incoloy 800 is mainly caused by nickel content (max. 10% in 1.4301 alloy, while max. 35% in Incoloy 800) and very high carbon footprint values for nickel itself. This is proof of why chemical composition cannot be neglected.
The effect of transportation is very small, only contributing up to 3.6% for selected transport parameters. However, it can have much higher relative contribution for low-impact alloys, especially over long distances. In Figure 4, the effect of different transport types shows that the selection of air transport can double the carbon footprint value of the material compared to sea transport (for the same manufacturing and processing parameters).
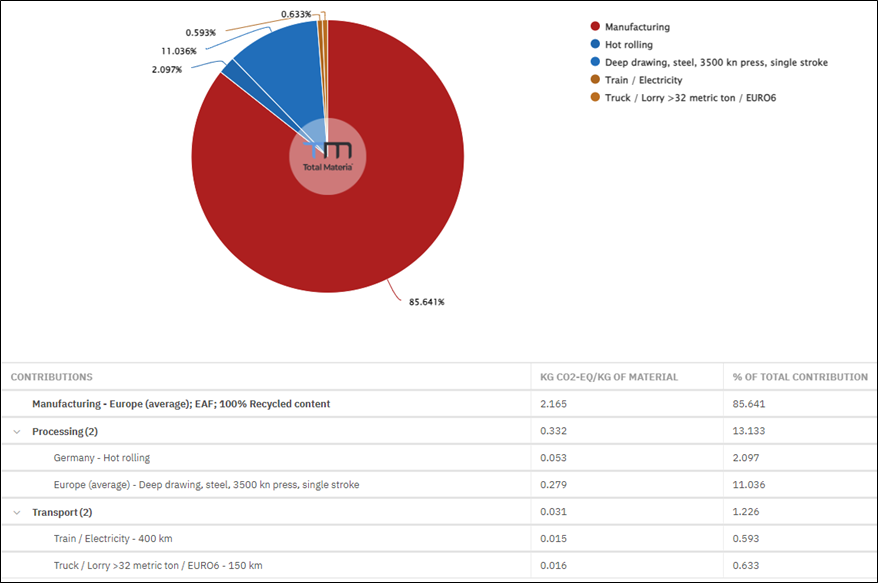
Further contribution analysis can be made for each alloy given the detailed contribution for manufacturing and each processing step, as well as transportation type, as shown in Figure 5 for the 1.4301 steel. Results show that deep drawing increases carbon footprint with a factor of 5 in comparison with hot rolling. This suggests that such processes should be performed on locations having energy supplied from renewable sources.
Material Selection, Looking for a Greener Alternative
Besides identifying more environmentally sustainable manufacturing processes such as alternative production routes, higher scrap content, different locations, processing with lower energy demand, and greener transportation options, another approach to reducing the carbon footprint is to identify alternative materials with different chemical compositions but similar mechanical and physical properties.
Although the selection of alternative materials must consider various factors related to the availability, supply chain, etc., from the environmental point of view, the decision can be facilitated by using a proper cross-reference system that simultaneously suggests alternatives based on various criteria. There are two scenarios for material selection:
- In the early design phase when the material is still not selected and when certain mechanical, physical, compliance and sustainability requirements should be fulfilled.
- When a certain material already in use should be replaced with a greener alternative but maintain the same characteristics.
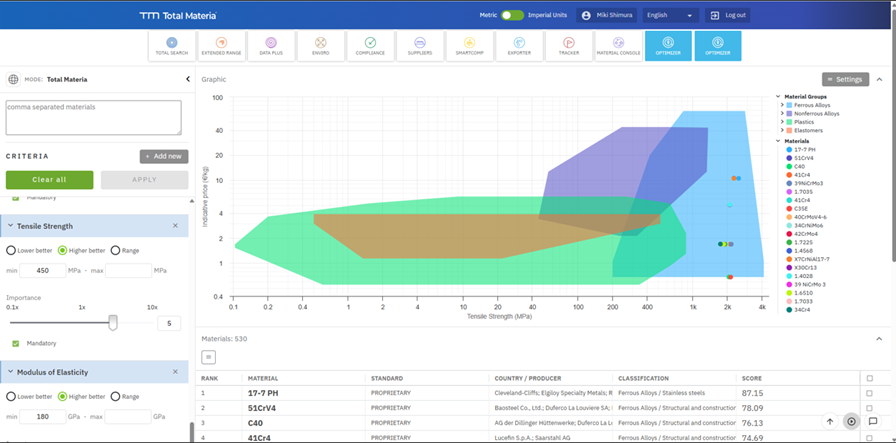
In the first case, material-selection tools like the Total Materia Optimizer can be used to support engineers in comparing and ranking materials based on multiple technical and regulatory criteria. This tool can evaluate thousands of potential candidates simultaneously and filter them according to user-defined parameters, such as mechanical performance, chemical composition, cost, regulatory status, or regional availability as shown in Figure 6.
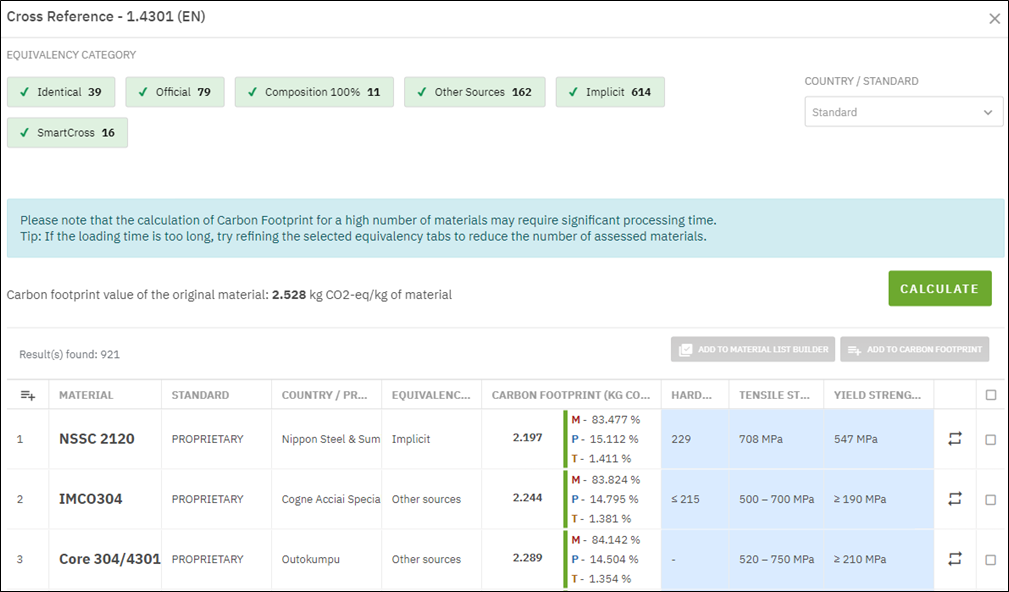
In the second case, when the material is already in use, finding an alternative material with a lower CF value is possible in a material-selection tool’s carbon footprint module through the cross-reference option. The system offers alternatives based on various criteria. As an example for this case, 1.4301 alloy is used with all set-up parameters from Figures 4 and 6 (with CF value of 2.528 kg CO₂-eq/kg). The analysis shown in Figure 7 suggests 921 alternative materials ordered by CF value in ascending order. In this view, a user can add additional columns with mechanical and physical properties to ensure that the material also fulfills the required characteristics. In this example, material NSSC 2120 meets the required mechanical and physical criteria, and the CF value is reduced from 2.5 to 2.2 kg CO₂-eq/kg (which is a reduction of 12%) compared to the initially selected material 1.4301.
Conclusions
This approach for assessing the environmental impact of ferrous and non-ferrous alloys based on material composition and processing routes has been illustrated through a carbon footprint evaluation. It enables engineers to compare materials not only by cost and performance but also by their carbon intensity, supporting more informed and sustainable selection decisions. The method also helps identify greener manufacturing options, such as alternative routes, higher recycled content, lower-energy processing, or reduced-impact transport, early in product design while maintaining quality and performance.
Future improvements include expanding datasets to cover additional processing steps, incorporating more specific manufacturing routes — especially for non-ferrous alloys — and increasing regional coverage to reflect local energy mixes. These enhancements will further refine emission factors and improve the accuracy of carbon-footprint assessments.
References
European Green Deal. 2019. https://eur-lex.europa.eu/legal-content/EN/TXT/?uri=COM:2019:640:FIN (accessed November 2025).
Federal Climate Protection Act. n.d. https://www.bmuv.de/gesetz/bundes-klimaschutzgesetz (accessed November 2025).
Corporate Sustainability Reporting Directive (CSRD). 2022. https://eur-lex.europa.eu/legal-content/EN/TXT/?uri=CELEX:32022L2464 (accessed November 2025).
Carbon Border Adjustment Mechanism (CBAM). 2023. https://eur-lex.europa.eu/legal-content/EN/TXT/?uri=CELEX:32023R0956 (accessed November 2025).
Hertwich, E. G. 2021. “Increased Carbon Footprint of Materials Production Driven by Rise in Investments.” Nature Geoscience 14: 151–155.
Ermolaeva, N. S., M. B. G. Castro, and P. V. Kandachar. 2004. “Materials Selection for an Automotive Structure by Integrating Structural Optimization with Environmental Impact Assessment.” Materials and Design 25: 689–698.
Ic, Y. T., B. M. Hamzaoğlu, and M. Yurdakul. 2024. “A Robust Aluminum Material Selection Process in the Aviation Industry: A Linear Discrete System Stability Test Perspective for Fuzzy Multicriteria Decision-Making.” Arabian Journal for Science and Engineering.
Tasala Gradin, K. 2020. Simplified Life Cycle Assessment Approaches and Potential Impact Shifts. Doctoral thesis, KTH Royal Institute of Technology.
Treloar, G., P. Love, and J. Smith. 1999. “Streamlined Life Cycle Assessment: A Method for Considering Environmental Impact of Road Construction.” In Proceedings of the 15th Annual ARCOM Conference, edited by W. Hughes, 753–762. Liverpool John Moores University. Association of Researchers in Construction Management.
Gómez, P., D. Elduque, J. Sarasa, C. Pina, and C. Javierre. 2016. “Influence of Composition on the Environmental Impact of a Cast Aluminum Alloy.” Materials 9: 412.
Gutiérrez, I. G., D. Elduque, C. Pina, R. Tobajas, and C. Javierre. 2020. “Influence of the Composition on the Environmental Impact of a Casting Magnesium Alloy.” Sustainability 12: 10494.
Gutiérrez, I. G., D. Elduque, C. Pina, R. Tobajas, and C. Javierre. 2021. “Excel Tool to Assess the Environmental Impact of Steels Based on the Composition.” In 9th International Workshop on Simulation for Energy, Sustainable Development & Environment. ISSN 2724-0061.
Total Materia AG. n.d. https://www.totalmateria.com (accessed November 2025).
Wernet, G., C. Bauer, B. Steubing, J. Reinhard, E. Moreno-Ruiz, and B. Weidema. 2016. “The Ecoinvent Database Version 3 (Part I): Overview and Methodology.” The International Journal of Life Cycle Assessment 21 (9): 1218–1230. (Version 3.10, 2023).
International Organization for Standardization (ISO). 2006. Environmental Management—Life Cycle Assessment—Principles and Framework (ISO 14040).
Broadbent, C. 2016. “Steel’s Recyclability: Demonstrating the Benefits of Recycling Steel to Achieve a Circular Economy.” The International Journal of Life Cycle Assessment 21: 1658–1665.
Norgate, T. E., S. Jahanshahi, and W. J. Rankin. 2007. “Assessing the Environmental Impact of Metal Production Processes.” Journal of Cleaner Production 15: 838–848.
Nilsson, A. E., M. M. Aragonés, F. A. Torralvo, V. Dunon, H. Angel, K. Komnitsas, and K. Willquist. 2017. “A Review of the Carbon Footprint of Cu and Zn Production from Primary and Secondary Sources.” Minerals 7: 168.
About The Author:

Chief Technical Officer
Total Materia AG
Mariagrazia Vottari is the chief technical officer at Total Materia AG, leading the Engineering Department and overseeing data content development and material intelligence initiatives. She has a background in mechanical engineering and nearly 20 years of experience in the industry, with a strong focus on materials engineering, data processing, and digital solutions for the manufacturing industry.
For more information: Contact Mariagrazia Vottari at m.vottari@totalmateria.com.