

Heat Treat Economic Indicators for March: Continued Growth Expected
Heat Treat Today has gathered the four heat treat industry-specific economic indicators for March 2026. The March results show continued stability compared to the February 2026 predictions.
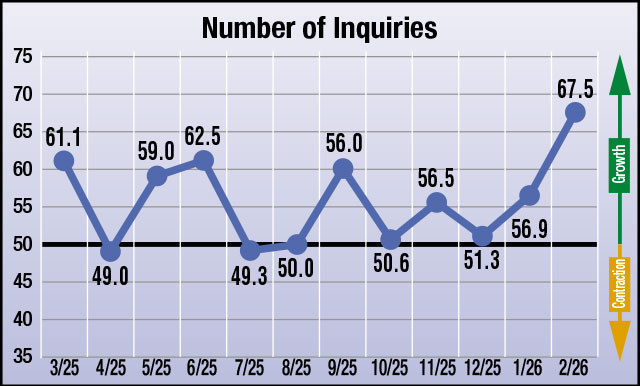
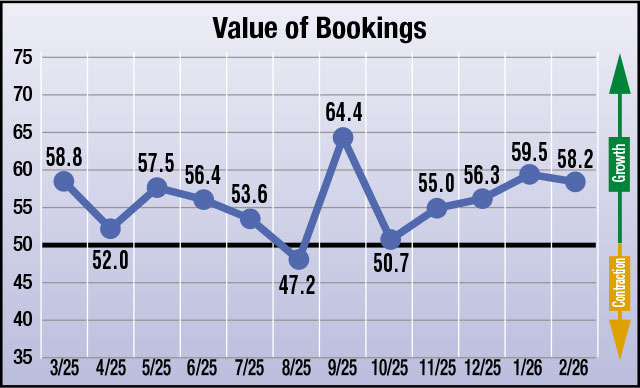
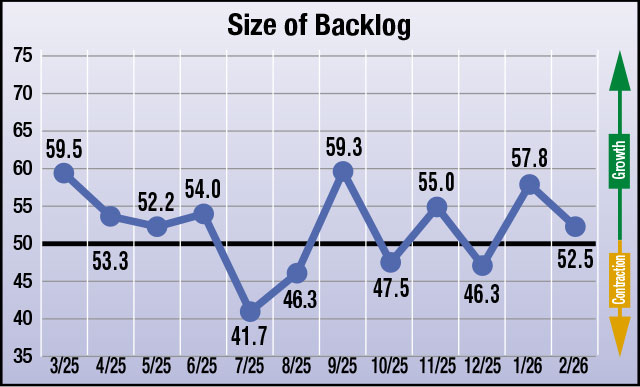
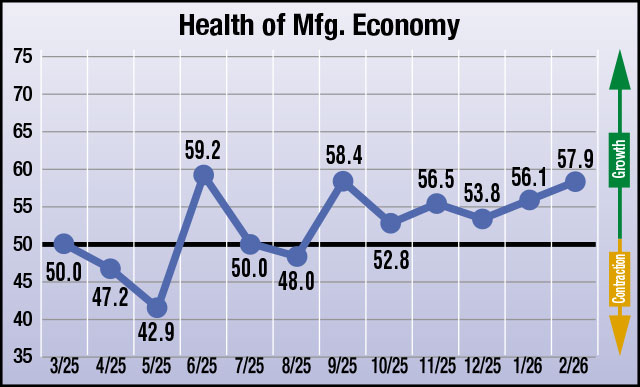
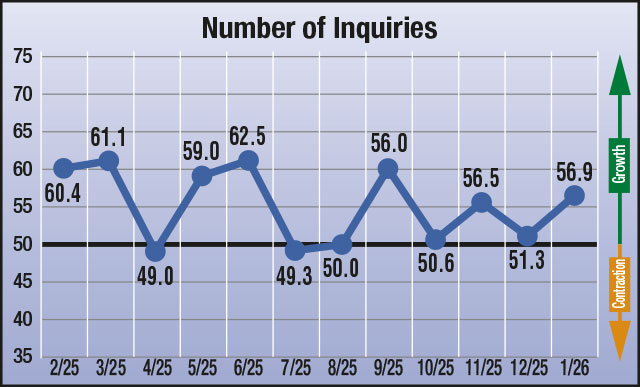
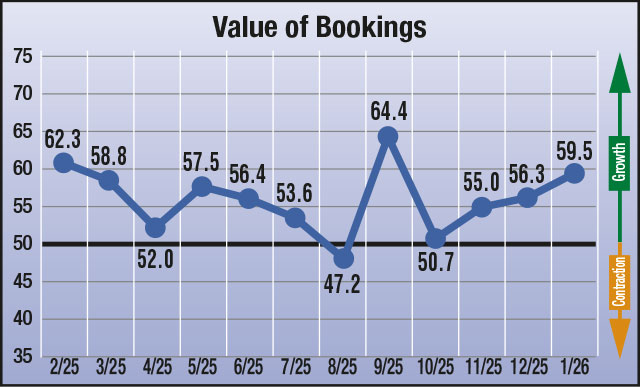
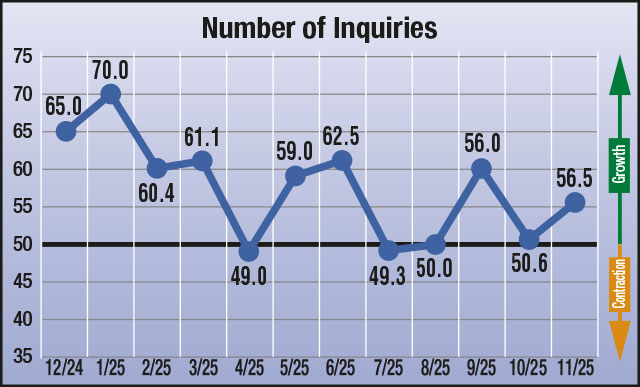
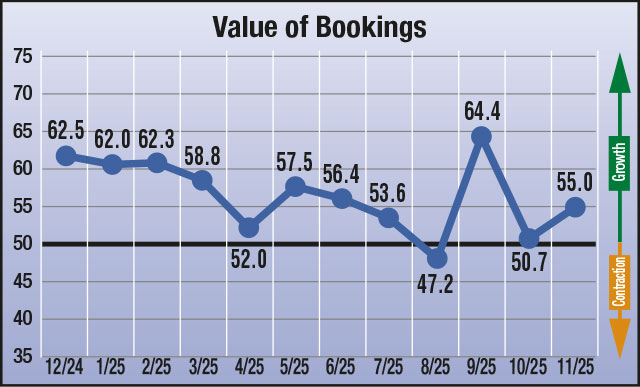
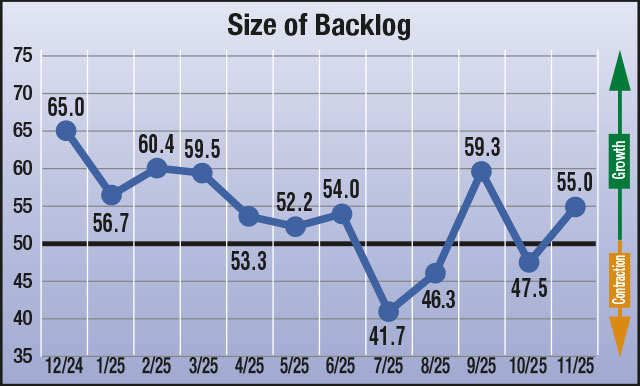
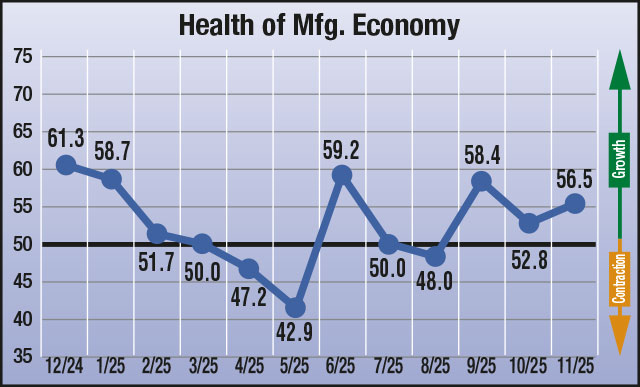
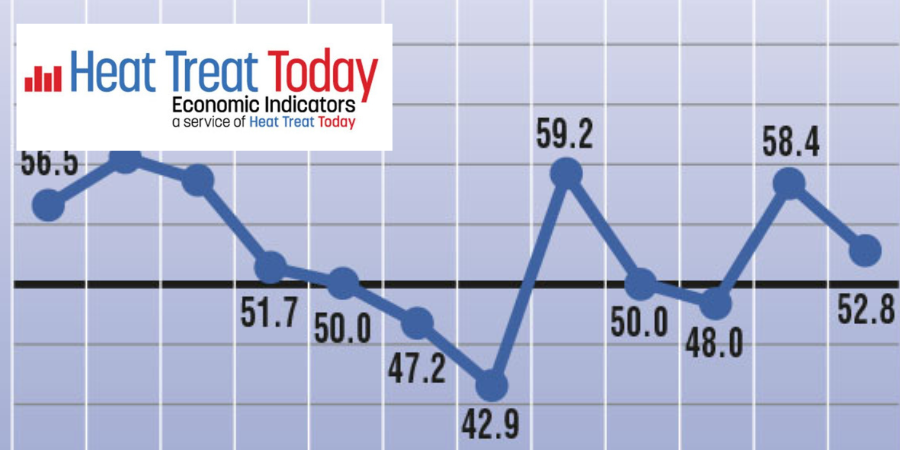
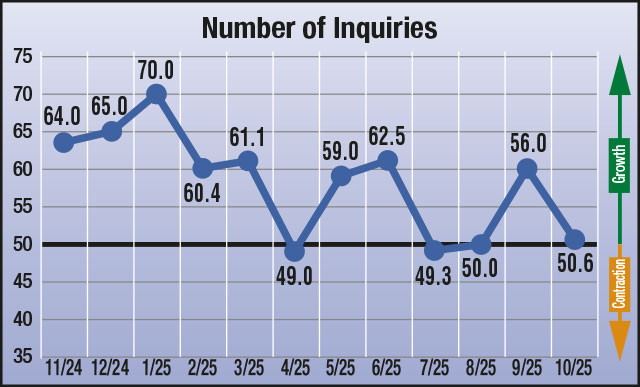
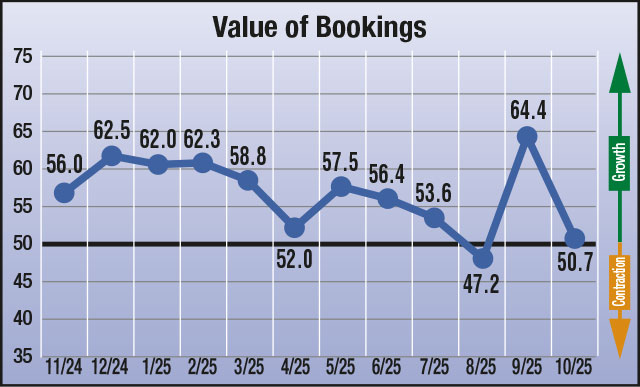
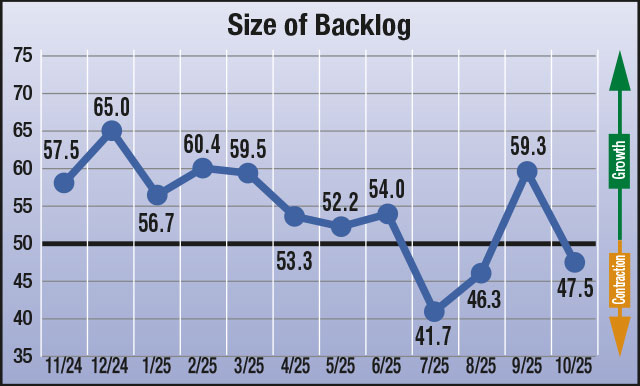
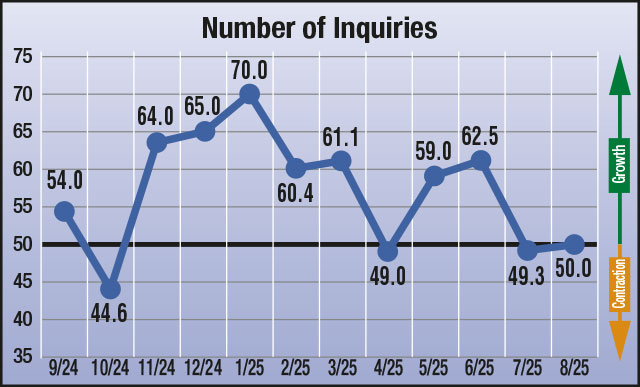
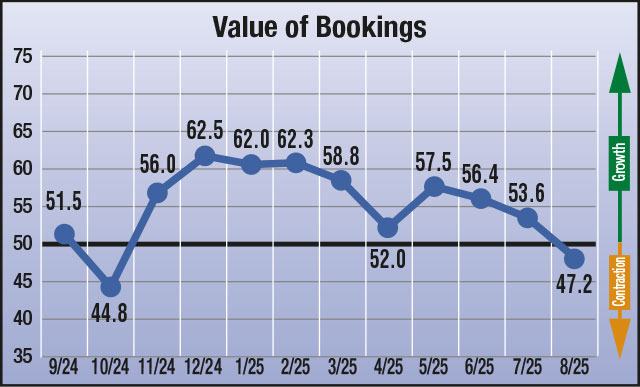
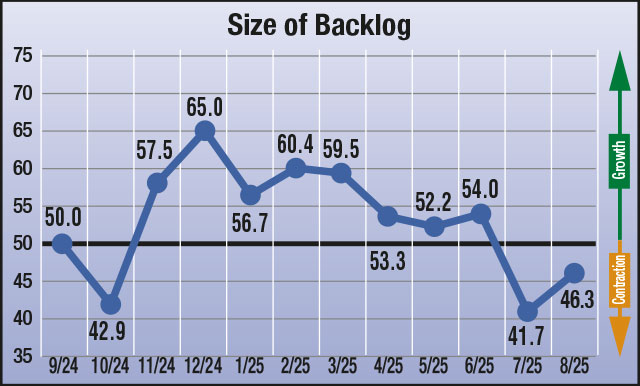
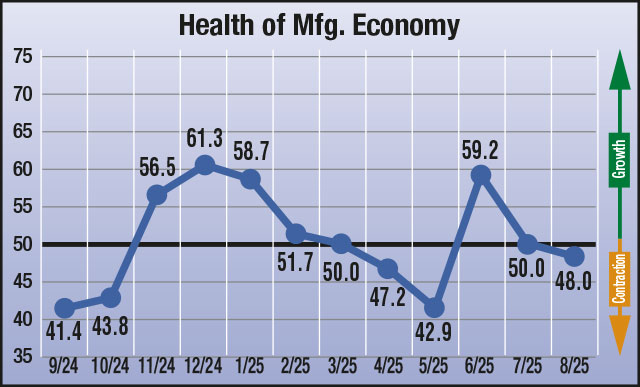
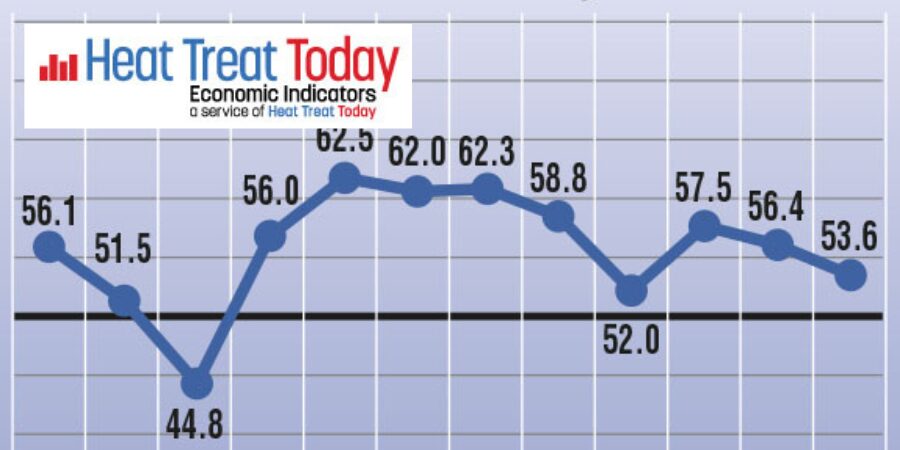
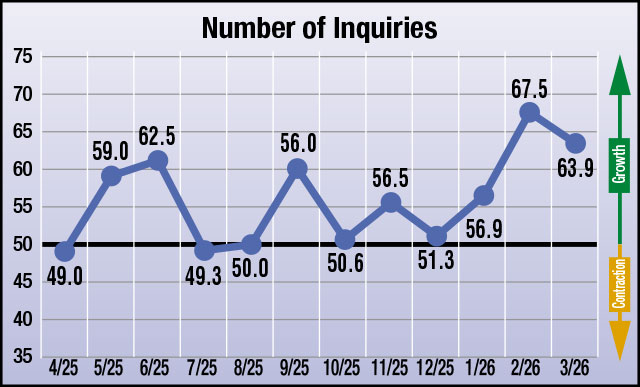
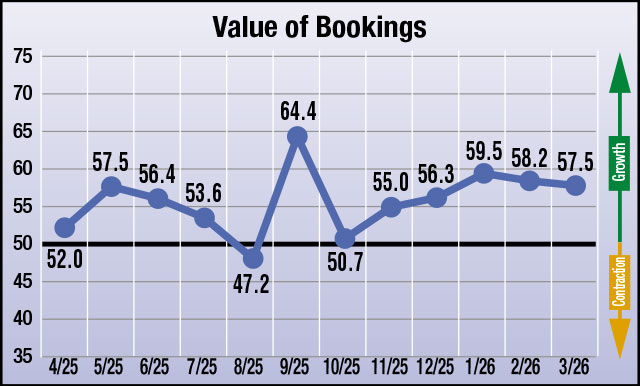
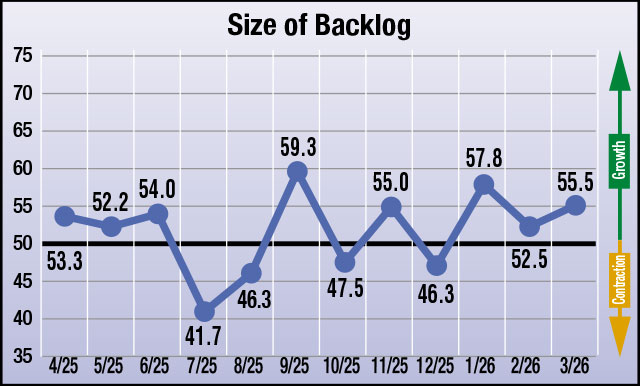
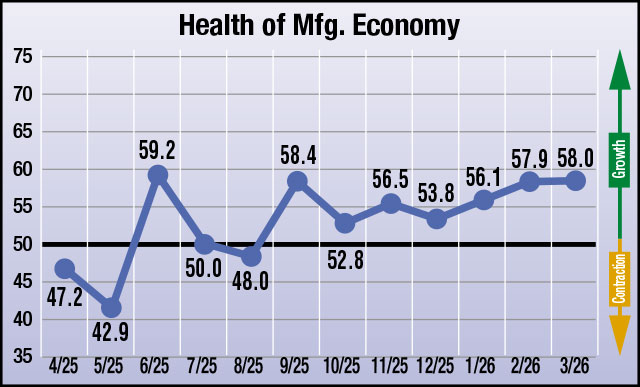
March’s data indicates anticipated continued growth across the heat treat industry, as all four indices remain above the growth threshold. Inquiries are projected to stay strong at 63.9 (from 67.5 in February). Bookings are expected to hold in healthy expansion territory at 57.5 (from 58.2 in February). The Backlog index continues to forecast growth at 55.5 (up from 52.5 in February). Finally, the Health of the Manufacturing Economy index growth expectations remain constant at 58.0 (up from 57.9 in February).
March’s indicators show suppliers anticipating steady demand from heat treaters in the month ahead. With all four metrics projected to remain comfortably in growth territory, the outlook points to continued activity from shops supporting aerospace, automotive, energy, and general manufacturing markets as we move further into the spring production cycle.
The results from this month’s survey (March) are as follows: numbers above 50 indicate growth, numbers below 50 indicate contraction, and the number 50 indicates no change:
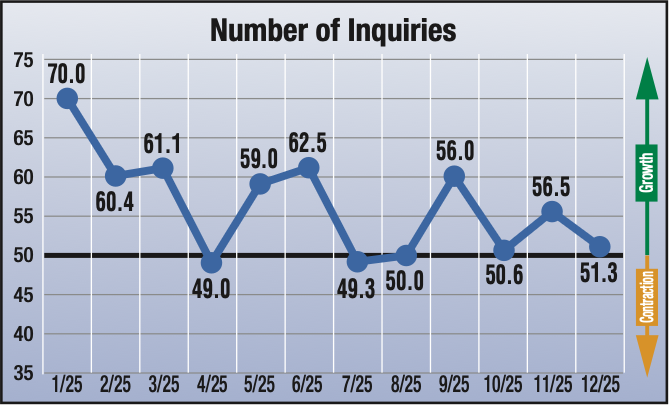
- Anticipated change in Number of Inquiries from February to March: 63.9
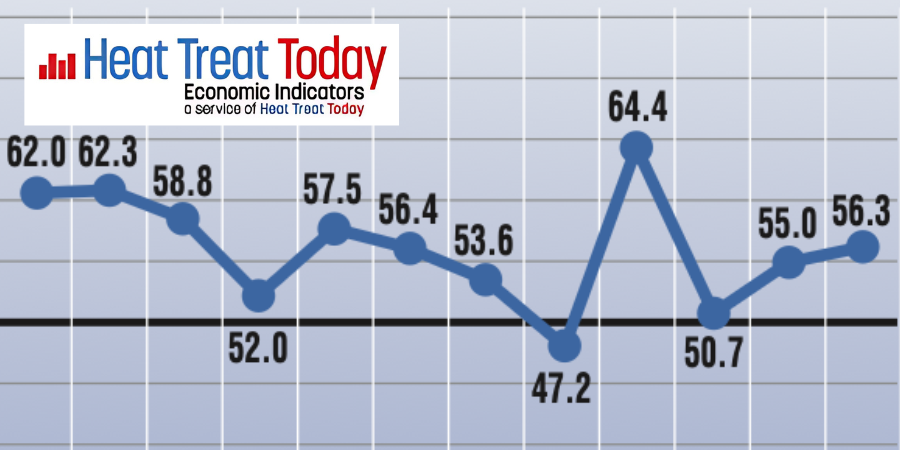
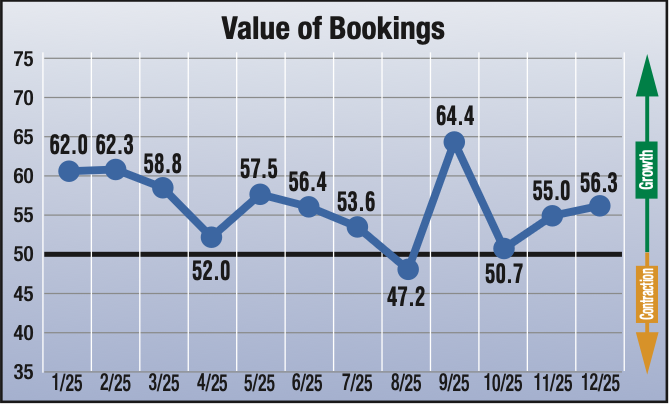
- Anticipated change in Value of Bookings from February to March: 57.5
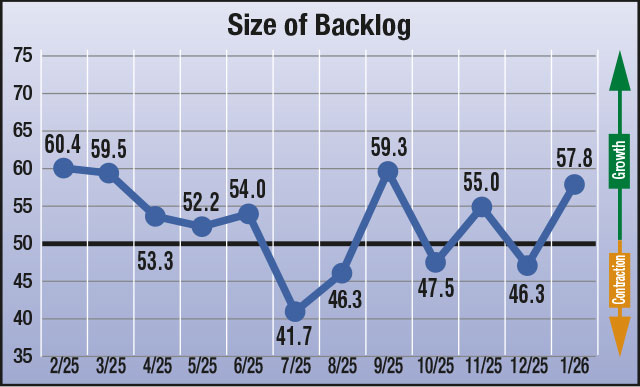
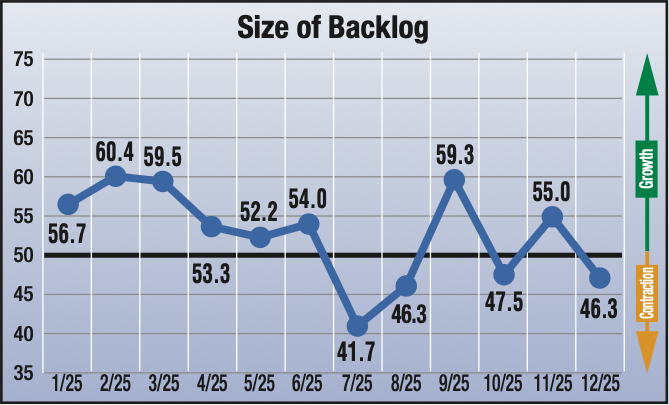
- Anticipated change in Size of Backlog from February to March: 55.5
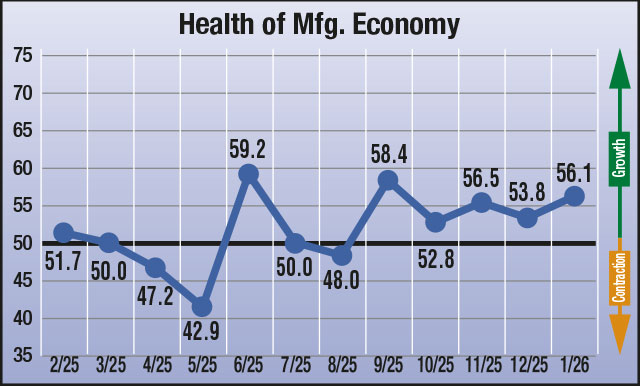
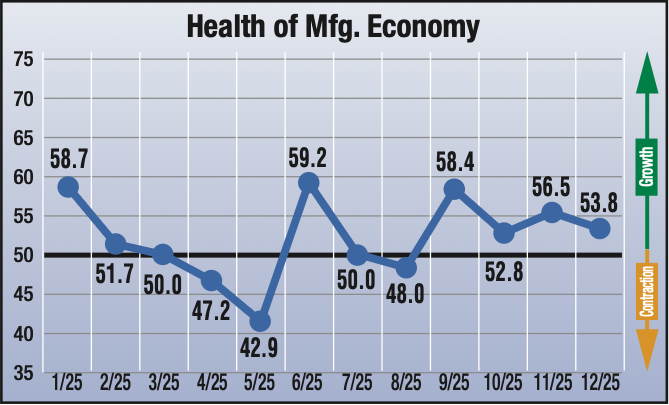
- Anticipated change in Health of the Manufacturing Economy from February to March: 58.0
Data for March 2026
The four index numbers are reported monthly by Heat Treat Today and made available on the website.
Heat Treat Today’s Economic Indicators measure and report on four heat treat industry indices. Each month, approximately 800 individuals who classify themselves as suppliers to the North American heat treat industry receive the survey. Above are the results. Data collection began in June 2023. If you would like to participate in the monthly survey, please click here to subscribe.

Heat Treat Economic Indicators for March: Continued Growth Expected Read More »